DayRate
- ユーティリティ
-
Maxim Kuznetsov
 My big personal project : http://nektomk.ru/en:atcl:start
Integration MT4 with world via Tcl :-) Excel, Mail, Networking, Rest-API, Websockets and many many others are accessable from MetaTrader. - バージョン: 2.3
- アップデート済み: 9 11月 2024
- アクティベーション: 5
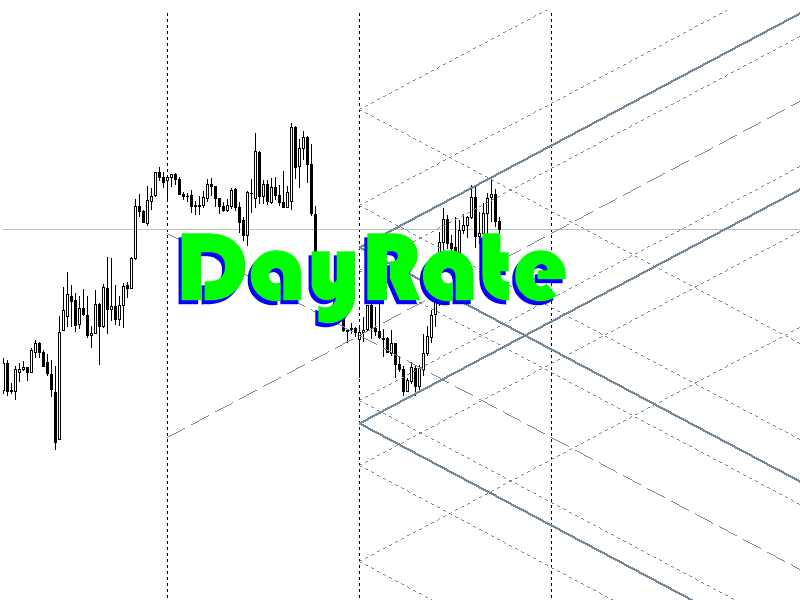
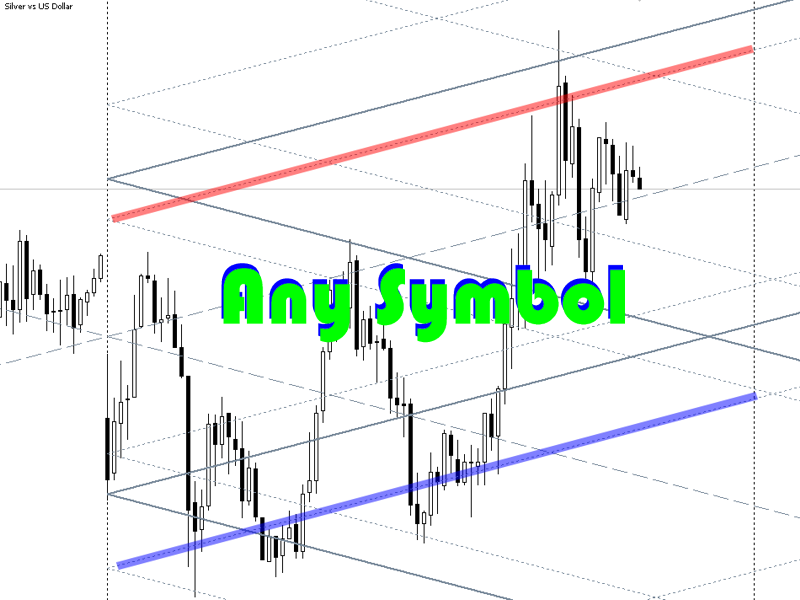
The script calculates the rate of price change and its deviation. Displays a typical price movement channel. Transfer the script to the chart and it will automatically mark up the channels through which the price can move in the near future. Place orders according to the channel boundaries.
The script uses statistical methods to determine the rate and amplitude of the price. It calculates and displays channels and limits of further movement based on them.
Parameters
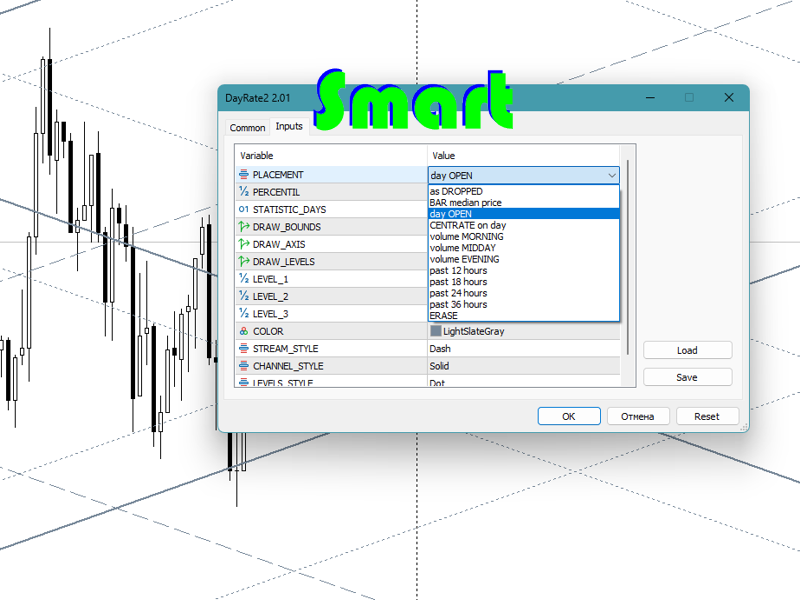
- PLACEMENT - channel placement options.
- as DROPPED - the center of the channels will be placed at the coordinates specified by the user (where the script is thrown)
- BAR median price - at the median price of the specified bar
- day OPEN - at the time of the opening of the day. This is the default value for PLACEMENT
- CENTER on day - channels will be centered on the specified day
- volume MORNING - channels will be centered on the first half of the tick volume (in the morning part)
- volume MIDDAY - centering channels along the central part of the volumes
- volume EVENING - centering on the evening part of the volumes
- past 12/18/24/36 hours - center the channels according to the specified number of hours
- ERASE - erase previous builds
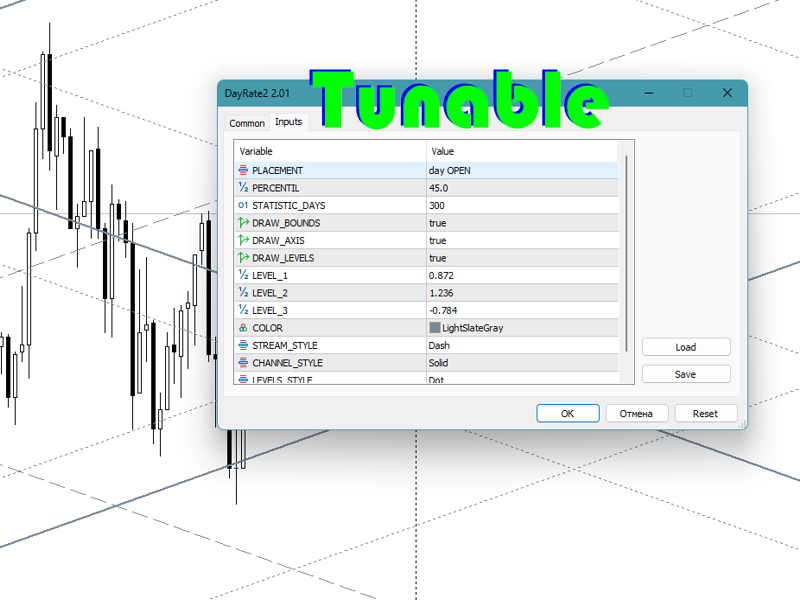
- PERCENTIL is the statistical percentile for calculation. 45% is an appropriate value for most cases. If you expect a prolonged increase in volatility, specify a slightly higher PERCENTAGE.
- STATISTIC_DAYS - the number of days for which statistics are calculated. By default, 300.
- the switches DRAW_BOUNDS, DRAW_AXIS, DRAW_LEVELS - indicate which components to draw
- the LEVEL_1 LEVEL_2 LEVEL_3 parameters - indicate the location of additional levels
- other parameters allow you to set the color and styles of drawing lines
Trading
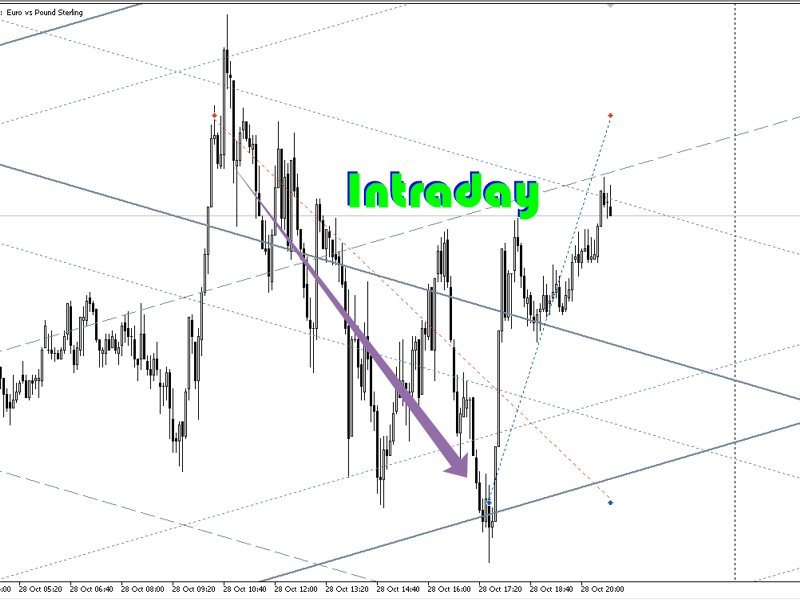
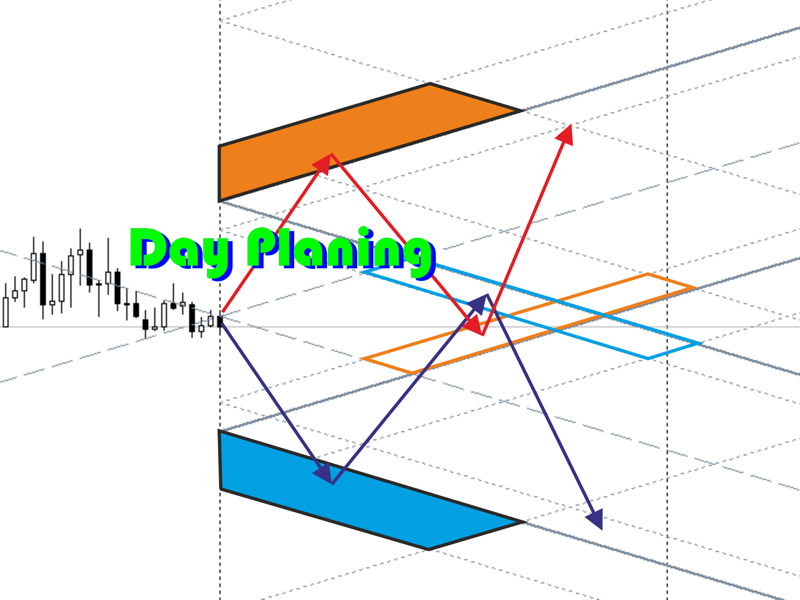
Just move the script to the current day. By default, channels are built from the beginning of the day.
The price will move along the axes indicated by the dotted line, reaching the boundaries indicated by solid lines.
Additional lines indicate possible deviations. With sharp impulses, the price can reach distant levels and move to the next channel
In accordance with these scenarios, place and move orders
Analytics
To analyze historical moments, move the script to the time of interest and specify the preferred centering.
Study the price behavior under the influence of different events
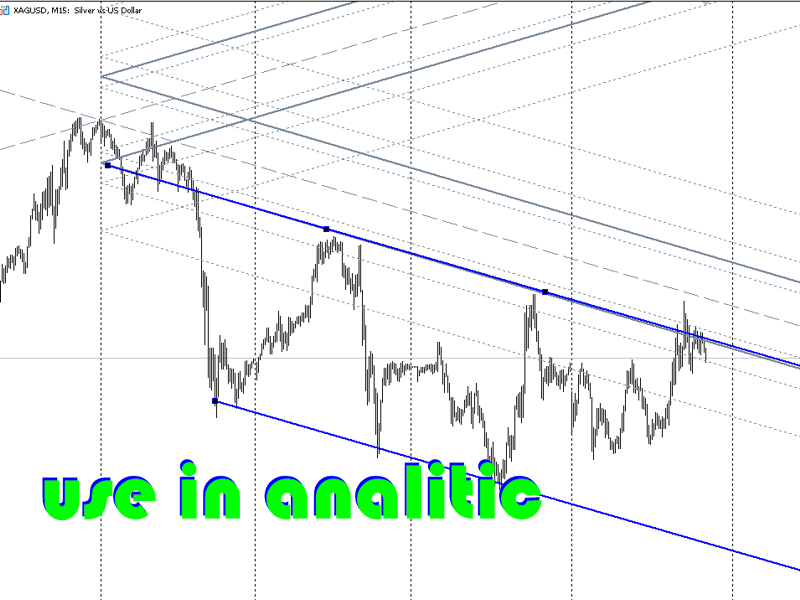
Graphical analysis
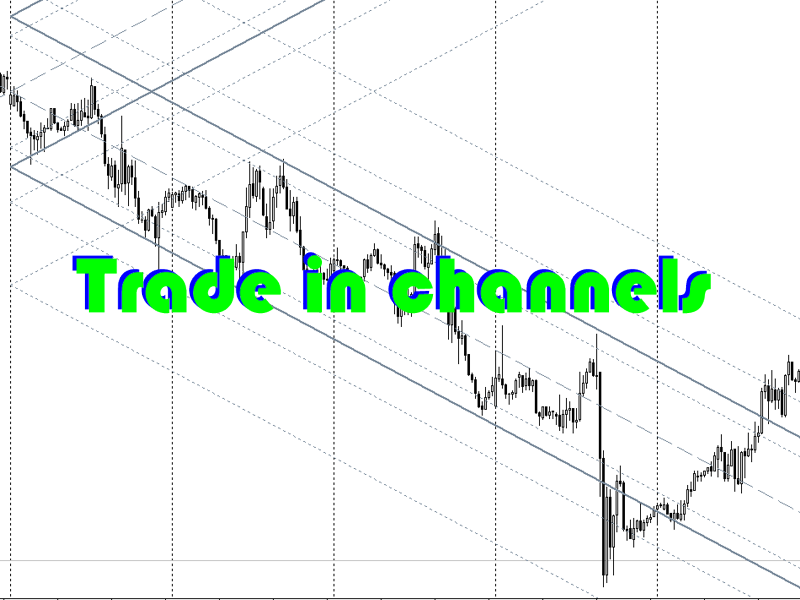
When plotting lines of graphical and wave analysis, use lines parallel to the DayRates channels as reference
Money Management
Take into account the data of DayRates (the rate of price change and the amount of deviations) when calculating risks and managing volumes