Intraday Magic MT5
- インディケータ
-
Maxim Kuznetsov
 My big personal project : http://nektomk.ru/en:atcl:start
Integration MT4 with world via Tcl :-) Excel, Mail, Networking, Rest-API, Websockets and many many others are accessable from MetaTrader. - バージョン: 1.0
- アクティベーション: 5
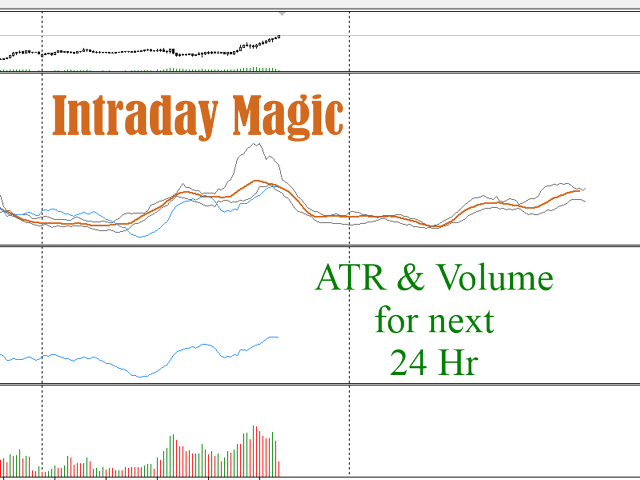
IntradayMagic predicts the nature of ATR and tick volumes for 1 day ahead. The indicator does not redraw and does not lag behind. Using Intraday Magic, you can significantly improve the quality of trading and avoid unnecessary risks. According to its indications, you can detect the crisis state of the market and the moments of trend reversal, specify the moments and directions of entries.
How the indicator works
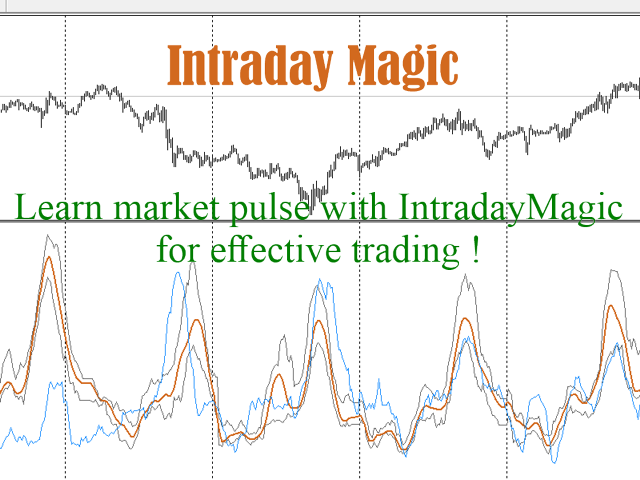
Periodic events, exchange schedules, Bank schedules, expirations, and other similar events form a unique activity structure for each instrument. This structure is fairly constant and similar to a person's heart rate, only changing slightly over time. Intraday Magic analyzes the 2-month history, and based on it makes a forecast for 24 hours ahead. Differences in forecasts and results indicate a crisis and a possible trend reversal.
In a normal market rhythm, the indicator can be used as an accurate, non-lagging ATR and use it to determine the optimal moments of entries.
Parameters of the indicator
The indicator has only 1 significant period parameter, which has the same meaning as the same ATR parameter. By default, it is also 14. The parameter can't be less than 5 or more bars per day.
For use with non - round-the-clock instruments, use the HOURSINDAY parameter-the number of hours in the trading day.
Display of the indicator
The indicator is displayed in the sub-window as four lines:
- Magic-orange smoothed line, forecast of ATR dynamics and tick volumes. It is about 1/2 PERIOD ahead of the ATR and quite accurately coincides with tick volume fluctuations.
- Min, Max-gray non-smoothed lines show the limits of Magic accuracy.
- ATR- blue line, the predicted ATR.
gray lines are calculated for 1 day ahead, and the farthest value is gradually refined. The Magic line is slightly shorter and constant throughout the display
The values are measured similarly to the ATR and can be used instead of its readings.
Recommendations for trend trading
In trends, it is recommended to make entries in the direction of the trend, after the Magic line turns up. The line is known in advance and you can plan a deal. If the trend weakens, you can perform counter-trend trading a little later than the Magic reversal down.
Determining the trend direction
The General rule is that when Magic increases, the exchange rate mostly moves in the direction of the trend. And when falling, it slows down or rolls back less than the previous trend movement.
If you find it difficult to determine the trend, consider the following signs:
The" peaks " of the price when Magic turns down indicate the direction of the trend.
Price differences at minimum prices also indicate a trend.
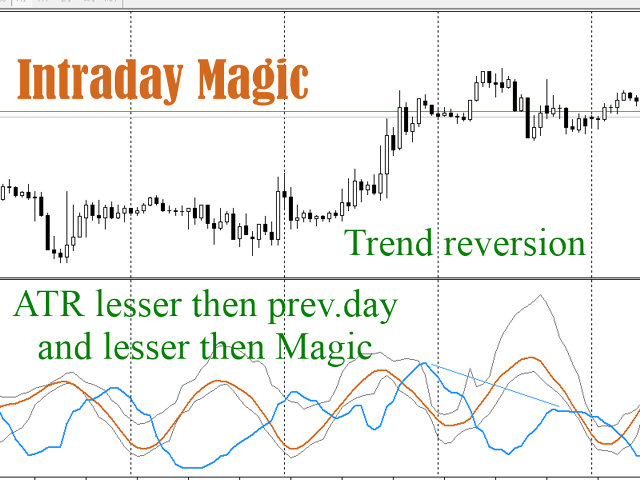
Local crises and signs of reversals
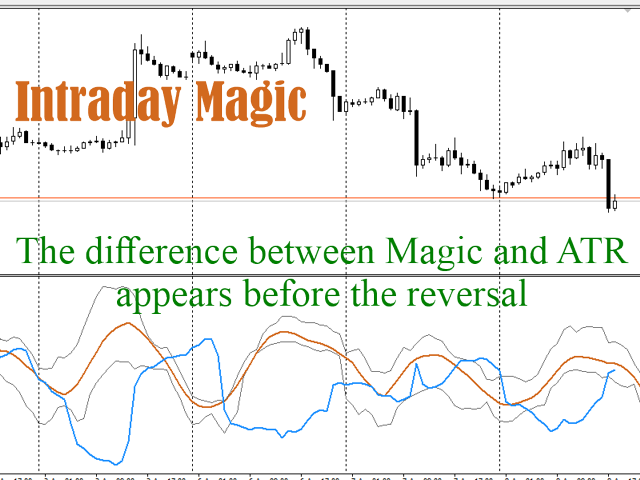
Significant differences between ATR (or tick volumes) and IntradayMagic forecasts indicate changes in the traded instrument. This in turn leads to sharp" spikes/impulses " of the price or a trend reversal.Прогнозирование нового дня:
- If on the previous day, ATR movements were clearly ahead, this often precedes a trend change
- If the ATR did not fall close to the Magic lows on the previous day, then a sharp price impulse or GEP is likely
- When the ATR highs decrease for 2-3 days and do not reach Magic in the past it means that the current trend is exhausted Учтите, что каждый инструмент индивидуален и у каждого общие признаки немного отличаются и есть собственные, уникальные.
By studying the "pulse of the market" using Intraday Magic, you can find more subtle ways to forecast and improve your strategies.
I wish you success in trading !