DYJ Mathematical model trader

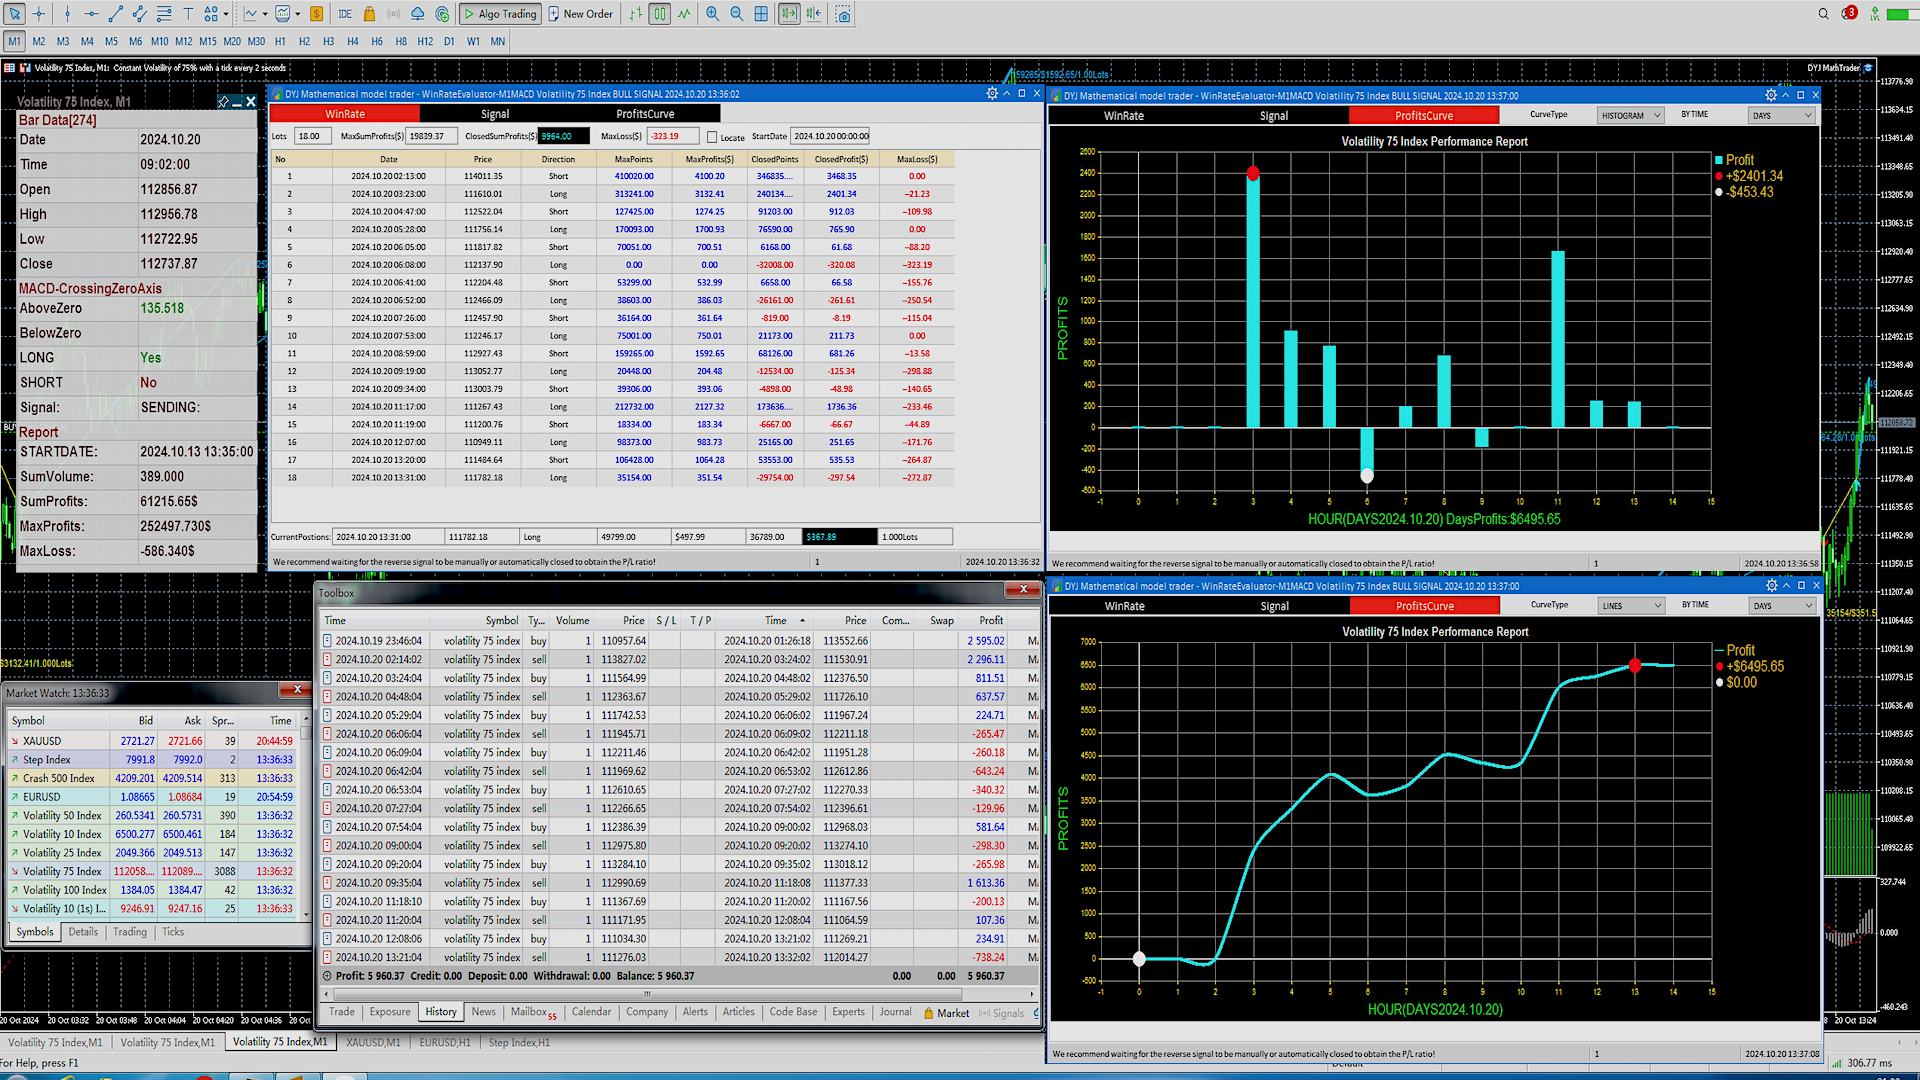
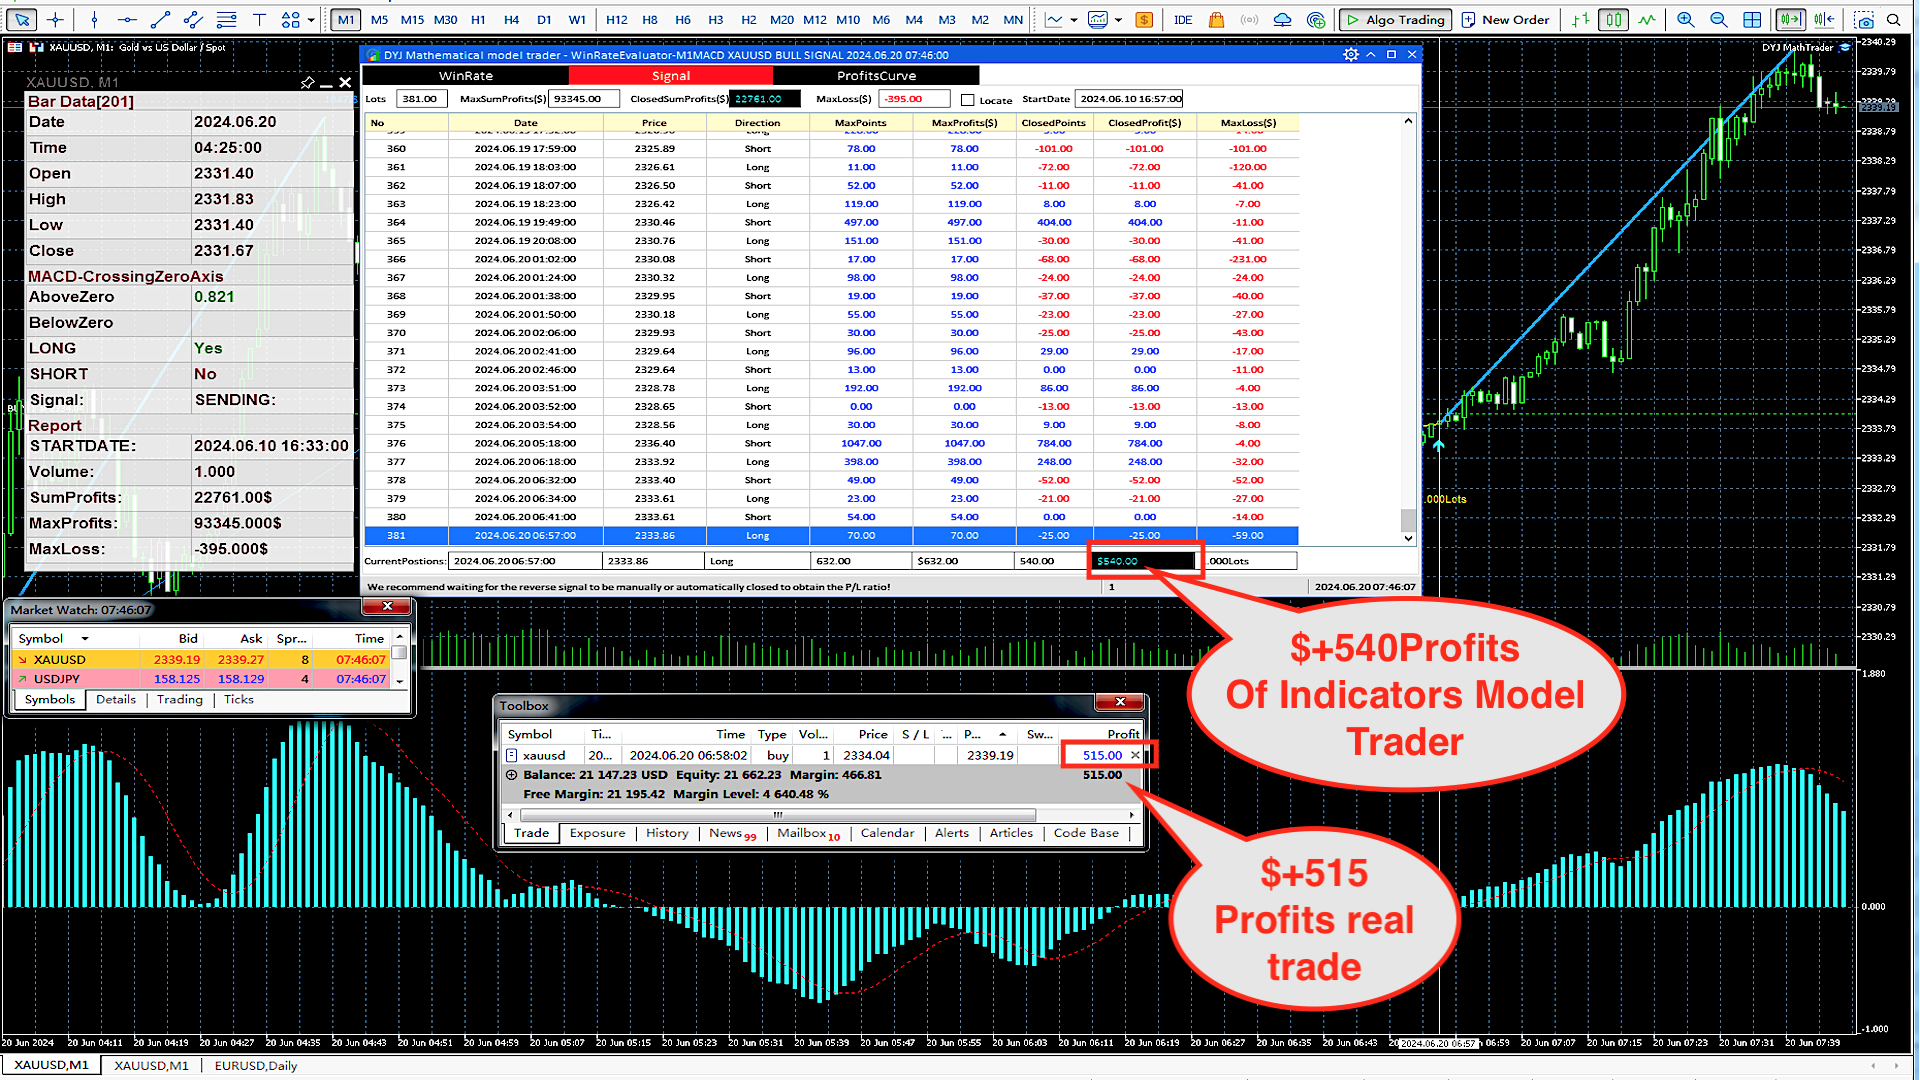
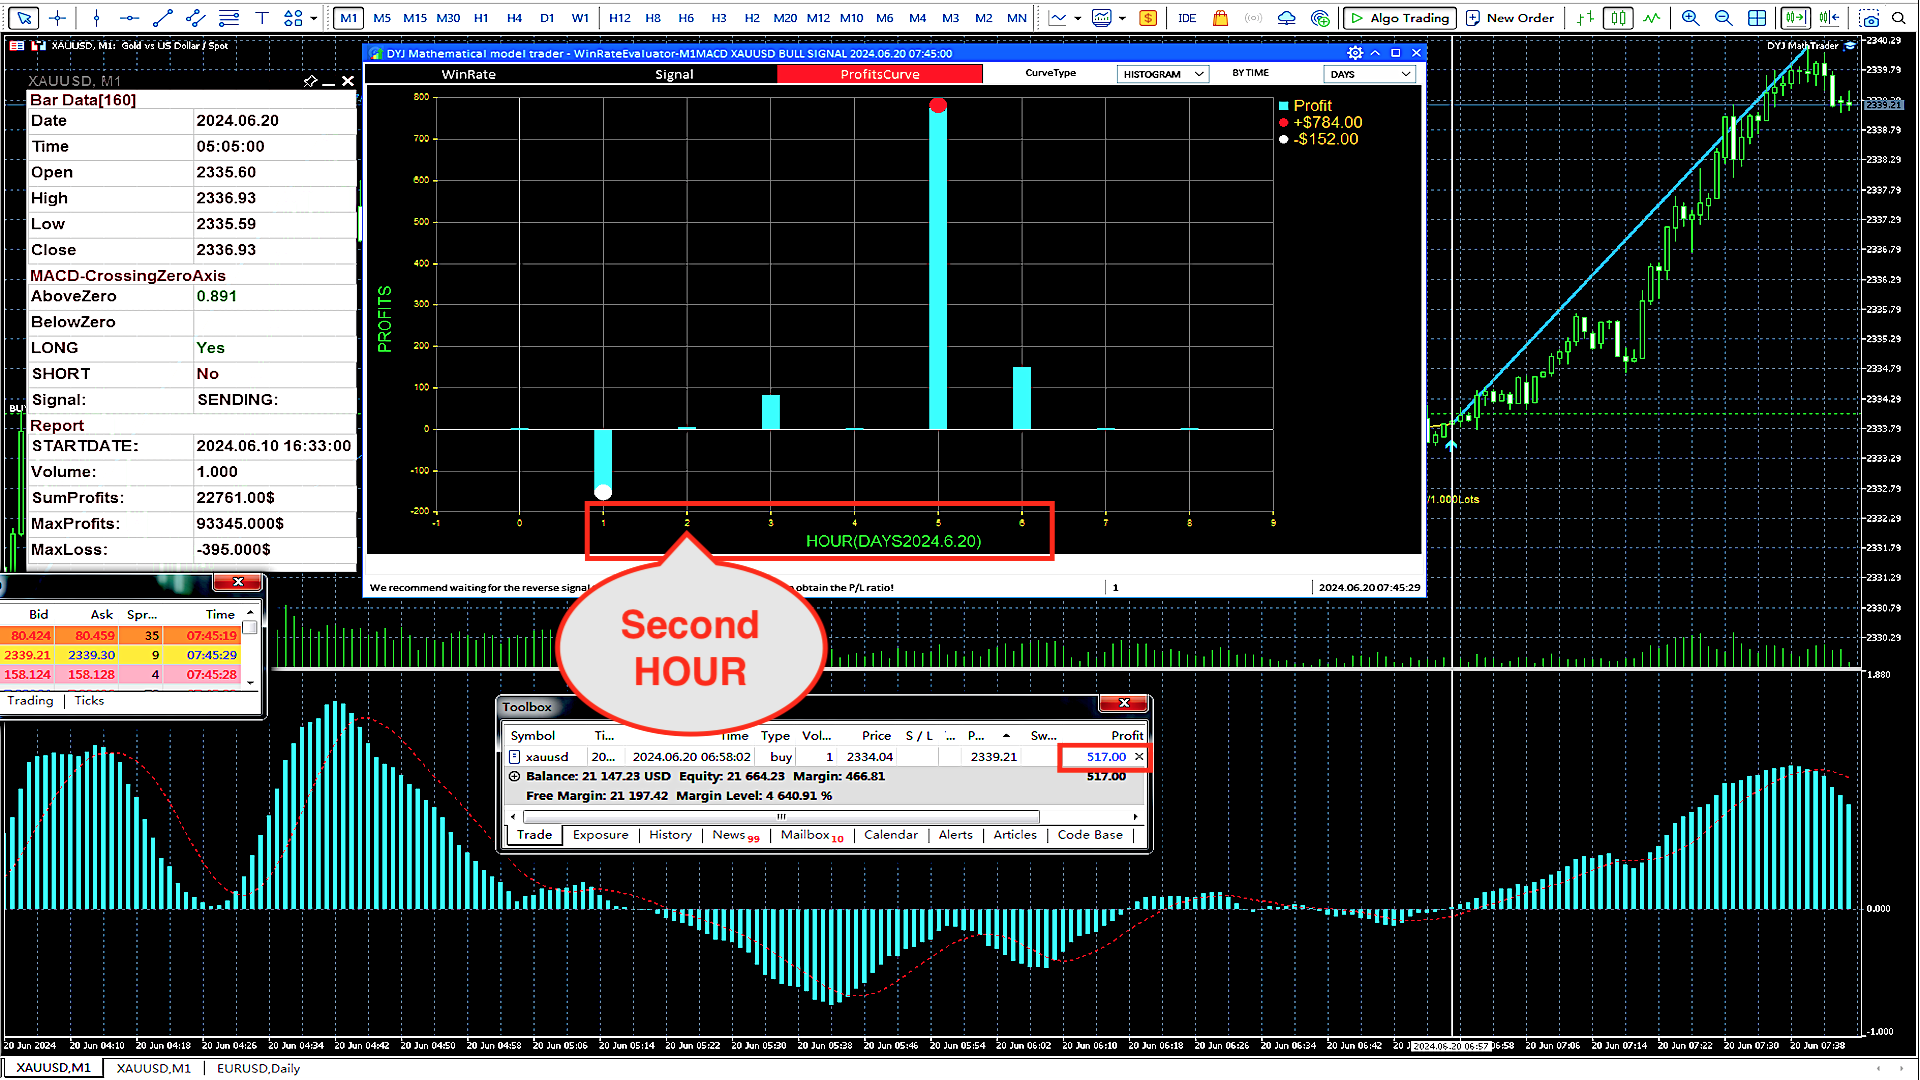
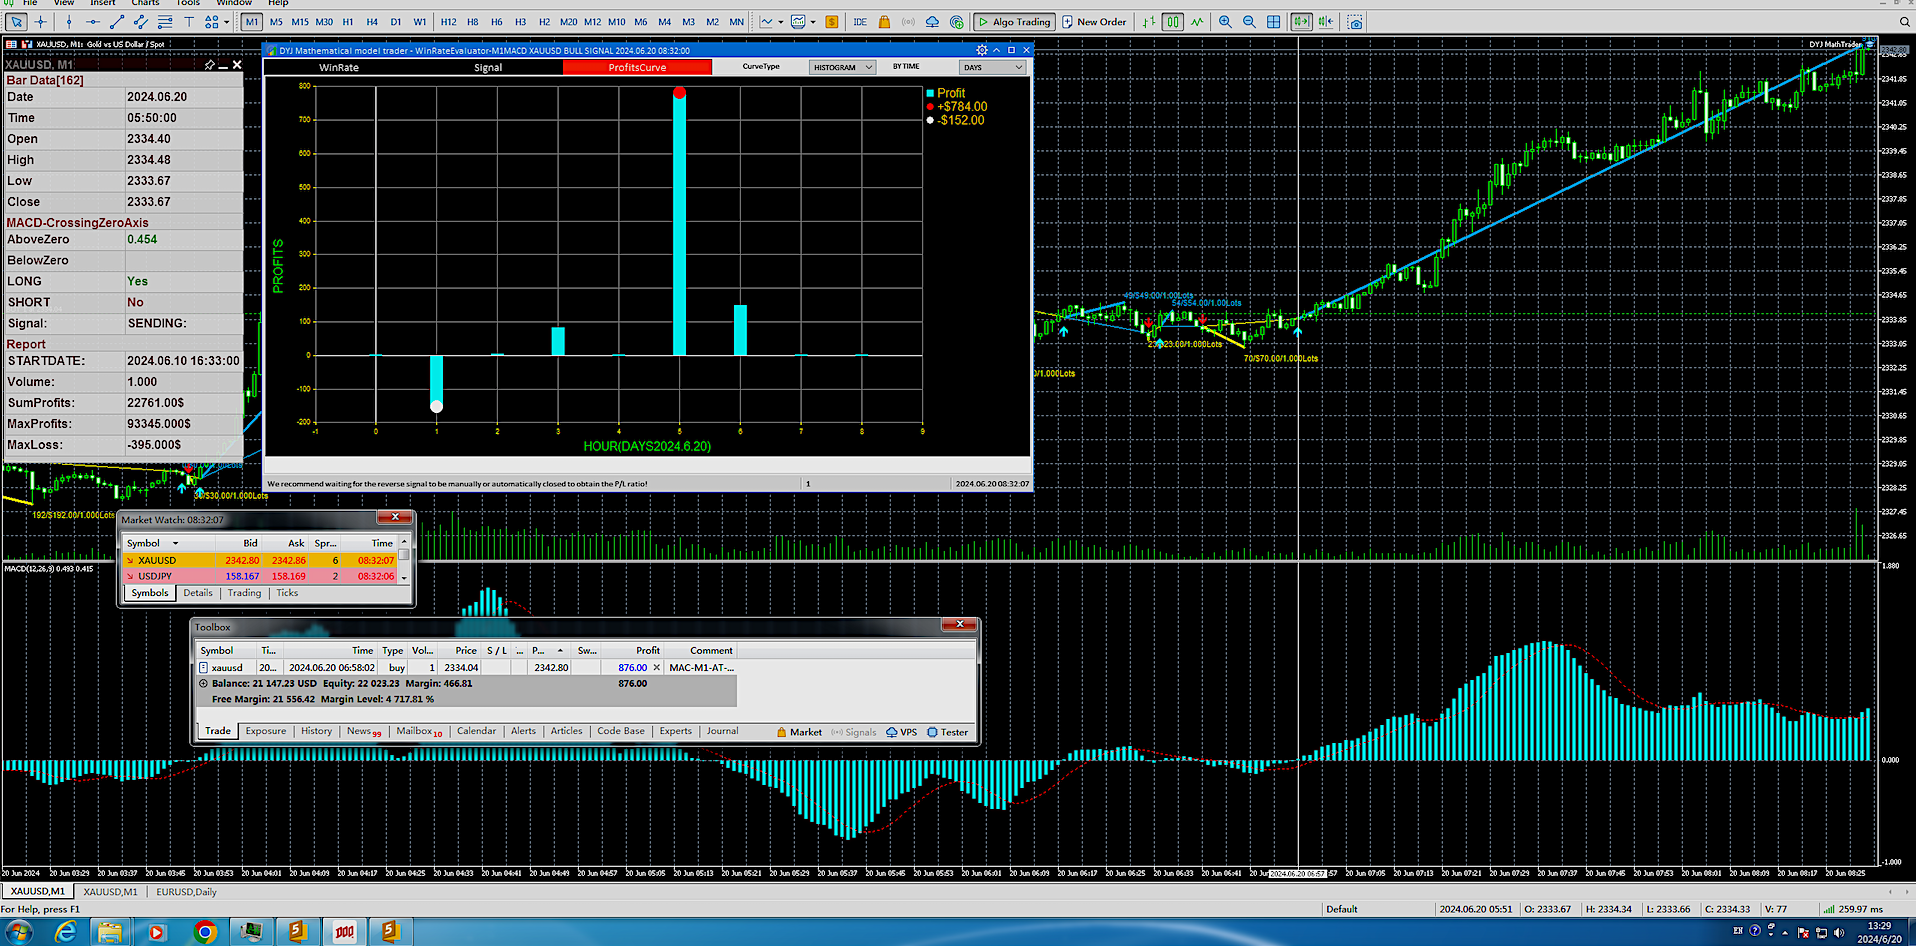
DYJ Mathematical model trader is a system analysis software that allows indicator trading.

It can directly analyze the overall profit and maximum floating loss of indicator trading.

And draw beautiful performance histograms and curves.

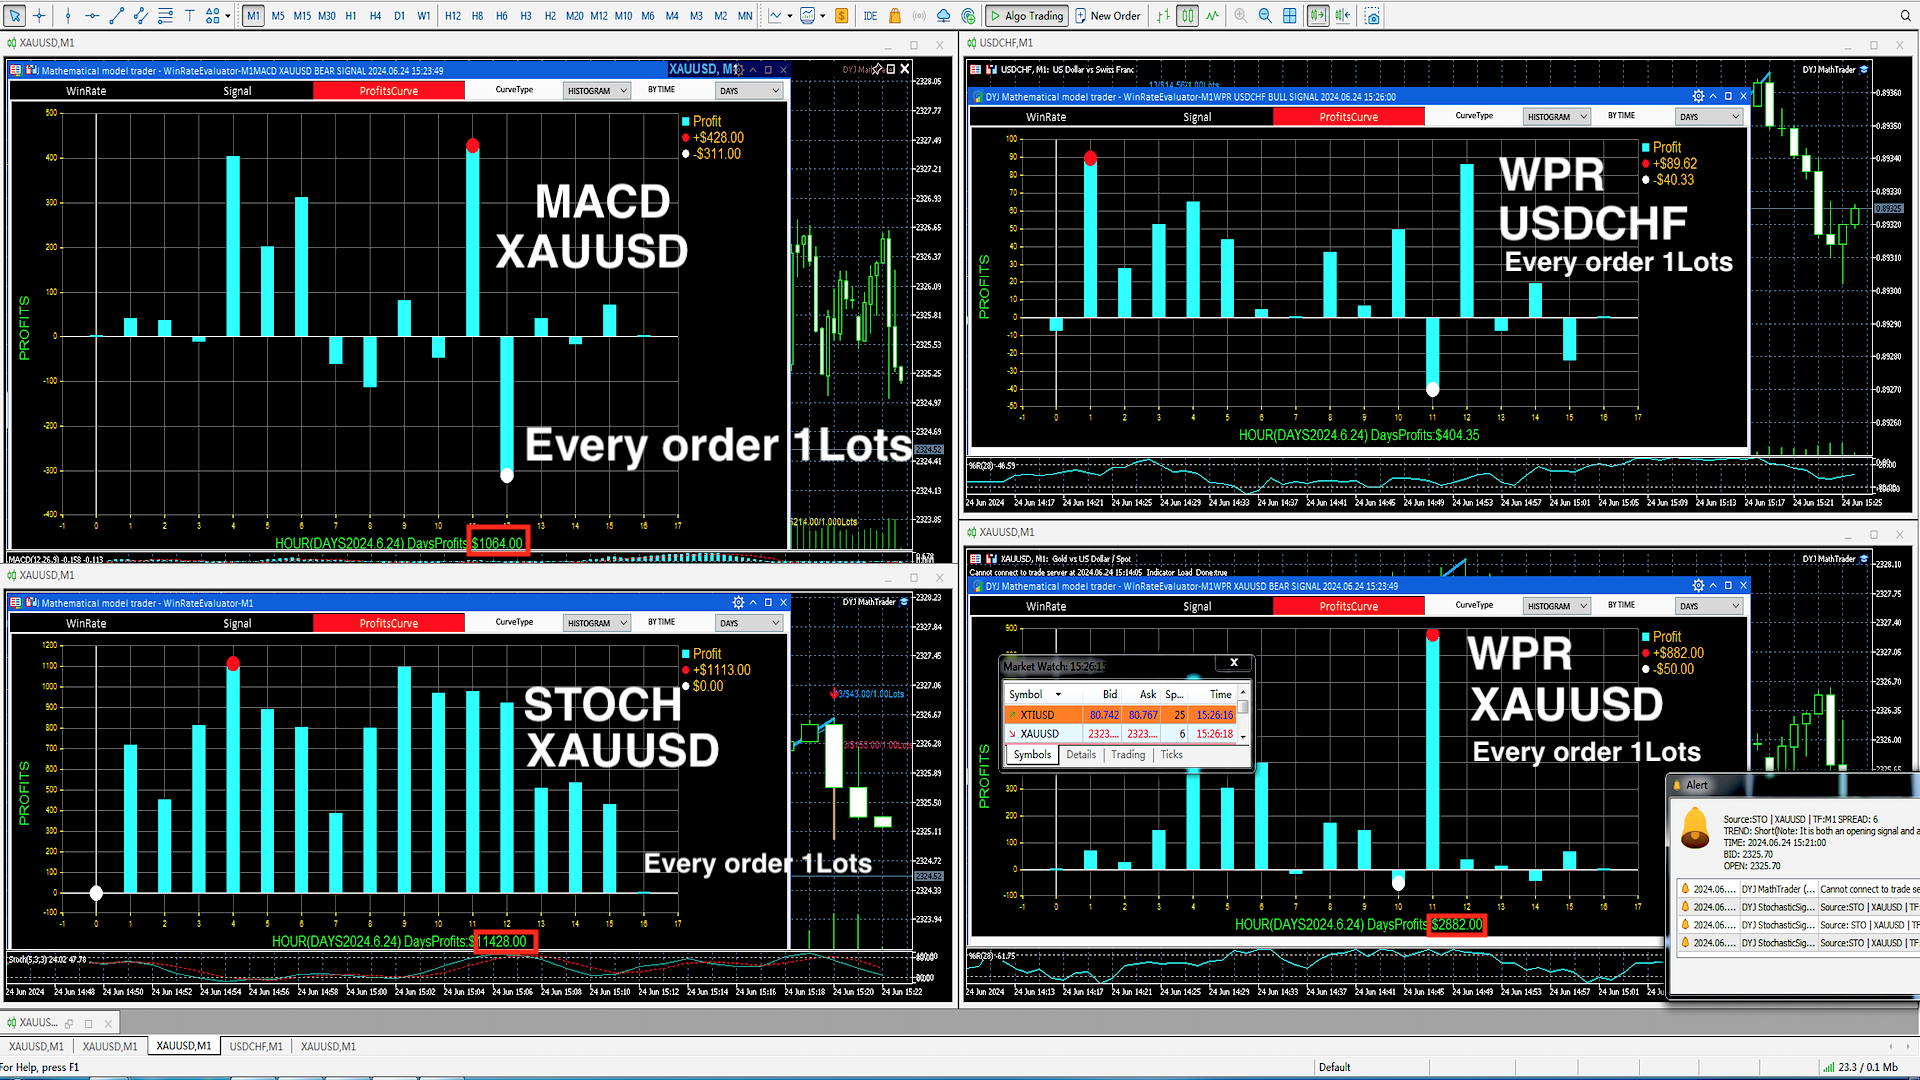
In this way, you can compare the different performances of indicators in each chart period,

which is convenient for you to quickly respond to market trend changes

and optimize the best trading plan.

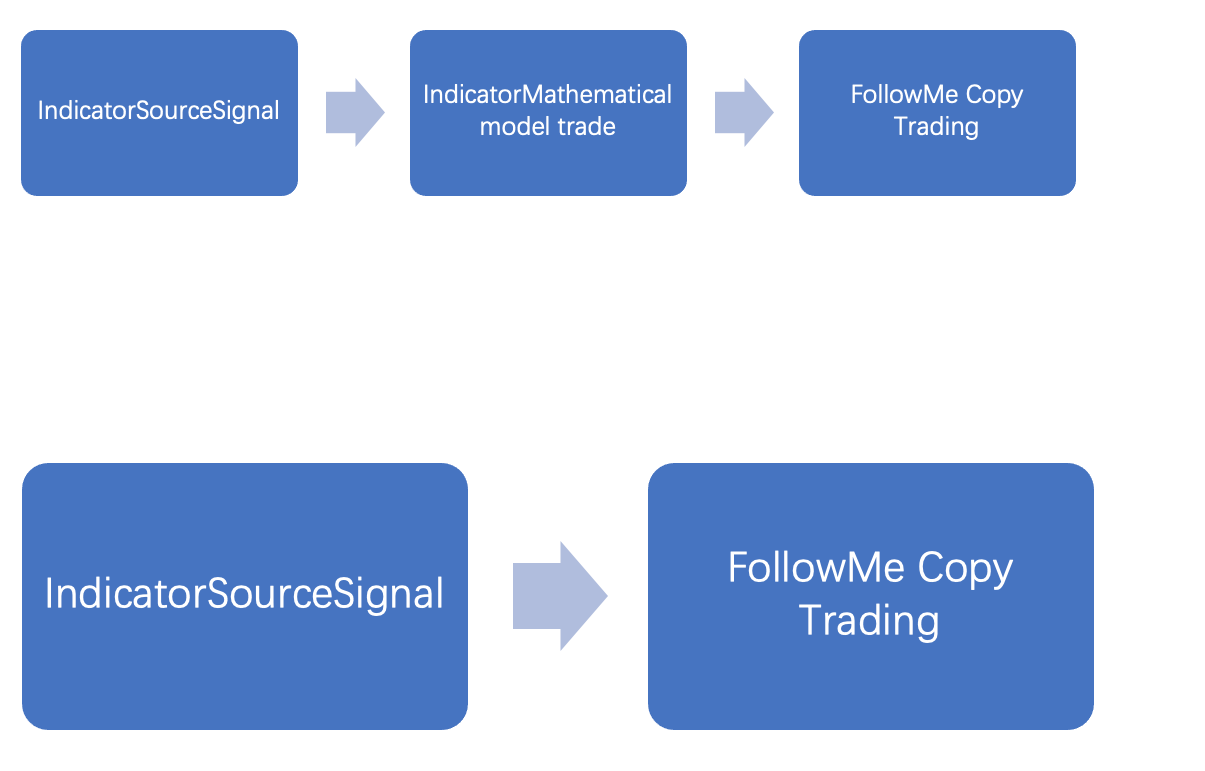
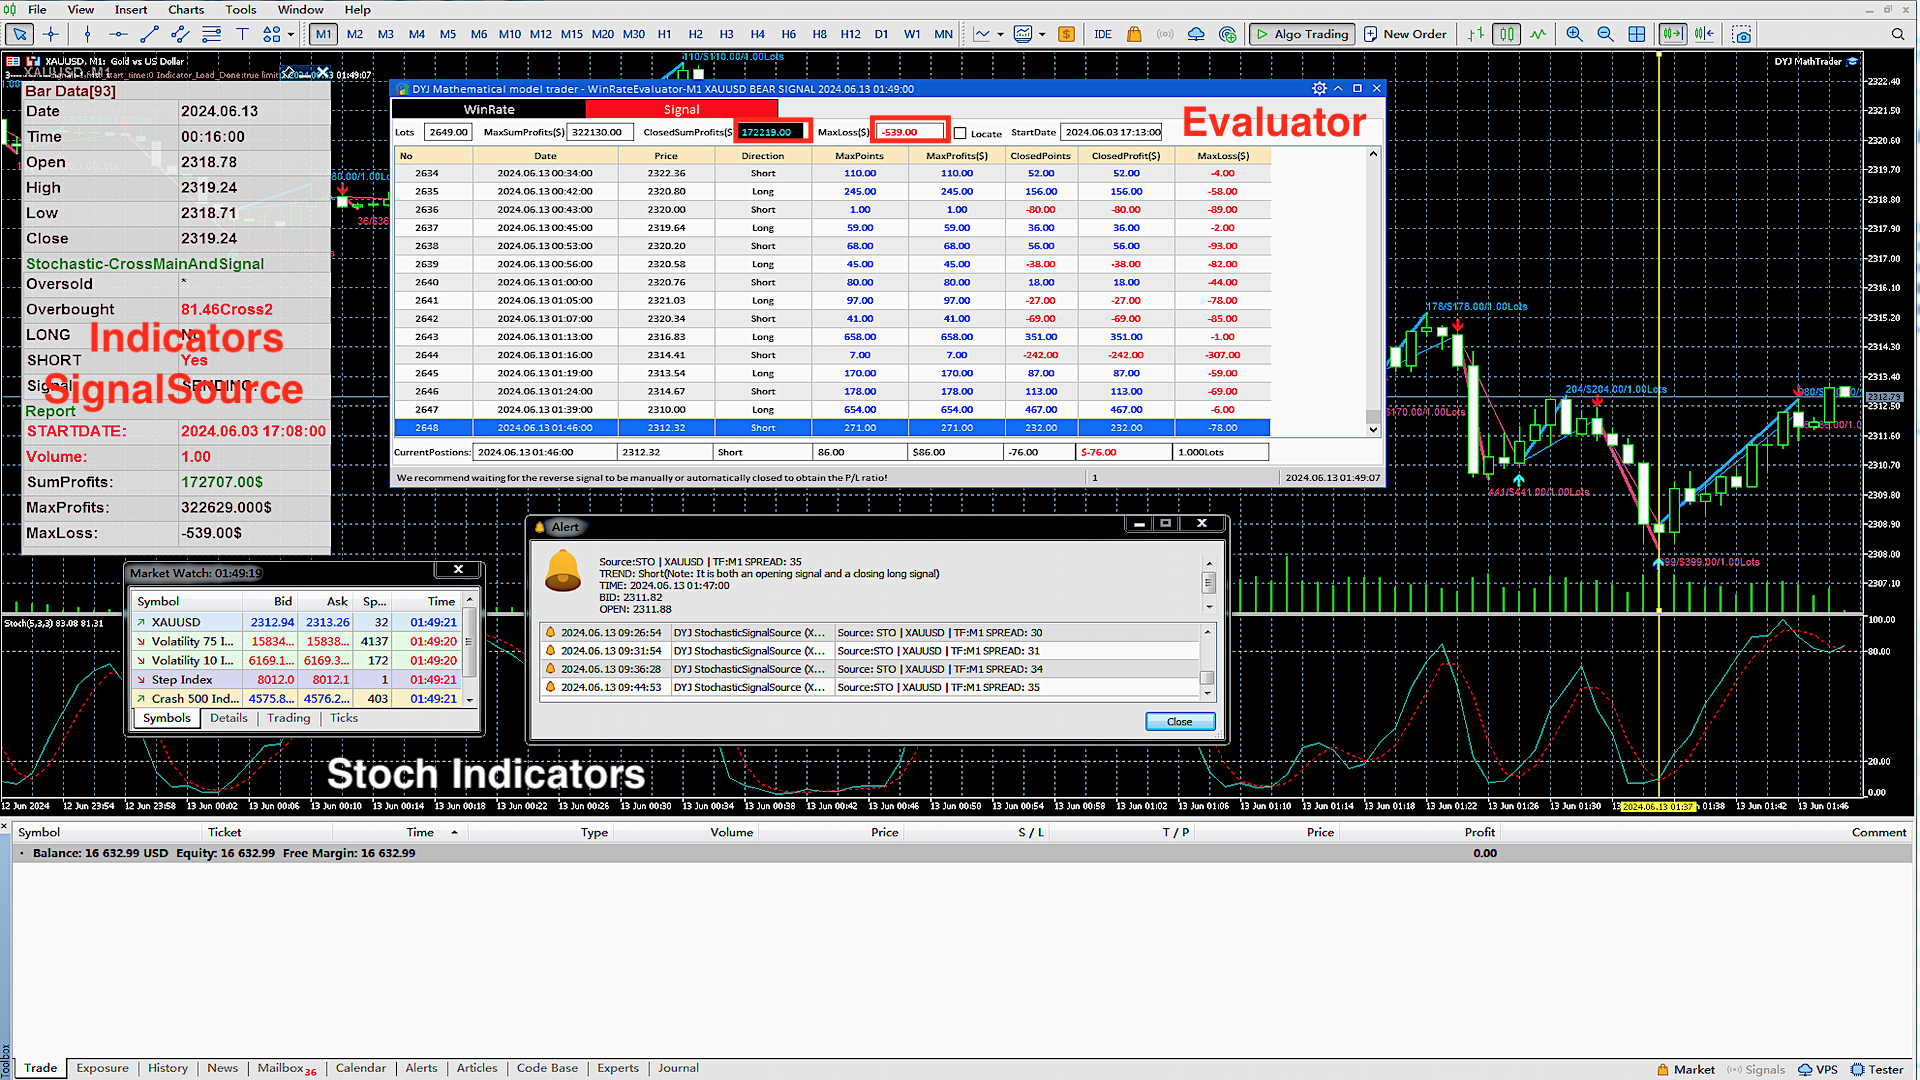
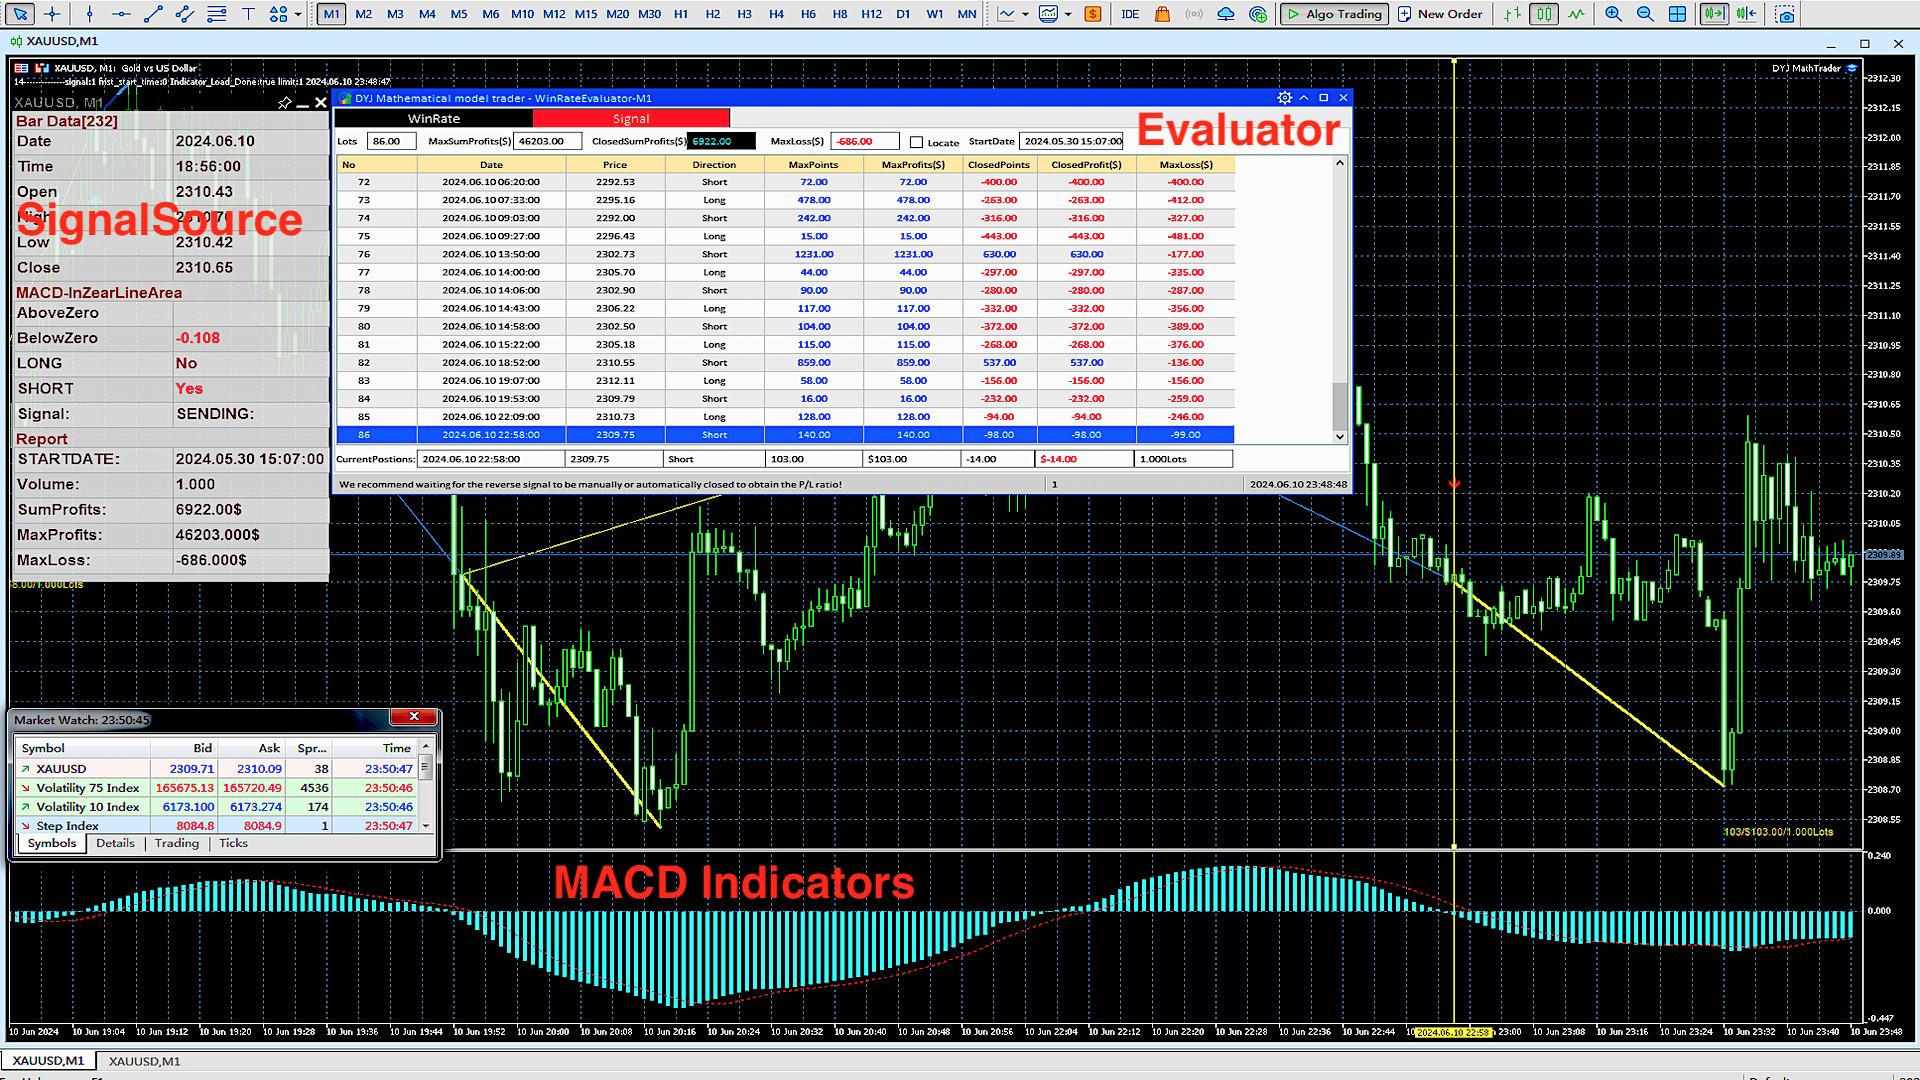
It requires an improved indicator signal source software, as shown in screenshot 1

Currently, these signal source indicators include WPRMACDSTOCHASTICRSI, SMTMA

You can run the DYJ signal source software and underlying indicator software at once through the DYJ Mathematical Model Trader software.

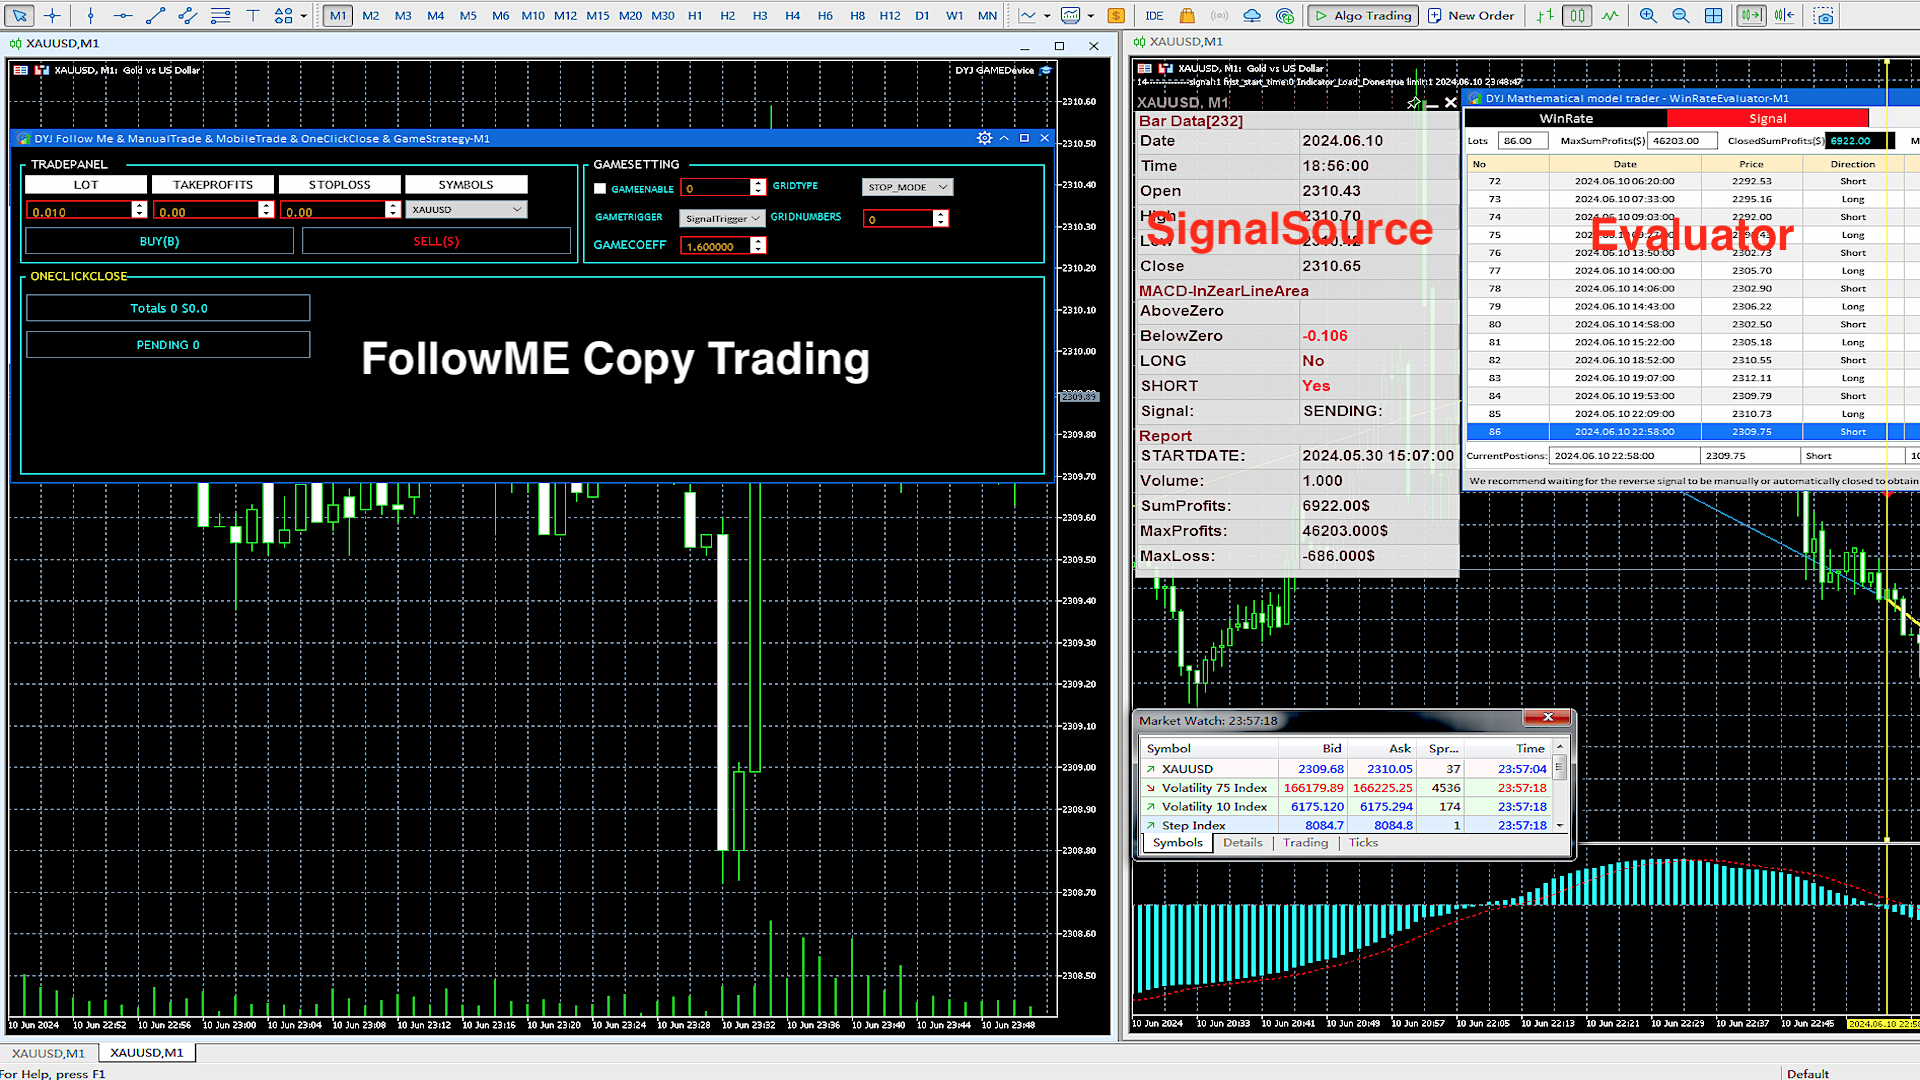
If you need to automatically open and close positions according to the signal source, please download the practical software DYJ Follow Me or a better DYJ Game Device with game strategy

If you strictly follow the model synchronization, the total profit of the final result is consistent or close to the total profit of the model.
Due to some discrepancies, handling fees, inventory fees, platform server delays, slippage, VPS network speed, etc., there may be some small errors!

But as long as there are many major trends and the trend maintains for a long enough time, with few minor trends and oscillations, it is enough to cover the above error!

However, throughout the entire process, you need to have a good mindset and self-discipline!

Therefore, we need to strictly select the lowest point spread and handling fee for the platform ECN account, as well as choose the platform server speed and the fastest local network speed!


Note

  • After downloading the software to your computer, please change the file name to a shorter one, such as DYJ MathTrader. Otherwise, sometimes the MT5 system restricts the length of internal combination names to no more than 63, which may cause the software to not run properly!
  • It is prohibited to use multiple TIMEFRMES to operate the same signal source and FollowMe software.
  • It is recommended to run the signal source and tracking software on the first MT5 terminal(exp:XAUUSD M1), and run the evaluation software and signal source on the same account on another MT5 terminal(exp:XAUUSD M5) for evaluation, in order to minimize tracking delay as much as possible.
  • In addition, the version of MT5 requires Version: 5.00 build 4380 7 Jun 2024
  • Please click on the link to enter the comment section and download different indicator parameter templates. Link

Input

[General]

  • InpUseLanguage = English -- English or Chinese
  • InpDirectoryName="Markets"  -- MarketsDirectory(MT5)
  • InpFileName = "DYJ WPRS" -- InpIndicatorsName : After purchasing the indicator, it is usually automatically downloaded to the Markets directory
  • signal_source_name="WPR" -- Currently supported signal sources: WPR,MACD,STOCHASTIC,RSI,POWERSIGNAL
[InpIndicators]
  • InpIndicatorsParamsList="28" -- Different indicator names have different parameter lists, separated by English commas
WPR:28 -- Period

MACD1:12,26,9,0.03,0.02,4 -- Period(12,26,9),OpenLevel=0.03($),CrossDiffValue=0.02($), SignalMode=4(MacdSampling) 

MACD2:55,89,9,0.03,0.02,4 -- Period(55,89,9),OpenLevel=0.03($),CrossDiffValue=0.02($), SignalMode=4(MacdSampling)

STOCHASTIC: 5,3,3,20,80,2 -- Period(5,3,3),Oversold=20,Overbought=80,SignalMode=2(CrossMainAndSignal)

RSI:14,30,70,1 -- Period(14),Oversold=30,Overbought=70,SignalMode=1
SMTMA: 1,30,100 --  1:MATYPE 0 to 9, 30:Smoothing depth , 100:Smoothing parameter 
  • InpSimulatedVolume             = 1 -- SimulatedVolume
  • InpStartDate                         = "19700101" -- StartDate:If it is 19700101(minimum).
  • InpEndDate                           = "19700101" -- EndDate:If it is 19700101(infinite).
  • InpWindowsXSize   = 1030 -- WindowsXSize
  • InpWindowsYSize   = 450 -- WindowsYSize


おすすめのプロダクト
Episode Health Monitor Episode Health Monitor is a trading utility for MetaTrader 5 designed to analyze the real-time condition of active trading positions directly on the chart. The tool evaluates the current “trading episode” - a group of open positions - and provides a structured view of risk, stability, and distance to potential failure. Instead of relying only on profit/loss or price movement, it helps identify whether the current position is stable, weakening, or approaching a critical st
市場ボリュームプロファイル指標 + スマートオシレーター。通貨ペア、株式、先物、暗号資産など、ほぼすべての銘柄で動作し、リアルボリュームとティックボリュームの両方に対応しています。プロファイル作成範囲は、1週間や1ヶ月などの自動設定のほか、境界線(赤と青の2本の垂直線)を動かして手動で設定することも可能です。ヒストグラム形式で表示され、特定の価格レベルにおけるヒストグラムの幅は、その価格帯で行われた取引量(約定数)を表します。 Mode level line color パラメータを使用すると、価格が反発する可能性が高い重要なボリュームレベルを自動表示できます。また、 Maximum color パラメータは、指定した範囲全体で最も取引が集中した最大ボリュームレベルを個別に表示します。 スマートオシレーターは買われすぎ・売られすぎのゾーンを表示します。複数のインジケーターからの情報を分析し、処理されたデータに基づいて、買われすぎと売られすぎのゾーンを対応する色で塗りつぶします。 Volume every day では、 Range period パラメータでプロファイル作成の時間間隔を
Trading Utility for Forex Currency Pairs Only not for Gold  Functions Auto Lot Calculation based on Risk Auto stoploss  Auto TakeProfit Breakeven Auto Close Half % Close in percentage with respect to the PIPs Pending Orders BuyLimit Sell Limit with distances BuyStop Sell Stop    with distances Trading Informations Risk in percentage For Multiple trades Combine Takeprofit and Combine Stoplosses
RSI Currency Strength Meter is a powerful and elegant multi-currency indicator that measures the real-time relative strength of the 8 major currencies using RSI logic. By calculating the smoothed performance of each currency across its major pairs and applying the RSI formula, it delivers clean and responsive strength lines that make it easy to spot which currencies are truly strong or weak at any moment. This indicator is particularly useful for visualizing currency correlations and divergence
Advanced Volume Profile Analysis Tool for MetaTrader 5 The Kecia Volume Profile Order Finder provides traders with volume profile analysis capabilities. This MT5 indicator combines volume profile visualization with statistical calculations to help identify potential trading opportunities and suggests entry, stop loss, and take profit levels based on market structure. Market Profile Visualization Transform your chart with customizable volume profile visualizations: Multiple visualization options
Was: $249  Now: $99   Market Profile defines a number of day types that can help the trader to determine market behaviour. A key feature is the Value Area, representing the range of price action where 70% of trading took place. Understanding the Value Area can give traders valuable insight into market direction and establish the higher odds trade. It is an excellent addition to any system you may be using. Inspired by Jim Dalton’s book “Mind Over Markets”, this indicator is designed to suit the
Prop Firm Guardian PRO - Equity Protector Prop Firm Guardian PRO は、MetaTrader 5 用のユーティリティであり、日次損失、日次利益目標、および口座全体のドローダウンをリアルタイムで監視するために設計されています。 このツールは取引を開始したり、売買シグナルを生成したりしません。あらかじめ設定したリスク制限に達した際に、口座の有効証拠金を監視し、保護ルールを適用することを目的としています。 このツールは、より厳格な口座保護と規律あるリスク管理を求めるトレーダーに役立ちます。特に、プロップファーム評価のように厳しいルールがある環境で有用です。 目的 日次損失をリアルタイムで監視する 利益目標に到達したら当日の取引を停止する 主要な制限到達後のオーバートレードを抑える 有効証拠金ベースの自動ルールで口座を保護する 主な機能 日次損失をパーセントまたは固定金額で制限 日次利益目標の管理 口座全体の最大ドローダウン保護 リアルタイムの口座状況を表示するビジュアルダッシュボード 手動介入用の緊急全決済ボタン 保護ルール作動時
自動注文とリスク管理のためのユーティリティ。利益を最大化し、損失を抑えることができます。トレーダーのための練習トレーダーによって作成されました。このユーティリティは使いやすく、トレーダーが手動で、またはアドバイザーの助けを借りて開いた成行注文で機能します。マジックナンバーで取引をフィルタリングできます。このユーティリティは、同時に任意の数の注文を処理できます。 次の機能があります。 1.ストップロスとテイクプロフィットレベルの設定; 2. トレーリング ストップ レベルで取引を終了します。 3. 損益分岐点の設定。 ユーティリティは次のことができます。 1. オーダーごとに個別に作業します (レベルはオーダーごとに個別に設定されます)。 2. 一方向注文のバスケットを操作します (レベルはすべての注文に共通に設定され、BUY と SELL は個別に設定されます)。 3. 多方向注文のバスケットを操作します (レベルはすべての注文に共通に設定され、BUY と SELL が一緒に設定されます)。 オプション: STOPLOSS - =-1 が使用されていな
インジケーター技術仕様 – Delta Profile for MetaTrader 5 Delta Profile は MetaTrader 5 用に開発されたインジケーターで、指定されたローソク足範囲内の出来高フローを詳細に分析するためのものです。異なる価格レベルにおける正の出来高(上昇に関連)と負の出来高(下降に関連)の不均衡を構造化し、可視化します。その結果、ユーザーは最も多くの取引が集中する価格帯や実際の市場不均衡が形成される領域を明確に把握できます。 以下に、本インジケーターの主要な技術特性と設定パラメータを示します。 基本コンセプト インジケーターは 価格レベル を識別し、それらを正の出来高、負の出来高、および純 Delta(正負の出来高差)に分類します。 各価格レベルは 水平バー としてチャートに表示され、市場の活動ゾーンや不均衡領域を視覚的に確認できます。 ユーザーは 分析対象ローソク足数 、 価格の丸め精度 、 最大表示レベル数 、および 表示スタイル を自由に設定できます。 主要機能 価格レベルのマッピング :設定された精度に基づき価格を丸め、対応するローソク足の
Overview Mirror Signals Service EA (Text only)   is a powerful monitoring Expert Advisor that automatically sends   real-time Telegram notifications   for all important trade events on your MetaTrader 5 account. It is engineered specifically for   signal providers ,   trade-copier operators ,   auditors ,   educators , and   professional trading services   that require immediate, detailed, and reliable reporting. Everything from   entries, exits, SL/TP changes, comment changes, trailing sto
ファンド口座。一度のロット計算ミス。ドローダウン上限を突破。口座閉鎖。 戦略が悪かったのではない。執行の瞬間にリスクが管理されていなかったからだ。 Trade Command Center はビジュアル注文執行・リスク管理パネルです。 SL距離からロットを計算。ポジションを自動管理。ドローダウン上限をリアルタイム監視。 5タブ。1チャートパネル。DLLなし。外部接続なし。 正確な執行とプロップファーム準拠を必要とする裁量トレーダー向けに設計。 FTMOおよびMFFルールのプリセット内蔵。日次損失、週次損失、エクイティ・ドローダウン、フローティング損失に対応。 コア機能 ビジュアル・トレード・プランニング: チャート上でEntry、SL、TPボックスをドラッグ。ロット、ピップス距離、ドル金額、R:Rをリアルタイム表示。ワンクリック執行。 リスク計算: リスクモードを選択 — 残高比率、固定金額、固定ロット。パネルがポジションサイズを自動計算。 マルチレベル・テイクプロフィット: 最大5段階の部分決済。各レベルに独自のトリガー距離と決済割合。 オーバーライド付きブレイクイーブン: グローバ
TradePilotmt5
Hossein Khalil Alishir
TradePilot Expert Advisor (EA) for MetaTrader 5 TradePilot is a professional and user-friendly Expert Advisor (EA) for MetaTrader 5 (MT5) . It simplifies automated trading , risk management , and trade execution with a smart trading panel . Perfect for beginners and experienced traders looking for a reliable trade manager EA with automated lot size calculation and smart position management. Key Advantages User-Friendly Trading Panel: Customizable panel with buttons and hotkeys for fast ex
Trade Assistant 38 in 1
Makarii Gubaydullin
4.91 (23)
多機能ツール:ロット計算、グリッド注文、R/R比率、トレードマネージャー、サプライ&デマンドゾーン、プライスアクションなど デモ版   |   ユーザーマニュアル トレードアシスタント   はストラテジーテスターでは動作しません :   こちらからデモ版をダウンロード  して ユーティリティ をテストできます。 ご質問、改善のご提案、バグ発見の場合は ご連絡ください MT4版が必要な場合は こちら から入手できます トレード   プロセス を簡素化、高速化、自動化。   ダッシュボード で標準端末の機能を拡張。 トレードパネルは  あらゆる取引商品で動作:外国為替、株式、インデックス、暗号通貨など。 1. 新規トレードの実行 :ロット / リスク / R/R計算 :手動トレードのためのリスク管理 ロット計算機(リスクサイズに基づく取引量計算) リスク計算機(ロットサイズに基づくリスク額) リスクリワード   比率 グリッド注文:  + 動的間隔オプション、スプリットロットオプション 注文のアクティベーショントリガー、+ バイストップリミット / セルストップリミット 仮想SL、仮想
Noize Absorption Index - is the manual trading system that measures the difference of pressure between bears forces and bulls forces. Green line - is a noize free index that showing curent situation. Zero value of index shows totally choppy/flat market.Values above zero level shows how powerfull bullish wave is and values below zero measures bearish forces.Up arrow appears on bearish market when it's ready to reverse, dn arrow appears on weak bullish market, as a result of reverse expectation.
This indicator presents an alternative approach to identify Market Structure. The logic used is derived from learning material created by   DaveTeaches (on X) Upgrade v1.10: + add option to put protected high/low value to buffer (figure 11, 12) + add  Retracements  value to buffer when Show Retracements When quantifying Market Structure, it is common to use fractal highs and lows to identify "significant" swing pivots. When price closes through these pivots, we may identify a Market Structure S
"Impulses and Corrections 5" is created to help traders navigate the market situation. The indicator shows multi-time frame upward and downward "Impulses" of price movements. These impulses are the basis for determining the "Base" , which is composed of zones of corrections of price movements, as well as "Potential" zones for possible scenarios of price movement. Up and down impulses are determined based on a modified formula of Bill Williams' "Fractals" indicator. The last impulse is always "U
プレミアムレベルは、正しい予測の精度が80%を超える独自の指標です。 この指標は、最高のトレーディングスペシャリストによって2か月以上テストされています。 あなたが他のどこにも見つけられない作者の指標! スクリーンショットから、このツールの正確さを自分で確認できます。 1は、1キャンドルの有効期限を持つバイナリーオプションの取引に最適です。 2はすべての通貨ペア、株式、商品、暗号通貨で機能します 手順: 赤い矢印が表示されたらすぐにダウントレードを開き、青い矢印が表示されたら閉じます。青い矢印の後に開くこともできます。 試してテストしてください!推奨設定はデフォルトです! 日足チャートで最高の精度を示します! インディケータは、2600 Pipsの収益性に対して、約10Pipsという非常に小さなマージンを使用します。
Smart TP SL Manager MT5 Smart TP SL Manager MT5 is a trade management utility for MetaTrader 5 designed to monitor and manage position protection directly from the chart through a compact panel. The tool focuses on a common problem in manual trading: loss of control over stop loss, take profit, and position risk when multiple trades are active. Instead of relying on manual checking or switching between terminal windows, the panel provides a structured view of protection status and risk conditio
Time and Sales Tick
Pablo Filipe Soares De Almeida
Time & Sales Tick Indicator は、MetaTrader 5チャート上でリアルタイムのティック情報を表示するインジケーターです。 価格、ティック出来高、時刻を視覚的に確認でき、市場の動きを細かく分析することが可能です。 機能 価格、出来高、時間を含むティックデータをチャート上の専用パネルにリアルタイム表示します。 ティックをユーザーが設定した間隔でグループ化し、上昇ティックは緑色、下降ティックは赤色で色分け表示します。 パネルはチャートの4隅の任意の位置に配置でき、サイズや透明度の調整も可能です。 MetaTrader 5のすべてのシンボルおよびタイムフレームで使用可能で、軽量かつ安定した動作を実現しています。 このインジケーターは、スキャルピングや短期分析に特に適しています。
Overview Mirror Signals EA is a powerful monitoring Expert Advisor that automatically sends real-time Telegram notifications for all important trade events on your MetaTrader 5 account. It is engineered specifically for signal providers , trade-copier operators , auditors , educators , and professional trading services that require immediate, detailed, and reliable reporting. Everything from entries, exits, SL/TP changes, comment changes, trailing stop activations, pending order modifications
インディケータは現在のクオートを作成し、これを過去のものと比較して、これに基づいて価格変動予測を行います。インジケータには、目的の日付にすばやく移動するためのテキスト フィールドがあります。 オプション: シンボル - インジケーターが表示するシンボルの選択; SymbolPeriod - 指標がデータを取る期間の選択; IndicatorColor - インジケータの色; HorisontalShift - 指定されたバー数だけインディケータによって描画されたクオートのシフト; Inverse - true は引用符を逆にします。false - 元のビュー。 ChartVerticalShiftStep - チャートを垂直方向にシフトします (キーボードの上下矢印)。 次は日付を入力できるテキストフィールドの設定で、「Enter」を押すとすぐにジャンプできます。
Price Magnet — Price Density and Attraction Levels Indicator Price Magnet is a professional analytical tool designed to identify key support and resistance levels based on statistical Price Density. The indicator analyzes a specified historical period and detects price levels where the market spent the most time. These zones act as “magnets,” attracting price action or forming a structural base for potential reversals. Unlike traditional Volume Profile tools, Price Magnet focuses on price-time d
Order Book, known also as Market Book, market depth, Level 2, - is a dynamically updated table with current volumes of orders to buy and to sell specific financial instument at price levels near Bid and Ask. MetaTrader 5 provides the means for receiving market book from your broker, but in real time only, without access to its history. The indicator OrderBook Cumulative Indicator accumulates market book data online and visualizes them on the chart. In addition, the indicator can show the market
Candlestick Pattern Scanner is a multi-timeframe and multi-symbol dashboard and alert system that checks all timeframes and currency pairs for different candlestick patterns that are formed in them. Scanner is integrated   with support and resistance zones so you can check the candlestick patterns in most important areas of the chart to find breakout and reversal patterns in the price chart. Download demo version   (works on M4,M6,M12,H3,H8 timeframes and 20 symbols of Market Watch window) Read
RRtoolbox - Professional Tools: Risk:Reward Trading Tool (SL/TP Horizontals + Pending orders + Diagonals), Alerts set on trend lines (for alerts on diagonal levels), SelfManagement (BE, partials...), close/cancelling by time, Statistics, Info and trading on chart. One-Click Trading with Visual Risk:Reward Management RRtoolbox is a comprehensive trading panel that combines one-click order execution,  statistics and  powerful visual Risk:Reward tools, alerts set with trendlines, on chart butt
Step into the world of Forex trading with confidence, clarity, and precision using Gold Indicator a next-generation tool engineered to take your trading performance to the next level. Whether you’re a seasoned professional or just beginning your journey in the currency markets, Gold Indicator equips you with powerful insights and help you trade smarter, not harder. Built on the proven synergy of three advanced indicators, Gold Indicator focuses exclusively on medium and long-term trends elimina
概要 Candle Timer Countdown Pro は、現在のローソク足が終了するまでの残り時間を、滑らかで正確なカウントダウンとして表示します。さらに、円形のプログレスアーク(進行表示)を組み合わせることで、残り時間を瞬時に視覚的に把握できます。 ティック間で停止したり、時間がずれてしまう他のタイマーとは異なり、本インジケーターはサーバー時間の補間(Server Time Interpolation)を使用し、M1 から MN まであらゆる時間足で途切れのないスムーズなカウントダウンを実現します。 1分足でのスキャルピングでも、H4でのスイングトレードでも、現在のローソク足が正確にいつ確定するのかを把握することで、エントリータイミングの最適化、ローソク足パターンの確認、そして早すぎる判断の回避に役立ちます。 このタイマーが他と違う理由 多くの MT5 用キャンドルタイマーは TimeCurrent() のみに依存しており、新しいティックが到着したときにしか更新されません。低ボラティリティ時や上位時間足では、ティックの間隔が数秒空くことがあり、その間タイマーが停止し、その後突
Easy Trading Panel: Core Function Summary 1. Visual Trading This is the core selling point of the tool. It abandons the traditional way of placing orders by inputting prices and adopts an intuitive chart line drag-and-drop mode instead: • Drag Entry Line: Directly drag the line on the chart to set the pending order position. • One-click SL/TP Toggle: Quickly enable/disable stop loss and take profit lines via panel buttons. • Synchronous Calculation: When the lines are dragged, the panel will cal
Note: For backtesting, you need to set Enable WPR FILter to true Minin Stop Distance in points (the third to last setting) to 0 Everything else remains the same. The backtesting data is identical to the live data! It's very stable and primarily captures trends, automatically setting stop-loss and take-profit levels after opening positions (take-profit can be configured). For detailed instructions, please contact me after purchase. Product Highlights: Professional Gold Trading Solution Theore
This is visualization tool based on the Depth of Market. It works with the symbols that have the Depth of Market available. It's a visual indicator that shows the volume of each Bid/Ask price and ratio of total volume of Bids/Asks. Note: check if your broker supports DOM before purchasing. 。。。。。。。。。。。。。。。。。。。。。。。。。。。。。。。。。。。。。。。。。。。。。。。。。。。 。。。。。。。。。。。。。。。。。。。。。。。。。。。。。。。。。。。。。。。。。。。。。。。。。。。
このプロダクトを購入した人は以下も購入しています
Trade Assistant MT5
Evgeniy Kravchenko
4.42 (207)
取引 ごとのリスクの 計算、新規注文 の 簡単 な 設置、部分的 な 決済機能 を 持 つ 注文管理、 7 種類 のトレーリングストップなど 、便利 な 機能 を 備 えています 。 追加の資料と説明書 インストール手順   -   アプリケーションの手順   -   デモアカウント用アプリケーションの試用版 ライン機能 チャート上にオープニングライン、ストップロス、テイクプロフィットを表示します。この機能により、新規注文を簡単に設定することができ、注文を出す前にその特徴を確認することができます。   リスク計算 リスク計算機能は、設定されたリスクとストップロス注文のサイズを考慮して、新規注文のボリュームを計算します。ストップロスの大きさを自由に設定できると同時に、設定したリスクを守ることができます。 Lot calc ボタン - リスク 計算 を 有効 / 無効 にします 。 Risk フィールドでは 、必要 なリスクの 値 を 0 から 100 までのパーセンテージまたは 預金通貨 で 設定 します 。 設定」 タブで 、 リスク 計算 の 種類 を 選択 します :「 $ 通
Trade Manager EAへようこそ。これは、取引をより直感的、正確、そして効率的にするために設計された究極の リスク管理ツール です。これは単なるオーダー実行ツールではなく、包括的な取引計画、ポジション管理、リスク管理のためのソリューションです。初心者から上級者、迅速な実行を必要とするスキャルパーまで、Trade Manager EAはあらゆるニーズに対応し、為替、指数、商品、暗号通貨などさまざまな市場で柔軟に対応します。 Trade Manager EAを使用すると、複雑な計算が過去のものになります。市場を分析し、エントリーポイント、ストップロス、テイクプロフィットのレベルをチャート上のラインでマークし、リスクを設定するだけで、Trade Managerが最適なポジションサイズを即座に計算し、SLとTPをピップ、ポイント、口座通貨でリアルタイムに表示します。すべての取引が簡単かつ効果的に管理されます。 主な機能: ポジションサイズ計算機 :定義されたリスクに基づいて取引サイズを瞬時に決定します。 簡単な取引計画 :エントリー、ストップロス、テイクプロフィットを設定するためのド
Local Trade Copier EA MT5
Juvenille Emperor Limited
4.96 (133)
Local Trade Copier EA MT5 による、驚くほど高速な取引コピーを体験してください。1分で簡単にセットアップできるこの取引コピー機は、同じWindowsコンピュータまたはWindows VPS上の複数のMetaTrader端末間で取引をコピーすることができ、0.5秒未満の高速コピースピードを実現します。 初心者であろうとプロのトレーダーであろうと、 Local Trade Copier EA MT5 には、あなたの特定のニーズに合わせてカスタマイズするための幅広いオプションが用意されています。これは、利益の可能性を高めたい人にとって究極のソリューションです。 今すぐ試してみて、これが市場で最も速くて簡単なトレードコピー機である理由を理解してください。 ヒント: デモアカウントで Local Trade Copier EA MT5 デモバージョンをダウンロードして試すことができます: ここ ダウンロードした無料のデモ ファイルを MT5 >> ファイル >> データ フォルダを開く >> MQL5 >> Experts フォルダに貼り付けて、ターミナルを再起動しま
TradePanel MT5
Alfiya Fazylova
4.87 (149)
Trade Panelは多機能なトレーディングアシスタントです。アプリには手動取引用の50以上のトレーディング機能が搭載されており、ほとんどの取引作業を自動化することができます。 購入前に、デモアカウントでアプリのデモ版をテストすることができます。デモアカウント用のアプリの試用版をダウンロードするには、次のリンクをご利用ください: https://www.mql5.com/en/blogs/post/750865 。 完全な手順 こちら 。 取引。 ワンクリックで取引操作を行うことができます: リスクを自動計算して指値注文やポジションを開く。 複数の注文やポジションをワンクリックで開く。 注文のグリッドを開く。 保留中の注文やポジションをグループごとに閉じる。 ポジションの方向を反転(Buyを閉じてSellを開く、またはSellを閉じてBuyを開く)。 ポジションをブロックする(不足している量のポジションを開くことでBuyとSellのポジション量を等しくする)。 すべてのポジションを部分的にワンクリックで閉じる。 すべてのポジションの利食い(Take Profit)および損切り(Sto
ベータリリース Telegram to MT5 Signal Trader はまもなく正式なアルファ版をリリースします。いくつかの機能はまだ開発中で、小さな不具合に遭遇する可能性があります。問題が発生した場合はぜひご報告ください。皆さまのフィードバックがソフトウェア改善に役立ちます。 Telegram to MT5 Signal Trader は、 Telegram のチャンネルやグループからの取引シグナルを自動的に MetaTrader 5 にコピーする強力なツールです。 パブリックおよびプライベートの両方のチャネルに対応し、複数のシグナル提供元を複数のMT5口座に接続可能です。ソフトウェアは高速で安定し、すべての取引を細かく制御できます。 インターフェースは直感的で、ダッシュボードとチャートは見やすく設計されており、リアルタイムで動作状況をモニターできます。 必要環境 MQL の制限により、EA は Telegram と通信するためのデスクトップアプリが必要です。 インストーラーは公式の インストールガイド にあります。 主な機能 マルチプロバイダー: 複数の Telegram
Tired of complex order placement and manual calculations? Trade Dashboard is your solution. With its user-friendly interface, placing orders becomes effortless, by a single click, you can open trades, set stop loss and take profit levels, manage trade lot size, and calculate risk to reward ratios, allowing you to only focus on your strategy. Say goodbye to manual calculations and streamline your trading experience with Trade Dashboard. Download  Demo Version  right now. You can find  Details of
The core idea: using the user interface, you configure the parameters the chart must meet before entering a position (or positions), choose which entry models to use, and set the rules for when trading and planning should end. Lazy Trader  handles the rest: it  takes over all the routine chart watching and execution! full description  :: 3 key videos [1] ->  [2]   ->  [3] What can it do? - Understands Larry Williams market structure - Understands swing market structure by Michael Huddleston
MT5 to Telegram Signal Provider は、Telegramのチャット、チャンネル、またはグループに 指定された シグナルを送信することができる、完全にカスタマイズ可能な簡単なユーティリティです。これにより、あなたのアカウントは シグナルプロバイダー になります。 競合する製品とは異なり、DLLのインポートは使用していません。 [ デモ ] [ マニュアル ] [ MT4版 ] [ Discord版 ] [ Telegramチャンネル ]  New: [ Telegram To MT5 ] セットアップ ステップバイステップの ユーザーガイド が利用可能です。 Telegram APIの知識は必要ありません。必要な全ては開発者から提供されます。 主な特長 購読者に送信する注文の詳細をカスタマイズする機能 例えば、Bronze、Silver、Goldといった階層型のサブスクリプションモデルを作成できます。Goldサブスクリプションでは、すべてのシグナルが提供されます。 id、シンボル、またはコメントによって注文をフィルターできます 注文が実行されたチャート
Exp COPYLOT CLIENT for MT5
Vladislav Andruschenko
3.82 (34)
MT5のトレードコピー機は、МetaТrader5プラットフォームのトレードコピー機です 。 それは間の 外国為替取引をコピーします   任意のは 、MT5 - MT5、MT4 - MT5   COPYLOT MT5版の アカウント (またはを MT4 - MT4   MT5 - MT4   COPYLOT MT4版用) 信頼できるコピー機! MT4のバージョン 完全な説明   +DEMO +PDF 購入する方法 インストールする方法     ログファイルの取得方法     テストと最適化の方法     Expforex のすべての製品 МТ4ターミナルでトレードをコピーすることもできます(   МТ4   -   МТ4、МТ5   -   МТ4   ):   MT4のCOPYLOT CLIENT このバージョンには、端末間 МТ5   -   МТ5、МТ4   -   МТ5が含まれ ます。 ディールコピー機は、2/3/10端末間でディール/ポジションをコピーするために作成されます。 デモ口座と投資口座からのコピーがサポートされています。 プログラムは、複数の端末バインデ
VERIFIED TRADING RESULTS - Farmed Hedge Yield Axi Copy:  https://www.mql5.com/en/signals/2356376 - Farmed Hedge Yield Exn Copy:   https://www.mql5.com/en/signals/2356404 - Farmed Hedge Yield V Copy:  https://www.mql5.com/en/signals/2357156 Contact me via private message to receive the User Manual and Setup. * Thai Lauguage Support Available Farmed Hedge Yield Farming - Professional Pair Trading Dashboard (Manual - Hybrid - Semi/Automated EA) VERSION 3 - WILD HARVEST UPDATE Trading Approac
Copy Cat More Trade Copier MT5 (コピーキャット MT5) は、今日の取引課題に対応して設計されたローカルトレードコピーシステムと完全なリスク管理・実行フレームワークです。プロップファームのチャレンジから個人ポートフォリオ管理まで、堅牢な実行、資本保護、柔軟な設定、高度な取引処理の組み合わせで、あらゆる状況に適応します。 コピーシステムはマスター(送信側)とスレーブ(受信側)の両方のモードで動作し、成行注文と指値注文、取引修正、部分決済、両建て決済操作のリアルタイム同期を行います。デモ口座とライブ口座、取引ログインまたは投資家ログインの両方に対応し、EA、ターミナル、またはVPSが再起動してもパーシスタント取引メモリシステムを通じて復旧を保証します。複数のマスターとスレーブをユニークIDで同時に管理でき、ブローカー間の違いはプレフィックス/サフィックス調整またはカスタムシンボルマッピングを通じて自動的に処理されます。 マニュアル/設定  | Copy Cat More MT4 | チャンネル  特別機能: 設定が簡単 — わずか30秒で完了(ビデオをご覧
Timeless Charts
Samuel Manoel De Souza
5 (3)
Timeless Charts is an advanced charting solution designed for professional traders seeking for custom charts / custom timeframes , including seconds charts / seconds timeframe, renko charts / renko bars, cluster charts / footprint charts and advanced tools present in most of the popular platforms. Unlike traditional offline charts or simplistic custom indicators, this solution constructs fully custom bars with true timestamp accuracy , down to miliseconds, allowing for a powerful and precise tr
HINN MAGIC ENTRY – the ultimate tool for entry and position management! Place orders by selecting a level directly on the chart! full description   ::  demo-version  :: 60-sec-video-description Key features: - Market, limit, and pending orders - Automatic lot size calculation - Automatic spread and commission accounting - Unlimited partitial take-profits  - Breakeven and trailing stop-loss and take-profit  functions - Invalidation leves - Intuitive, adaptive, and customizable interface - Works
ワンクリックで取引できるトレーディングパネル。ポジションと注文の操作!チャートまたはキーボードから取引。 当社の取引パネルを使用すると、チャートから直接シングルクリックで取引を実行でき、標準の MetaTrader コントロールよりも 30 倍高速に取引操作を実行できます。 パラメータと関数の自動計算により、トレーダーにとって取引がより速く、より便利になります。 グラフィックのヒント、情報ラベル、取引取引に関する完全な情報はチャート MetaTrader にあります。 MT4のバージョン 完全な説明   +DEMO +PDF 購入する方法 インストールする方法     ログファイルの取得方法     テストと最適化の方法     Expforex のすべての製品 手動取引用の取引パネル。チャート(チャートウィンドウ)またはキーボードから取引できます。  開閉、リバース、ロックポジションと注文を処理する МetaТrader5 のメインオーダーのトレーディングコントロールパネル:売買、売却、売却、売却、売却、閉じる、削除、修正、トレーリングストップ、ストップロス、takeproft
この製品は、ニュースタイム中にすべてのエキスパートアドバイザーと手動チャートをフィルタリングするため、急激な価格変動によるマニュアルトレードのセットアップの破壊や他のエキスパートアドバイザーによって入力された取引について心配する必要はありません。この製品には、ニュースのリリース前にオープンポジションとペンディングオーダーを処理できる完全な注文管理システムも付属しています。 The News Filter  を購入すると、将来のエキスパートアドバイザーのためにビルトインのニュースフィルターに頼る必要はなく、今後はすべてのエキスパートアドバイザーをここからフィルタリングできます。 ニュース選択 ニュースソースは、Forex Factoryの経済カレンダーから取得されます。 USD、EUR、GBP、JPY、AUD、CAD、CHF、NZD、CNYなど、任意の通貨数に基づいて選択できます。 Non-Farm(NFP)、FOMC、CPIなどのキーワード識別に基づいて選択することもできます。 影響レベルによってフィルタリングするニュースを選択することができ、低、中、高の影響範囲から選択できます。
Trade Manager は、リスクを自動的に計算しながら、取引を迅速に開始および終了するのに役立ちます。 過剰取引、復讐取引、感情的な取引を防止する機能が含まれています。 取引は自動的に管理され、アカウントのパフォーマンス指標はグラフで視覚化できます。 これらの機能により、このパネルはすべてのマニュアル トレーダーにとって理想的なものとなり、MetaTrader 5 プラットフォームの強化に役立ちます。多言語サポート。 MT4バージョン  |  ユーザーガイド + デモ Trade Manager はストラテジー テスターでは機能しません。 デモについてはユーザーガイドをご覧ください。 危機管理 % または $ に基づくリスクの自動調整 固定ロットサイズを使用するか、ボリュームとピップに基づいた自動ロットサイズ計算を使用するオプション RR、Pips、または価格を使用した損益分岐点ストップロス設定トレーリングストップロス設定 目標に達したときにすべての取引を自動的に終了するための 1 日あたりの最大損失 (%)。 過度のドローダウンからアカウントを保護し、オーバートレードを防ぎます
Footprint Chart Pro — Professional OrderFlow EA for MetaTrader 5 Version 6.34 | Professional tool for real traders | Institutional-Grade Visualization DEMO USERS - PLEASE SELECT EVERY TICK / REAL TICK WHEN TESTING AND YOU HAVE DOWNLOADED HISTORICAL DATA. IF YOU SEE A WAITING SCREEN AND IT IS NOT DOWNLOADING, IT MEANS YOU HAVE LOW HISTORICAL DATA. TRY 1 MIN AND 5 MIN FIRST ON 1 DAY DATA. ONE DAY DATA SHOULD BE THE NEWEST AND MOST CURRENT DATE. PLEASE WAIT UNTIL THE MARKET HAS ROLLED OVER PERIOD.
多くのトレーダーは、気づかないうちに同じ間違いをしています。1つの過去バックテストで良い結果が出ただけで、そのEAを信頼してしまうことです。 しかし、1つの過去検証だけではロバスト性は証明できません。分かるのは、そのロジックが過去の特定の相場の流れでは機能したということだけです。そして、実際の市場が見せたその流れは一度きりでした。 そこで AntiOverfit PRO の出番です。 AntiOverfit PRO は、MetaTrader 5 上のあらゆるEAについて、本当の意味での頑健さを評価するために作られたツールです。美しい損益曲線で見栄えを良くするためのものではありません。もっと重要な問い、つまり 市場が過去とまったく同じようには動かなくなったときでも、そのシステムは本当に通用するのか を見極めるためのものです。 言い換えれば、AntiOverfit PRO は「そのEAが過去に儲かったかどうか」だけを見るためのツールではありません。その結果が本当に堅いロジックに支えられているのか、それとも過去に実際に起きたあの値動きに強く依存しているだけなのかを判断しやすくします。
Easy Trade – シンプルかつ強力なスマートトレード管理 Easy Trade は、リスクを適切にコントロールし、スムーズな取引執行を実現したい MetaTrader ユーザーのためのオールインワン・トレードマネジメントソリューションです。 トレーダーの声をもとにゼロから設計された Easy Trade は、複数シンボルの取引を簡単に実行・監視・管理できるようにし、作業フローを複雑にしません。 手動スキャルピングでも、少数のセットアップを管理するポートフォリオでも、Easy Trade は賢明な判断と安定した成果に集中できるようサポートします。 ⸻ なぜ Easy Trade を使うべきか? 精密なリスク管理:固定ロットサイズまたはパーセンテージによるリスク設定が可能。リアルタイムでリスクとリワード情報を確認。 バスケット型トレーリング:複数の取引の利益を監視。目標到達で部分利益を自動確保。 取引の自動記録:各取引をスクリーンショットで記録。ジャーナル記録やパフォーマンス分析に最適。 時限クローズ機能:指定日時での自動クローズ設定が可能。週末前や取引終了時に便利。 カス
The product will copy all telegram signal to MT5 ( which you are member) , also it can work as remote copier.  Easy to set up, copy order instant, can work with almost signal formats, image signal,  s upport to translate other language to English Work with all type of channel or group, even channel have "Restrict Saving Content", work with  multi channel, multi MT5 Work as remote copier: with signal have ticket number, it will copy exactly via ticket number. Support to backtest signal. How to s
ウォッチリスト全体の極端なバーをリアルタイムでスキャン。 Power Bar Scannerは全てのシンボルを同時に監視し、極端な価格バーが出現した瞬間にアラートを送信します。チャートを切り替える必要はありません。全ての機会を一つのパネルで確認できます。 あらゆる時間足に対応。Forex、Indices、ゴールド、Crypto - 全てを一画面で表示。 仕組み スキャナーはMarket Watch内の各シンボルについて、ローソク足の実体が N x ATR を超えるバーをチェックします。検出すると、そのシンボルが方向(BUY/SELL)、ATR比率、何本前にシグナルが発生したかと共に表示されます。どのシンボルが今アクティブかを一目で確認できます。 ワンクリックナビゲーション スキャナー内の任意のシンボル名をクリックすると、チャートが即座にそのシンボルに切り替わります。シグナルを見つけて、クリックして、分析する。手動でのシンボル切り替えやチャートタブの検索は不要です。 ソート可能なカラム 任意のカラムヘッダーをクリックして、シンボル、価格、シグナル、比率、経過時間でソートできます。最も
Trade Manager DashPlus
Henry Lyubomir Wallace
5 (13)
DashPlus は、MetaTrader 5プラットフォーム上での取引効率と効果を向上させるために設計された高度なトレード管理ツールです。リスク計算、注文管理、高度なグリッドシステム、チャートベースのツール、パフォーマンス分析など、包括的な機能を提供します。 主な機能 1. リカバリーグリッド 逆境の市場環境下で取引を管理するための平均化および柔軟なグリッドシステムを実装します。 取引回復のための戦略的なエントリーおよびエグジットポイントを可能にします。 2. スタックグリッド 強い市場の動きの中でポジションを追加することで、有利な取引での潜在的なリターンを最大化するように設計されています。 トレンド市場で利益を得られるよう、勝ち取引を拡大します。 3. 損益(P&L)ライン チャート上に直接、潜在的な利益と損失のシナリオを視覚的に表示します。 設定を調整し、P&Lラインをドラッグして、実行前にさまざまな取引結果を評価します。 4. バスケットモード 同じシンボルでの複数ポジションの管理を簡素化し、それらを単一の集約ポジションにまとめます。 平均価格に基づいて、ストップロスやテイクプ
The Expert Advisor is a comprehensive risk manager helping users to control their trading activities. With this tool being a safeguard you can easily configure various risk parameters. When any limit is exceeded, the risk manager can force close opened positions, close other EAs, and even close the terminal to prevent emotional trading that doesn't correspond to your trading strategy. Risk Manager Settings Account Protection Check min equity limit to close all (account currency) - check the min
Crypto Charting for MT5 – MetaTrader 5 向け暗号資産チャートツール 概要 Crypto Charting for MT5 は、WebSocket を介して暗号資産の OHLC チャートデータをリアルタイムで提供します。複数の取引所に対応し、MT5 上で履歴データの自動更新が可能です。 機能 WebSocket によるリアルタイムデータ 自動履歴データ更新 接続障害時のスケジュール更新 全ての MT5 時間足に対応 OHLCV データ構成 ストラテジーテスターに対応 自動再接続機能付き 対応取引所 Binance、Bybit、OKX、KuCoin、MEXC、Gate.io、Bitget、XT.com 補足情報 ティックデータおよび板情報には、別製品の Crypto Ticks をご覧ください。 注意事項 DLL を使用していません。VPS に適しています。 Strategy Tester では WebRequest 機能は動作しません。 デモをご希望の場合は、MQL5 のプライベートメッセージでご連絡ください。 Full Documentati
Equity Protect Pro: 安心取引のための総合的な口座保護エキスパート 口座保護、資産保護、ポートフォリオ保護、マルチ戦略保護、利益保護、利益確定、取引セキュリティ、リスク管理プログラム、自動リスク管理、自動決済、条件付き決済、スケジュール決済、動的決済、トレーリングストップロス、ワンクリッククローズ、ワンクリック決済、ワンクリック復元などの機能をお探しなら、Equity Protect Pro が最適なプログラムです。 設定は簡単で、事前設定された条件に達すると、すべてのチャートを閉じることができ、シグナルサブスクリプションのキャンセルもサポートします(これは、すべての取引プログラムも停止することを意味します)。この時点で、新しい注文は生成されなくなり、最終的にすべての注文が閉じられ、予期せぬ損失を効果的に防止し、安心して取引できるようになります。 Equity Protect Pro (Technical Manual) Equity Protect Pro Demo Version for yo u to test   Equity Protect Pro MT4
YuClusters
Yury Kulikov
4.93 (43)
Attention: You can view the program operation in the free version  YuClusters DEMO .  YuClusters is a professional market analysis system. The trader has unique opportunities to analyze the flow of orders, trade volumes, price movements using various charts, profiles, indicators, and graphical objects. YuClusters operates on data based on Time&Sales or ticks information, depending on what is available in the quotes of a financial instrument. YuClusters allows you to build graphs by combining da
TelegramからMT5へ: 究極のシグナルコピーソリューション Telegram to MT5 を使えば、取引がシンプルになります。DLL を必要とせず、Telegram のチャンネルやチャットから MetaTrader 5 プラットフォームに取引シグナルを直接コピーできる最新ツールです。この強力なソリューションは、正確なシグナル実行、豊富なカスタマイズオプション、時間の節約、そして効率性の向上を実現します。 [ Instructions and DEMO ] 主な特徴 直接的なTelegram API統合 電話番号とセキュアコードで認証します。 ユーザーフレンドリーな EXE ブリッジを通じてチャット ID を簡単に管理できます。 複数のチャネル/チャットを追加、削除、更新して、同時に信号をコピーします。 高度なフィルターによる信号解析 例外的な単語 (例: 「レポート」、「結果」) を含む不要な信号をスキップします。 柔軟な SL および TP 形式 (価格、ピップ、ポイント) をサポートします。 価格ではなくポイントを指定するシグナルのエントリ ポイントを自動的に計算します。
MT5用 Stats Dashboard & Journal ULTRA 完全なトレーディングコマンドセンター:分析、自動化、ニュースインテリジェンス。 Stats Dashboard ULTRAは、Pro分析ツールの究極の進化形です。MetaTrader 5をプロフェッショナルなトレーディングステーションに変え、機関投資家レベルのパフォーマンス分析と、自動化されたニュース保護、高度な心理的指標を組み合わせます。完全なコントロールを求める裁量トレーダーやEAポートフォリオマネージャー向けに設計されています。 ULTRAバージョンの新機能 ニュースインテリジェンスエンジン: ニュースを見るだけでなく、分析します。過去のニュースイベントが保有中のトレードにどう影響したかをシミュレーションし、ポジションを保持すべきか決済すべきかを教えてくれます。 EAボットガード(自動保護): 重要度の高いニュース(High-Impact News)の際、他のExpert Advisor(EA)を自動的に一時停止し、市場が落ち着いたら再稼働させます。 真の株式ドローダウン(True Equity Drawd
Seconds Chart - MetaTrader 5で秒足チャートを作成するユニークなツールです。 Seconds Chart を使用すると、秒単位のタイムフレームでチャートを構築でき、標準的な分足や時間足チャートでは得られない柔軟性と分析精度を実現します。例えば、 S15 は15秒足を表します。カスタムシンボルをサポートしているインジケーターやEAをすべて使用できます。標準的なチャートと同様に便利に操作できます。 標準的なツールとは異なり、 Seconds Chart は超短期のタイムフレームでも高い精度と遅延なく作業できるように設計されています。 Seconds Chartの利点 1秒から900秒 までのタイムフレームをサポート。 組み込みのティックデータベースにより、ヒストリカルデータを 瞬時にロード 。 リアルタイムでデータが更新され、 遅延やラグなし 。 複数の秒足チャートを同時に作成可能。 Seconds Chartが最適な用途 スキャルピング や高頻度取引。 正確なエントリーとエグジット。 短期タイムフレームでの取引戦略のテスト。 タイムフレームの設定 デフォルトの設
作者のその他のプロダクト
DYJ Cashgamingeaは、DYJ技術指標に取り組みます。市場が強いとき、このEA Findは安全な市場の機会と取引です。取引の安全な時間による一貫した収益。EAはトランザクション・ボリュームを最小にして、利益閉鎖アルゴリズム戦略を最大にするために1オーダ・モードを使用します。 EAはゲーム戦略を使います: 順序が正しい場合は、ターゲットの利益またはtpを閉じて使用します。 注文の方向が間違っているときは、利益と市場を残してゲーム戦略を使用してください。 Recommendations Syntheric and Forex. Download TP and SL common settings of all symbols of synthetic account Developed for M1, Boom 1000 Index.  Backtest: Deposit $100 DD=18%  15 Months Profits= $50436. Developed for M1, Crash 500 Index.  Backtest: Deposit $100 DD=0.
QuickClose: Instant Order Management Made Simple QuickClose   allows you to instantly close all orders with a single click. It operates at high speed, giving you the flexibility to close orders for a specific symbol or all symbols at once. This makes trade management significantly faster and more efficient. This   Expert Advisor can swiftly close all buy and sell orders either for a selected symbol or across all trades. The   SymbolButton is specifically designed for order closure, featuring bo
Professional traders know that a reversal in market price is the best entry points to trade. The trend changes K line state changes the most obvious. The SoarSignal is good to identify these changes, because we have incorporated the KDJ indicators. It is the closest to the K line state of the indicators. The two lines of KDJ Winner move within a range of 0 and 100. Values above 80 are considered to be in overbought territory and indicate that a reversal in price is possible. Values below 20 are
This StrongCurrency is a complete trading system based on a variety of technical indicators, moving averages and pivots. Each of those elements can be assessed in defined rules and coefficients (depending on the indicator) providing limitless optimization scenarios for the StrongCurrency. In order to work the StrongCurrency creates a trend strength and entry point signal list display by evaluating these data, that takes data from all symbols. It extrapolates all the information in order to get t
このPowerSignalは、テクニカル指標のATRに基づく完全な取引システムです。これらの指標は、分析されたすべての時間枠と通貨ペアにおける各POWERTRENDの現在のステータスを記録します。 PowerSignalは、これらのデータを評価することにより、トレンド強度とエントリポイント信号リストの表示を作成します。いずれかのペアに完全な一致がある場合、そのような場合を示すアラートがポップアップ表示されます。リストデータには、Symbol、M5-MN1、BuyPercent、SellPercent、LastEntryが含まれます。 LastEntryは、エントリポイント(期間、価格、時間)を表示します。トレンド強度が75%を超える場合、それは強い通貨ペアであると見なされます。 Inputs Value Periods = 14 - indicators Periods. Text color = White - Normal text color. Buy Signal color = LawnGreen - Long signal color. Sell signal col
This indicator shows the crossing between two moving averages, a slower and faster moving average. Signal show alert pop-up, when MA1 crosses above the MA2. Signal show alert pop-up, when MA1 crosses below the MA2. Inputs Value Fast MA Setup Period = 5 - period of Faster Moving Average (value 5). Mode = SMA - type of Moving Average (SMA, EMA, SMMA, LWMA). Price = Close - type of price (Close, Open, Low, High, Median, Typical, Weighted). Slow MA Setup Period = 10 - period of Slower MA (value 10)
This EA is based on the classical trend-following system of opening the positions. The EA is based on DYJ TwoMACrossAlarm and ATR and CCI indicator. It uses two moving averages. The EA uses dynamic allocation MA period. The MA1 and MA2 period is the Fibonacci sequence, such as 5.8 or 13.21 or 21.34 or...; EA Entry Rules: Go long when fast MA1 crosses above the slow MA2 and CCI crosses above the zero line; Go short when fast MA1 crosses below the slow MA2 and CCI crosses below the zero line; the
DYJニュース外貨工場はカレンダー取引ツールとマクロ経済事件の基本的な市場分析指標である。 ここでは、世界最大の経済ブロックの金融ニュースと指標を見つけることができます。アメリカとeuからオーストラリアと日本まで、合計9つの経済ブロックがあり、60以上の通貨ペアが関係しています。 公共ソースからリアルタイムで800以上のマクロ経済指標と事件を収集する。 各指標には、履歴、現在値と予測値、および重要性の特徴があります。 また、このサービスは大量の履歴データをグラフと表の形で保存します。 指標の右側の動的な緑色の矢印は、前回のイベントの発生を示し、その通貨のデータ分析結果、良し悪しを示します。 結果から通貨ペアの数と空を判断できます インジケータの左側にある黄色のアスタリスクは、次に起こるイベントを示しています。 インジケータの時系列列には、各時点のイベントオブジェクトが表示されます。 インジケータには電子メールとプッシュ通知機能があります。 All currency pairs GBPUSD, EURUSD, USDJPY, USDCHF, USDCAD, GBPJPY, E
This indicator shows the crossing between three moving averages (slower, middle and faster ones). When fast MA crosses up middle MA and middle MA crosses up slow MA, the bullish alert is issued. When fast MA crosses down middle MA and middle MA crosses down slow MA, the bearish alert is issued. Signals to close buy positions are generated if fast MA crosses middle MA downwards, signals to close sell positions are generated if fast MA crosses middle MA upwards. Inputs Fast MA Setup MAPeriod1 = 5
The Expert Advisor is based on three Moving Average indicators. ThreeMACross is based on the following idea: crossing of three Moving Average lines (Fast, Middle and slow ones) is used as a signal for opening and closing a position together. Go Long when Fast MA (MA1) crosses above Middle MA (MA2), and Middle MA (MA2) crosses above Slow MA (MA3). Go Short when Fast MA (MA1) crosses below Middle MA (MA2), and Middle MA (MA2) crosses below Slow MA (MA3). Signals to close buy positions are generate
The RiseTrading is a unique High quality and easy to use and affordable trading tool because we have incorporated a number of proprietary features and PowerSignal and MACD and Stochastic indicators. The main advantages of the trend trading strategy used by the Expert Advisor are opening positions only in the direction of a trend, ability for the long-term retention of profitable positions allowing users to achieve good combinations of profit/loss distributions. That can work on a real account at
DYJ株式コントローラは全通貨株式取引システムである M1からMNまでの各通貨ペアのランダムな値を表示できます 1サイクルのStoch値がスーパーエリアとスーパーエリアに到達すると、色のヒントがあります これらの情報に基づいて正しい取引をすることができます 「DYJ在庫管理者」という在庫指標テンプレートを作成して保存してください。 スーパーストアまたはスーパーストアをマウスでクリックすると、対応する通貨ペアのサイクルマップが自動的に開き、Stoch指標がロードされます。 INPUT InpPairs                      = "GBPUSD,EURUSD,USDJPY,USDCHF,XAUUSD,USDCAD,GBPJPY,EURJPY,EURGBP,EURAUD,EURNZD,EURCAD,CADJPY,AUDUSD,AUDNZD,AUDCAD,AUDJPY,NZDJPY,NZDUSD,NZDCAD,GBPAUD,GBPNZD,GBPCAD,CHFJPY,NZDCHF,AUDCHF,EURCHF";     InpStrategyMinTimeFrame   
The DYJ SoarTrading is based on SoarSignal indicator. It can be used for any currency pair and timeframe. Signals to buy are generated when SoarSignal has crossed oversold downwards, reached oversold and then crossed back up through oversold. Signals to sell are generated when SoarSignal has crossed overbought upwards, reached overbought, and then crossed back down through overbought. Close a trade when SoarSignal reaches the opposite side ( overbought for long order, oversold for short order).
The  DYJ WPR - SignalSource is based on  WPR  indicator. It can be used for any currency pair and timeframe. The  WPR  recommends  Indicator values ranging between 80 and 100% indicate that the market is oversold. Indicator values ranging between 0 and 20% indicate that the market is overbought. The entry signal of this indicator is a turning point in the trend. The indicator uses analog trading technology, Provide you with indicators to evaluate the overall profit of the opening signal and clo
DYJ Sharp advanced algorithm that detects new trends and current trend continuations for use as an entry and exit strategy. The strategy display the SHARP trend demarcation area. This SHARP area has high HighLine and low LowLine. Falling of high below HighLine of SHARP and then falling of close below LowLine of SHARP can be interpreted as a signal to sell. Rising of close above HighLine of SHARP and then rising of low above LowLine of SHARP can be interpreted as a signal to buy. The signal for e
DYJ TRENDWAVE features an advanced algorithm that detects new trends and current trend continuations for use as an entry strategy. DYJ TRENDWAVE's volatility is based on the power of buyers and sellers, it grabs total body size of candles and identifies the battle between buyers and sellers as a percentage of the total volume, like Sellers: (-)100% and Buyers: (+)100%. This information can be used for any entry and exit strategy. For bullish/Long Pin bar it is below the price line, for bearish/S
DYJTRENDWAVE features an advanced algorithm that detects new trends and current trend continuations for use as an entry strategy. DYJTRENDWAVE's volatility is based on the power of buyers and sellers, it grabs total body size of candles and identifies the battle between buyers and sellers as a percentage of the total volume, like Sellers: (-)100% and Buyers: (+)100%. This information can be used for any entry and exit strategy. For bullish/Long Pin bar it is below the price line, for bearish/Sho
DYJ Scalpingは完全に自動化された専門家のアドバイザーです。 確率インジケータフィルタはエントリに使用されます。アドバイザーにはヘッジやECNのアカウントタイプが必要です。 オーダーロスはゲームで救済され利益になる。順序が間違っているならば。 いつでも無効にすることができますゲームの戦略。 一般勧告 お勧めのECNのアカウントは、Xauusdスプレッド8と11の間に、ユーリッッドスプレッド1 最低保証金は$ 200です。 Please download the xauusd and EURUSD settings file in the product comments area 入力パラメータ InpLotsRisk                = 0.002  -- Lots Risk x% risk 0.002% If the balance is $10000 and 500 leverage risk 0.1%  If the balance is $100 or $200 and 500 leverage rsik 0.008%, If the balanc
DYJ T3ModeMAはT3アルゴリズムに基づく。 T3アルゴリズムは、米国雑誌「TASC」が発表した記事「より良い移動平均線」で技術分析分野に導入された。 T3価格序列を平滑化しながら、トレンド追跡システムの遅れを減らすことができる。 指標の柱線の大きさによって入場信号が決まり、柱線の大きさが0に近づいたときがトレンドの転換点である。 この指標はシミュレーション取引技術を用いて、 開盤信号と終盤信号の全体的な利益を評価する指標を提供します。 どの評価モデルで取引しても便利です。 最大利益モデル評価モデルを選択すると、 トラッキングストップ機能を使用することをお勧めします。 これにより、トレンド利益を最大限に追跡できます。 逆の信号オフ評価モードを選択した場合、 向こうの信号が出てから平倉に入るのを辛抱強く待つことをお勧めします。 これはトレンドが本格的に終わり、利益が出るのをずっと待つことができます。 指数の開倉と平倉に自動的に従う必要がある場合は、ユーティリティをダウンロードしてください DYJ Follow Me Input [Indicator] InpMaMetod    
DYJ Long term Strategy EAはロングライン取引システムである 私たちはろうそくの中で最低価格を探して多頭トレンドとして始まり、最高価格の空頭トレンドを探して始まり、私たちは最長時間で倉庫を持ち、最大の利益を得ることができます。 注文の方向が間違っている場合、戦略は黒字に転換することができます。 EAは1つの通貨対グラフの任意の周期でのみ実行されます Signal URL INPUT InpMagicNumber = 8257 InpIsDisplayInterface = true InpEAComment = LTS InpRStrategyTimeFrame = 1 Day InpLotsRisk = 0.0002 -- Lots Risk x%,default 0.002% if blance is 10000$ InpLots = 0.01 -- fixed lot [0-->Auto] InpMaxSpread = 100 Maxtrades = 1 InpDirection = Both InpFristOrderStep = 200 InpOr
The DYJBands opens and closes positions using Bollinger Bands signals: It performs trades after a price rebound from the borderlines of the indicator. It has the option to close positions by an opposite signal, by take profit and stop loss, move a trade to breakeven upon reaching the central Bollinger band or after a certain price movement. By default, the EA is configured for trading the GBPUSD currency pair on the H1 timeframe. Also, settings for the EURUSD, USDJPY, USDCAD and XAUUSD currency
The DYJ MacdSto is a unique High quality and easy to use and affordable trading tool because we have incorporated a number of proprietary features and MACD and Stochastic and RSI and ADX indicators. The main advantages of the trend trading strategy used by the Expert Advisor are opening positions only in the direction of a trend, ability for the long-term retention of profitable positions allowing users to achieve good combinations of profit/loss distributions. DYJ MacdSto EA uses MACD and Stoch
This StrongCurrency is a complete trading system based on a variety of technical indicators, moving averages and pivots. Each of those elements can be assessed in defined rules and coefficients (depending on the indicator) providing limitless optimization scenarios for the StrongCurrency. In order to work the StrongCurrency creates a trend strength and entry point signal list display by evaluating these data, that takes data from all symbols. It extrapolates all the information in order to get t
The DYJ TrendPending EA tracks the new change of price of the currency pair and opens trades in case of a price low and high from the main movement in the direction of the trend. So EA uses the least risky grid and Add lots. And can attach a positive and reverse pending order. The PositivePending orders can reduce the number of grids and Add lots,  while ReversePending orders reduce the loss of orders . For more convenient search, the working timeframe has been added to inputs (Work timeframe).
This is a multi-currency and multi-strategy EA. This EA is to create one or more polling trading strategies in a transaction. In the polling mode, the strategies filter a trend-free range market environment and trades are placed in the opposite direction at the edges of the range. With an additional main trend filter in the trend-following mode, the DYJ's ArtOfForexWar can also trade pull-backs during trends in the trend of loss. The winning rate is more than 95% within three orders or three cl
DYJ Scalpingburg EAは完全に自動化された専門家のアドバイザーです。 BURGアルゴリズムフィルタはエントリに使用されます。アドバイザーにはヘッジやECNのアカウントタイプが必要です。 オーダーロスはゲームで救済され利益になる。順序が間違っているならば。 いつでも無効にすることができますゲームの戦略。 一般勧告 お勧めのECNのアカウントは、Xauusdスプレッド8と11の間に、ユーリッッドスプレッド1 最低保証金は$ 200です。 製品コメントエリアでXauusdとEURUSD設定ファイルをダウンロードしてください Input Parameters [Burg] MinProfit                  =  160 -- Open positions if predicted profit >= MinProfit PastBars                   =  200     --   Number of past bars ModelOrder              =  0.37     --   Order of Burg mo
DYJ ArtOfMakingMoney attempts to gauge bullish and bearish forces in the market by using two separate measures, one for each type of directional pressure. The  EA's BearsIndex  attempts to measure the market's appetite for lower prices The EA's BullsIndex attempts to measure the market's appetite for higher prices Features Monitors all pairs at the same time. The EA monitors the top 35 pairs by default, but you can select less pairs if you wish. It is a multi-currency EA that can be run from a s
私たちの目標は、アクセス可能で質の高いサービスを提供し、市場参加者、トレーダー、アナリストに、情報に基づいたタイムリーな取引決定のための非常に必要なツールを提供することです。 最も最適化された、非常に堅牢で使いやすいDYJトレンドアナリストインジケーター。 DYJトレンドアナリストは、方向性圧力のタイプごとに1つずつ、2つの別々の測定値を使用して、市場の強気と弱気の力を測定しようとします。 指標のBearsIndexは、低価格に対する市場の欲求を測定しようとします。 指標のBullsIndexは、より高い価格に対する市場の欲求を測定しようとします。 DYJトレンドアナリスト向けのピボットポイント追加インジケーター。 当社のピボットポイントインジケーターは、ピボットポイントとサポートおよびレジスタンスレベルを計算する高度なアルゴリズムに基づいています。 将来の重要な価格レベルと起こりうる市場の逆転の信じられないほど正確な予測。 すべての市場(外国為替、商品、株式、指数など)と時間枠に役立ちます。 特徴 すべてのペアを同時に監視します。 インジケーターはデフォルトでM
The DYJ Trend Analyser EA is based on  DYJ Trend Analyst  indicator. The most optimized, highly robust and easy to use DYJ Trend Analyser EA. DYJ Trend Analyser EA attempts to gauge bullish and bearish forces in the market by using two separate measures, one for each type of directional pressure. The  EA's BearsIndex  attempts to measure the market's appetite for lower prices. The EA's BullsIndex attempts to measure the market's appetite for higher prices. Pivot Point Extra Indicator for DYJ Tre
This is an expert adviser that is intended to trade where sudden sharp movements occur on charts.  This EA is the trend breakout trading. However it makes only one trade per bar. Low risk EA with no too many positions, and there are predefined TP, SL and TS for each position. Features Monitors all pairs at the same time. The EA monitors the top 15 pairs by default, but you can select less pairs if you wish. It is a multi-currency EA that can be run from a single chart (M5 to D1,recommended timef
フィルタ:
レビューなし
レビューに返信