
Historical Memory
- インディケータ
- バージョン: 2.1
- アップデート済み: 5 12月 2021
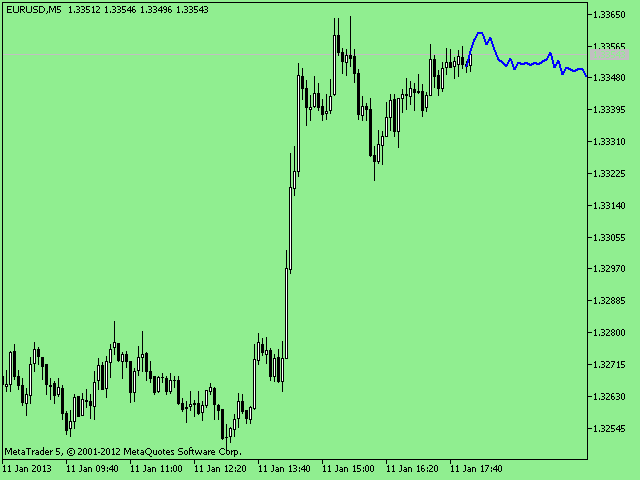
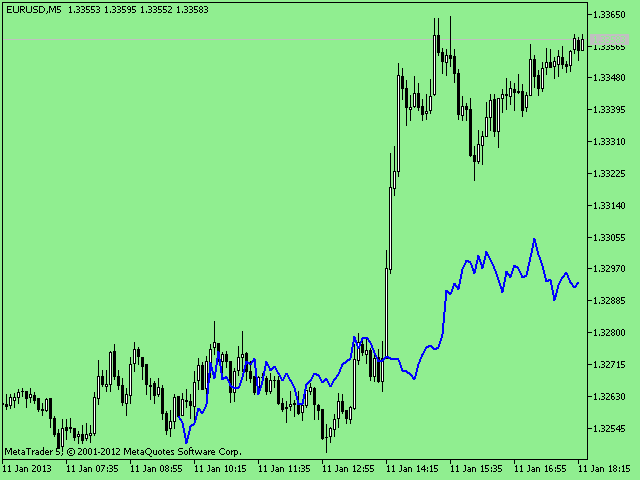
Indicator-forecaster. Very useful as an assistant, acts as a key point to forecast the future price movement.
The forecast is made using the method of searching the most similar part in the history (pattern). The indicator is drawn as a line that shows the result of change of the close price of bars. The depth of history, the number of bars in the forecast, the patter size and the quality of search can be adjusted via the indicator settings.
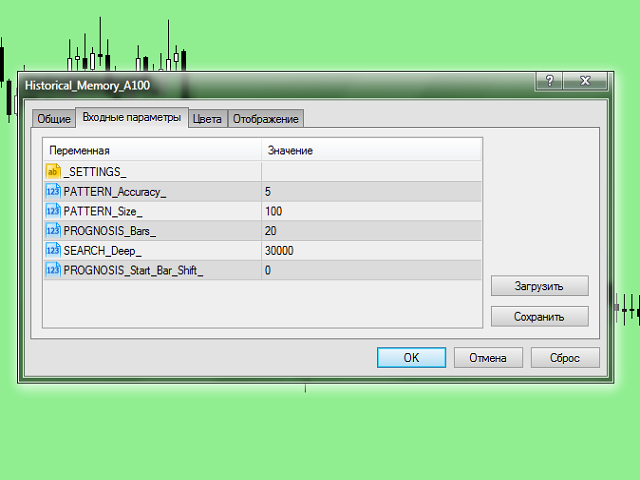
Settings:
- PATTERN_Accuracy_ - quality of the search.
- PATTERN_Size_ - size of the patter (in bars).
- PROGNOSIS_Bars_ - the number of forecast bars.
- SEARCH_Deep_ - depth of history for searching (in bars). If it is set to zero, searches through the entire available history.
- PROGNOSIS_Start_Bar_Shift_ - number of the bar to start the forecast with. Numbering in the old bars direction. 0 is the newest bar.


Очень полезный индикатор! Спасибо автору!