WONNFX iSTATS
- インディケータ
- バージョン: 3.8
- アップデート済み: 2 3月 2026

WONNFX iSTATS - Account Statistics Indicator [MT4]
Indicator Description:
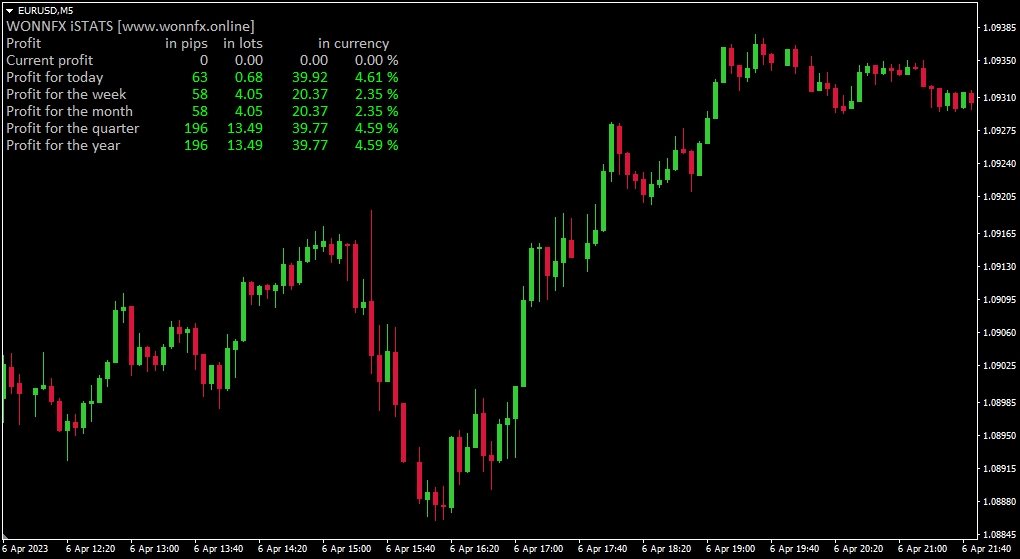
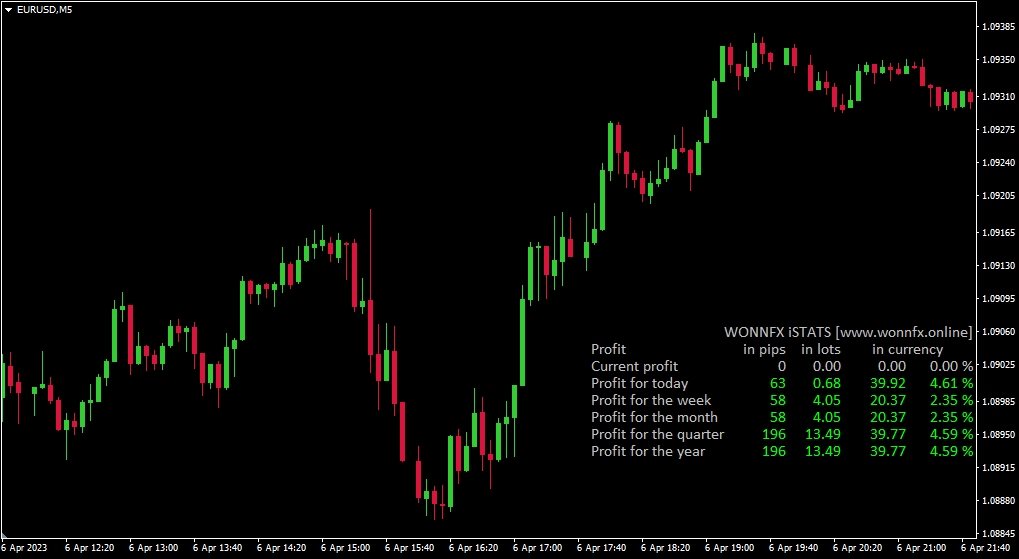
is a informational indicator that displays detailed account statistics directly on your chart. The indicator shows profit/loss across different timeframes (day, week, month, quarter, year), in various units of measurement (pips, lots, deposit currency, percentages), as well as advanced risk metrics.
Unlike the terminal's built-in tools, iSTATS provides a complete picture of your trading performance in real-time and over selected periods.
1. Multi-Level Profit Statistics:
- Current profit from open positions
- Today's profit (closed trades)
- Current week's profit
- Current month's profit
- Current quarter's profit
- Current year's profit
- Pips — for traders who think in pips
- Lots — total volume of open positions
- Currency — profit in deposit currency
- Percent — profit as a percentage of balance
- Max Drawdown — maximum historical drawdown (in currency and percent)
- Profit Factor — ratio of gross profit to gross loss
- Recovery Factor — ratio of total profit to maximum drawdown
- Display profit and volume for specific magic numbers
- Evaluate the performance of individual EAs or strategies
- Choose corner position (4 options)
- Customize colors for profit and loss
- Hide unnecessary columns
- Adjust number precision