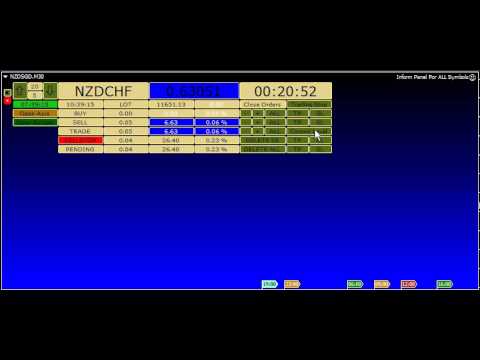
Inform Panel For ALL Symbols

1

Inform Panel For ALL Symbols — Advanced Multi-Instrument Trading Management

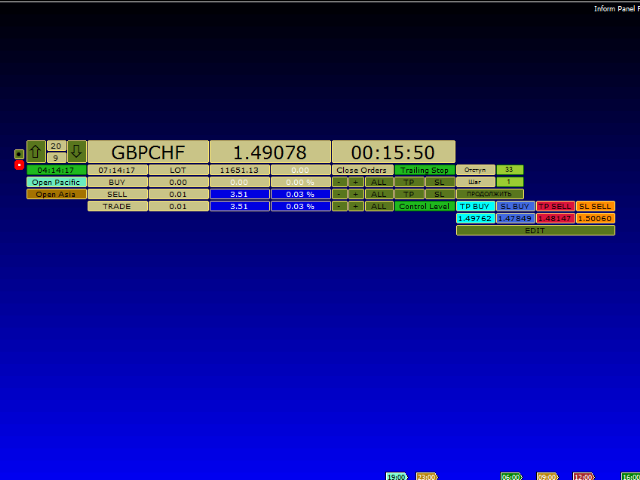
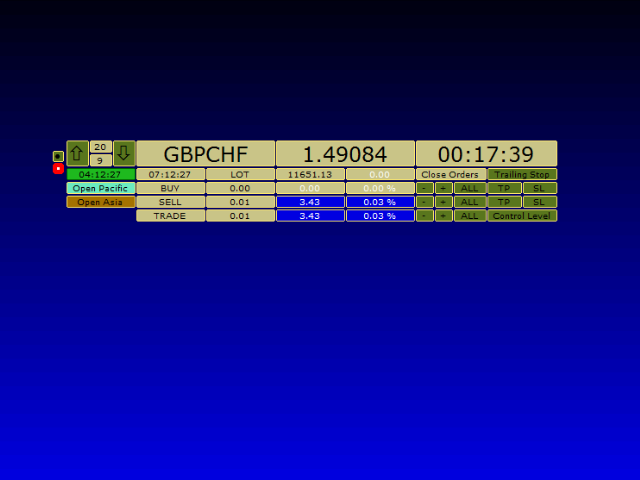
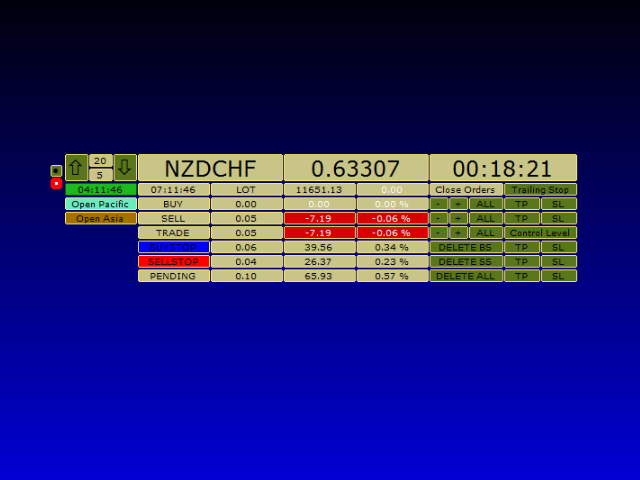
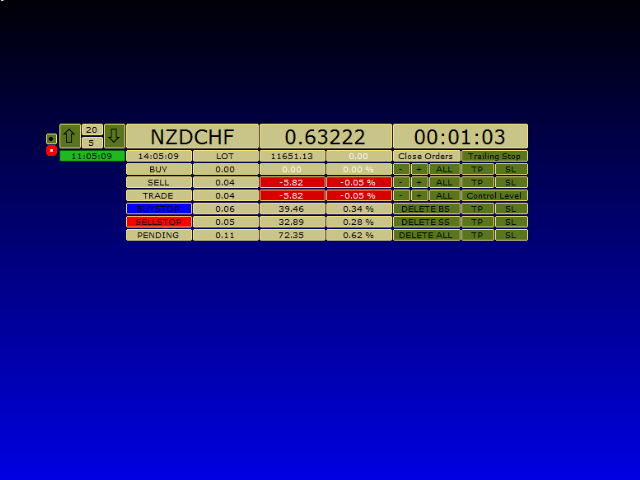
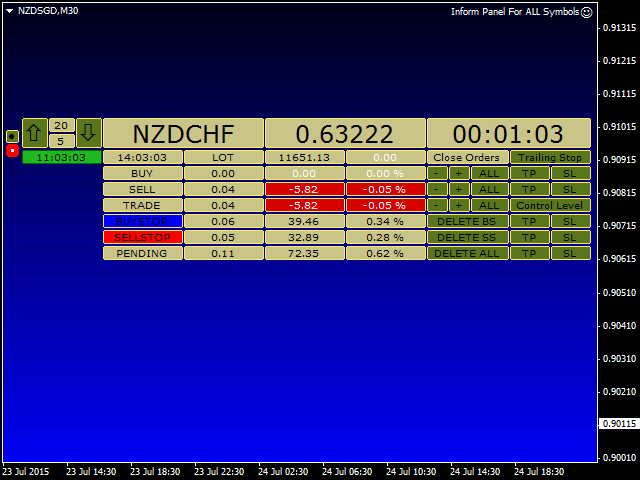
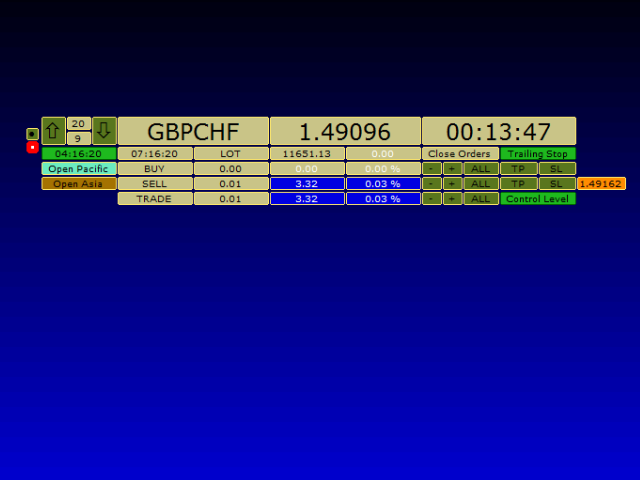
The Inform Panel For ALL Symbols is a sophisticated trading management tool designed to streamline control over all financial instruments in a trader’s portfolio, eliminating the need to attach it to specific charts.

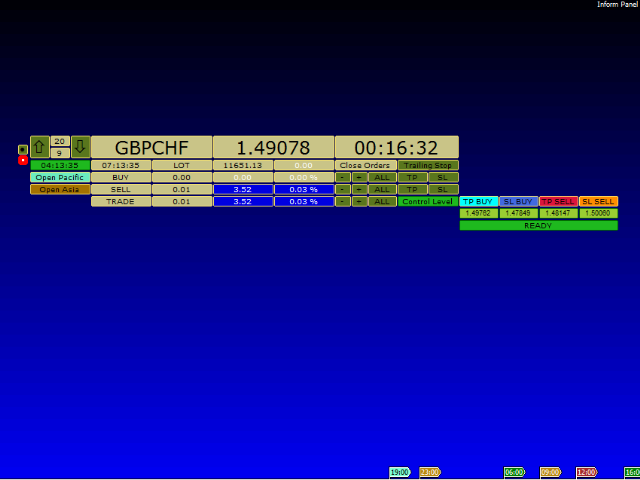
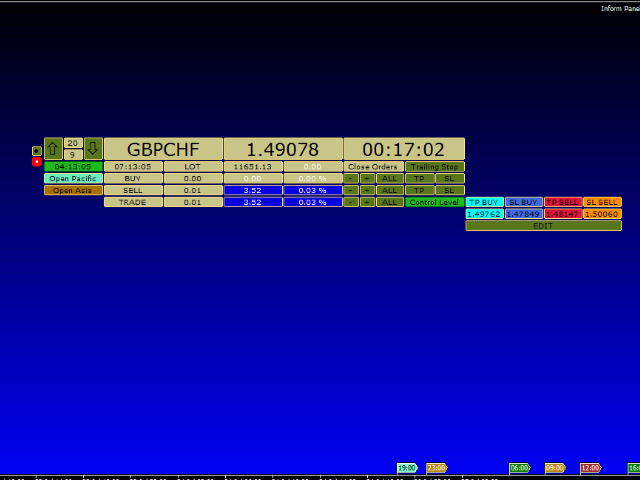
Its core innovation lies in using modifiable virtual levels for stop loss (SL) and take profit (TP), allowing discreet order closure hidden from brokers. The panel automatically detects and lists all active symbols, providing intuitive navigation via "Up" and "Down" buttons, and offers robust tools for order execution and risk management.

Key Features

▪️ Multi-Symbol Support

Manage orders across all opened financial instruments from a single interface.

Navigate symbols effortlessly using dedicated buttons.

▪️ Virtual Levels for Stealth Trading

Replace visible chart lines with customizable virtual levels to mask TP/SL from brokers.

Compatible with both market orders and pending orders.


▪️ Advanced Order Control

Close orders by symbol, magic number, profit/loss, or trailing stop.

Delete pending orders selectively by direction.

Trailing Stop Options

Virtual Trailing Stop: Activated with both "Control Level" and "Trailing Stop" engaged.

Real Trailing Stop: Triggered with "Control Level" active and "Trailing Stop" released.

▪️ Customizable Interface

Adjust panel colors, background, and element visibility.

Toggle confirmation dialogs for faster execution.

▪️ Position Analytics

Real-time data per symbol:

Order type (market/pending).

Total position size (lots).

Funds allocated (% of deposit and absolute value).

One-Click Actions

Close Loss Orders

Close Profit Orders

Close All

Parameters

▪️ Visual Settings

Include Background?: Enable/disable panel background.

Background Color: Customize screen backdrop (e.g., MediumBlue).

▪️ Order Management

Magic Number: Filter orders by magic number (0 = all symbols).

CloseTrades: true closes all symbol orders; false closes by magic number.

Confirmation of Action: Enable/disable prompts for order removal.


Setup

1. Attach the EA to any chart without open positions to avoid conflicts.

2. In chart properties:

Enable "Line" and "Chart Shift".

Set "Grid" and "Line" to "None".

The panel combines efficiency for multi-asset portfolios, discretion through virtual levels, and flexibility in risk management, making it ideal for traders seeking centralized control over diverse instruments.
추천 제품
Candlestick Pattern Scanner is a multi-timeframe and multi-symbol dashboard and alert system that checks all timeframes and currency pairs for different candlestick patterns that are formed in them. Scanner is integrated with support and resistance zones so you can check the candlestick patterns in the most important areas of the chart to find breakout and reversal patterns in the price chart. Download demo version   (works on M30,D1,W1 timeframes and 20 symbols of Market Watch window) Read the
Auto Fibo Pro m
DMITRII GRIDASOV
"Auto FIBO Pro" Crypto_Forex 지표 - 거래에 유용한 보조 도구입니다! - 지표는 자동으로 Fibo 수준과 로컬 추세선(빨간색)을 계산하여 차트에 배치합니다. - Fibonacci 수준은 가격이 반전될 수 있는 주요 영역을 나타냅니다. - 가장 중요한 수준은 23.6%, 38.2%, 50%, 61.8%입니다. - 역전 스캘핑이나 존 그리드 거래에 사용할 수 있습니다. - Auto FIBO Pro 지표를 사용하여 현재 시스템을 개선할 수 있는 기회도 많습니다. - Info Spread Swap Display가 있습니다. 현재 Spread와 Swap이 부착된 외환 쌍을 표시합니다. - 디스플레이에는 계정 잔액, 자본 및 마진도 표시됩니다. - 차트의 어느 모서리에서나 Info Spread Swap Display를 찾을 수 있습니다. 여기를 클릭하여 고품질 트레이딩 로봇과 지표를 확인하세요! 이것은 이 MQL5 웹사이트에서만 제공되는 오리지널 제품입니다.
Risk Commander
Adisorn Soodkanueng
Product Name: Risk Commander: Trade Assistant & Strategy Simulator Risk Commander is more than just a trade panel—it is a complete Manual Trading Ecosystem . It serves two powerful purposes: Live Assistant: Helps you execute trades with speed, precision, and perfect risk management in real-time markets. Training Simulator: Fully compatible with the Strategy Tester (Visual Mode) , allowing you to practice manual trading on historical data without risking a cent. NEW! Built-in Simulator Mode Stop
"Impulses and Corrections 4" is created to help traders navigate the market situation. The indicator shows multi-time frame upward and downward "Impulses" of price movements. These impulses are the basis for determining the "Base" , which is composed of zones of corrections of price movements, as well as "Potential" zones for possible scenarios of price movement. Up and down impulses are determined based on a modified formula of Bill Williams' "Fractals" indicator. The last impulse is always "U

The indicator displays the data of the Stochastic oscillator from a higher timeframe on the chart. The main and signal lines are displayed in a separate window. The stepped response is not smoothed. The indicator is useful for practicing "manual" forex trading strategies, which use the data from several screens with different timeframes of a single symbol. The indicator uses the settings that are identical to the standard ones, and a drop-down list for selecting the timeframe. Indicator Paramet
TradePilot
Hossein Khalil Alishir
TradePilot Expert Advisor (EA) for MetaTrader 4 TradePilot is a professional and user-friendly Expert Advisor (EA) for MetaTrader 4 (MT4) . It simplifies automated trading , risk management , and trade execution using a smart trading panel . Perfect for beginners and experienced traders looking for a reliable trade manager EA with automated lot size calculation . Key Advantages User-Friendly Trading Panel: Customizable panel with buttons and hotkeys. Smart Risk Management: Supports percen
캔들의 종가를 예측하는 지표입니다. 지표는 주로 D1 차트에서 사용하기 위한 것이. 이 지표는 전통적인 외환 거래와 바이너리 옵션 거래 모두에 적합합니다. 지표는 독립형 거래 시스템으로 사용하거나 기존 거래 시스템에 추가로 사용할 수 있습니다. 이 표시기는 현재 양초를 분석하여 양초 본체 내부의 특정 강도 요인과 이전 양초의 매개변수를 계산합니다. 따라서 지표는 시장 움직임의 추가 방향과 현재 양초의 종가를 예측합니다. 이 방법 덕분에 지표는 단기 및 중장기 거래 모두에 적합합니다. 지표를 사용하면 시장 상황을 분석하는 동안 지표가 생성할 잠재적 신호의 수를 설정할 수 있습니다. 표시기 설정에는 이를 위한 특별한 매개변수가 있습니다. 또한 인디케이터는 새로운 신호에 대해 차트의 메시지 형태, 이메일 및 PUSH 알림 형태로 알릴 수 있습니다. 구매 후 저에게 꼭 써주세요! 나는 당신에게 지표와 거래에 대한 나의 추천을 줄 것입니다! 또한 보너스를 받으세요!
CoPilot dashboard MT4
Frederic Jacques Collomb
CoPilot — 일일 트레이딩 대시보드 숫자를 파악하세요. 명확하게 트레이딩하세요. MT5 버전 CoPilot이란? CoPilot은 전문가 수준의 트레이딩 어시스턴트로, 모든 일일 성과 통계를 실시간으로 차트에 직접 표시합니다 — 라이브 에퀴티 커브 는 거래마다 업데이트됩니다. 차트를 벗어나지 않고 세션을 즉시 파악해야 하는 활발한 트레이더를 위해 설계되었으며, CoPilot은 모든 심볼의 당일 모든 청산된 거래 를 집계하여 깔끔하고 색상 코딩된 인터랙티브 패널로 표시합니다. 터미널 히스토리 탭으로 전환할 필요가 없습니다. 수동 계산도 필요 없습니다. CoPilot은 당신의 부조종사 로서 — 항상 주시하고, 항상 계산하며, 항상 눈앞에 있습니다. 실시간 통계 패널 CoPilot은 세 섹션으로 구성된 완전한 일일 성과 지표를 표시합니다: 활동 — 오늘의 총 거래 수, 청산된 거래, 오픈 포지션, 수익/손실 횟수, 승률 (%) 및 손익분기 거래. 승률 색상은 동적으로 변경: 50% 초
Smartility
Syed Oarasul Islam
This utility is designed to help you with your Manual Trading. It allows different ways of closing trades. It can display total number of BUY and SELL orders individually and also their individual profits. It can enter trades without stopl loss and take profits. However upon selecting UseStopLossTakeProfit from the settings it can use best possible stop loss and take profits based on the market conditions. Upon selecting the CloseOppositeTrades  from the settings it can close opposite trades. Fo
Noize Absorption Index MT4
Ekaterina Saltykova
5 (1)
Noize Absorption Index - is the manual trading system that measures the difference of pressure between bears forces and bulls forces. Green line - is a noize free index that showing curent situation. Zero value of index shows totally choppy/flat market.Values above zero level shows how powerfull bullish wave is and values below zero measures bearish forces.Up arrow appears on bearish market when it's ready to reverse, dn arrow appears on weak bullish market, as a result of reverse expectation. S
VR Cub
Vladimir Pastushak
VR Cub 은 고품질 진입점을 얻는 지표입니다. 이 지표는 수학적 계산을 용이하게 하고 포지션 진입점 검색을 단순화하기 위해 개발되었습니다. 지표가 작성된 거래 전략은 수년 동안 그 효율성을 입증해 왔습니다. 거래 전략의 단순성은 초보 거래자라도 성공적으로 거래할 수 있다는 큰 장점입니다. VR Cub은 포지션 개시 지점과 이익 실현 및 손절매 목표 수준을 계산하여 효율성과 사용 편의성을 크게 높입니다. 간단한 거래 규칙을 이해하려면 아래 전략을 사용한 거래 스크린샷을 살펴보세요. 설정, 세트 파일, 데모 버전, 지침, 문제 해결 등은 다음에서 얻을 수 있습니다. [블로그] 다음에서 리뷰를 읽거나 작성할 수 있습니다. [링크] 버전 [MetaTrader 5] 진입점 계산 규칙 포지션 개설 진입점을 계산하려면 VR Cub 도구를 마지막 최고점에서 마지막 최저점까지 늘려야 합니다. 첫 번째 지점이 두 번째 지점보다 빠른 경우, 거래자는 막대가 중간선 위에서 마감될 때까지 기다립니다
We present you the indicator "Candle closing counter", which will become your indispensable assistant in the world of trading. That’s why knowing when the candle will close can help: If you like to trade using candle patterns, you will know when the candle will be closed. This indicator will allow you to check if a known pattern has formed and if there is a possibility of trading. The indicator will help you to prepare for market opening and market closure. You can set a timer to create a pre
Product Description: MT4 Trade Copier with Advanced Features MT4  Trade Copier is designed to streamline and enhance your trading experience by allowing seamless replication of trades across multiple accounts. It offers advanced features to cater to different trading needs and preferences. Features: Master/Slave Selection: Easily choose between master and slave modes to manage trades effectively. Multiplier for Slave Accounts: Set a multiplier to adjust the size of trades copied to slave a

Price Magnets
Ivan Simonika
Price Magnet — Price Density and Attraction Levels Indicator Price Magnet is a professional analytical tool designed to identify key support and resistance levels based on statistical Price Density. The indicator analyzes a specified historical period and detects price levels where the market spent the most time. These zones act as “magnets,” attracting price action or forming a structural base for potential reversals. Unlike traditional Volume Profile tools, Price Magnet focuses on price-time d
Trend Ray
Andriy Sydoruk
The indicator shows the potential trend direction by cyclical-wave dependence. Thus, all the rays of the intersection will be optimal rays, in the direction of which the price is expected to move, taking into account the indicator period. Rays can be used as a direction for potential market movement. But we must not forget that the approach must be comprehensive, the indicator signals require additional information to enter the market.
Trendiness Index
Libertas LLC
5 (3)
"The trend is your friend" is one of the best known sayings in investing, because capturing large trendy price movements can be extremely profitable. However, trading with the trend is often easier said than done, because many indicators are based on price reversals not trends. These aren't very effective at identifying trendy periods, or predicting whether trends will continue. We developed the Trendiness Index to help address this problem by indicating the strength and direction of price trend
Super Reversal Pattern
Parfait Mujinga Ndalika
Super Reversal Pattern Indicator Unlock the power of advanced pattern recognition with our Super Reversal Pattern Indicator. Designed for traders seeking precision and reliability, this indicator identifies one of the most effective reversal patterns in technical analysis, offering a significant edge in your trading strategy. Key Features: Non-Repainting Accuracy: Enjoy the confidence of non-repainting technology. Once a Super Reversal Pattern is detected, it remains static, providing consiste
Gold Bricks FX USES THE TREND WAVE INDICATOR AND IT CAN IDENTIFY THE BEGINNING AND THE END OF A NEW WAVE TREND MOVEMENT. AS AN OSCILLATOR, THE INDICATOR IDENTIFIES THE OVERBOUGHT AND OVERSOLD ZONES. IT WORKS GREAT TO CATCH THE SHORT TERM PRICE REVERSALS AND USES A MARTINGALE STRATEGY TO CLOSE ALL TRADES IN PROFIT. USE DEFAULT SETTINGS ON H1 OR HIGHER TIME FRAME ON ANY PAIR FOR MORE ACCURATE TRADES WHY THIS EA : Smart entries calculated by 4 great strategies The EA can be run on even a $300
Binary panel for MT4. My development - a dashboard for binary options in MT4 (for example, the broker Grant Capital) has functions such as buy and sell (up and down), expiration time settings as on binary platforms (analogous) from 1 minute and up, increments of, for example, 5 minutes and up. It has lot settings from $1 and up. It has a balance level on the panel.
Trade with Gann on your side!! MASTER CIRCLE 360 CIRCLE CHART, originally created by Gann admitted that this is “The Mother of all charts”. It is one of the last studies that this great trader left for us. The numeric tab le is apparently quite simple like all the tables and is based on square numbers, the SQUARE OF 12 and is by evolution, one of the most important square numbers. Here we can find CYCLE, PRICE AND TIME thanks to angles and grades, to show past and future support and resistance.
Color Stochastic Enhanced Stochastic Oscillator with Cross Detection and Visual Signal Support Overview Color Stochastic is a customized version of the classic Stochastic Oscillator designed for momentum analysis and crossover visualization. The indicator provides color-based signal marking and configurable crossover detection at user-defined overbought and oversold levels. It can be used as part of: Momentum analysis Mean reversion workflows DCA-based strategies Multi-indicator confirmation sys
BreakEven Line is a very useful and easy to use indicator. In case of multiple positions opened on the same instrument, the indicator shows the breakeven point where it is possible to close the positions. Its graphic simplicity makes it an unobtrusive and customizable tool. You can enable/disable a line on a chart, so you can make the indicator invisible. Inputs Show cumulative BE (line on/off) Breakeven line color (to change the line color) Breakeven line style Breakeven line width Show short B
Magic Filter MTF
Yaroslav Varankin
Magic Filter MTF is perfect for any strategy. you do not need to load the chart with extra indicators like this one indicator will replace all additional filters for you it can also be a great strategy. it combines well with trading at local minima and maximums (resistance levels) multi-timeframe-multi-currency indicator 4 screen system is used 4 rows of arrows UTB indicators adjusted for different periods when two arrows pointing in the same direction on the same timeframe coincide,I t c
This indicator presents an alternative approach to identify Market Structure. The logic used is derived from learning material created by   DaveTeaches (on X) Upgrade v1.10: add option to put protected high/low value to buffer (figure 11, 12) When quantifying Market Structure, it is common to use fractal highs and lows to identify "significant" swing pivots. When price closes through these pivots, we may identify a Market Structure Shift (MSS) for reversals or a Break of Structure (BOS) for co

Trend Line Map Pro
STE S.S.COMPANY
4.5 (16)
트렌드 라인 맵 표시기는 트렌드 스크리너 표시기의 애드온입니다. Trend screener (Trend Line Signals)에 의해 생성된 모든 신호에 대한 스캐너로 작동합니다. Trend Screener Indicator 기반의 Trend Line Scanner입니다. Trend Screener Pro 표시기가 없으면 Trend Line Map Pro가 작동하지 않습니다. MQL5 블로그에 액세스하여 추세선 지도 표시기의 무료 버전을 다운로드할 수 있습니다. Metatrader Tester 제한 없이 구매하기 전에 사용해 보십시오. :   여기를 클릭하세요 1. 쉽게 얻을 수 있는 이점 통화 및 시간 프레임을 기반으로 매수 및 매도 신호를 표시합니다. 차트에 화살표가 나타난 이후 가격이 몇 핍 증가 또는 감소했는지 평가하십시오. ( 트렌드 스크리너 표시기 화살표 ) 신호의 타이밍을 표시합니다. 구매 및 판매 알림에 대한 다중 기간 및 다중 통화 알림 받기. 2. 추세
Trade panel manual is a multifunctional trading assistant. It allows you to open market and pending orders in one click. Value is set via button menu edit or deleted by specific buttons pending orders and the value of take profit and stop loss in one click. Through the edit menu of the button, a value is set that can be easily changed by simply moving level_tp lines for take profit or stop loss levels and for pending orders. It is possible to select orders and determine for them and set the leve

Point61 Indicator
Evgeniy Machok
5 (1)
The Point61 indicator is the result of many years of monitoring of price behavior of currency pairs and metals. It is not a secret, that in times of uncertainty, traders are looking for possible levels of support and resistance - the point, where price should stop its movement. There are 2 possible scenarios at these points: 1. Reverse (correction) to the opposite direction; 2. Breakthrough to continue movement. Very often these points are used to set stop orders - TakeProfit or StopLoss
URGENCY “Limited launch pricing” “Price increases after version 2.0” Currencies Gold Momentum Flow Dashboard  — See Market Strength Instantly A powerful all-in-one dashboard that shows real-time momentum across multiple timeframes (M5–D1) for forex and gold. Multi-timeframe ROC analysis Built-in trade signals (alignment & momentum shifts) Currency strength meter Heatmap for instant trend recognition Alerts + one-click pair switching Stop switching charts — see the entire market in
An indicator of pattern #31 ("Long Island") from Encyclopedia of Chart Patterns by Thomas N. Bulkowski. The second gap is in the opposite direction. Parameters: Alerts - show alert when an arrow appears   Push - send a push notification when an arrow appears (requires configuration in the terminal) GapSize - minimum gap size in points ArrowType - a symbol from 1 to 17 ArrowVShift - vertical shift of arrows in points   ShowLevels - show levels ColUp - color of an upward line ColDn - color of a
BlueDigitsFx 공식 생태계 액세스 인프라 업데이트, 트레이딩 리소스, 제품 출시 정보 및 BlueDigitsFx 공식 생태계에 대한 액세스를 받아보세요. Telegram 생태계 웹사이트 MT5 버전 BlueDigitsFx Spike And Strike Reversal MT4 — 시장 반전 및 모멘텀 분석을 위한 복합 오실레이터 BlueDigitsFx Spike And Strike Reversal 은 여러 지표 신호를 결합한 복합 오실레이터로, 트레이더가 잠재적인 시장 반전, 모멘텀 변화 및 추세 소진 상태를 식별할 수 있도록 돕습니다. 이 지표는 오실레이터 기반 확인 기능을 포함한 여러 분석 요소를 통합하며, 차트에 직접 시각적 신호를 표시하여 구조적인 반전 분석을 지원합니다. Spike And Strike는 다양한 시장 환경에서 반전, 되돌림 및 모멘텀 전환 구간에서 추가적인 확인을 원하는 트레이더를 위해 설계되었습니다. 주요 기능 오실레이터 기반의 시각적 반전
이 제품의 구매자들이 또한 구매함
Trade Manager EA에 오신 것을 환영합니다. 이 도구는 거래를 보다 직관적이고 정확하며 효율적으로 만들기 위해 설계된 궁극적인 리스크 관리 도구 입니다. 단순한 주문 실행 도구가 아닌, 원활한 거래 계획, 포지션 관리 및 리스크 제어를 위한 종합 솔루션입니다. 초보자부터 고급 트레이더, 빠른 실행이 필요한 스캘퍼에 이르기까지 Trade Manager EA는 외환, 지수, 상품, 암호화폐 등 다양한 시장에서 유연성을 제공합니다. Trade Manager EA를 사용하면 복잡한 계산은 이제 과거의 일이 됩니다. 시장을 분석하고 진입, 손절 및 익절 수준을 차트의 수평선으로 표시한 후 리스크를 설정하면, Trade Manager가 이상적인 포지션 크기를 즉시 계산하고 SL 및 TP 값을 실시간으로 표시합니다. 모든 거래가 간편하게 관리됩니다. 주요 기능: 포지션 크기 계산기 : 정의된 리스크에 따라 거래 크기를 즉시 결정합니다. 간단한 거래 계획 : 진입, 손절, 익절을 위한
Local Trade Copier EA MT4
Juvenille Emperor Limited
4.96 (110)
Local Trade Copier EA MT4 를 사용하여 매우 빠른 거래 복사 경험을 해보세요. 1분 안에 간편하게 설정할 수 있으며, 이 거래 복사기를 사용하면 Windows 컴퓨터 또는 Windows VPS에서 여러 개의 MetaTrader 터미널 간에 거래를 0.5초 미만의 초고속 복사 속도로 복사할 수 있습니다. 초보자든 전문가든 Local Trade Copier EA MT4 는 다양한 옵션을 제공하여 사용자의 특정 요구에 맞게 맞춤 설정할 수 있습니다. 이는 수익 잠재력을 높이려는 모든 사람을 위한 최고의 솔루션입니다. 지금 사용해보시고 이것이 왜 시장에서 가장 빠르고 쉬운 무역용 복사기인지 알아보세요! 팁: 여기 에서 데모 계정에서 Local Trade Copier EA MT4 데모 버전을 다운로드하여 사용해 볼 수 있습니다. 다운로드한 무료 데모 파일을 MT4 >> File >> Open Data Folder >> MQL4 >> Experts 폴더에 붙여넣고 터미널
Strategy Builder offers an incredible amount of functionality. It combines a trade panel with configurable automation (covert indicators into an EA), real-time statistics (profit & draw down) plus automatic optimization of SL, TP/exit, trading hours, indicator inputs. Multiple indicators can be combined into an single alert/trade signal and can include custom indicators, even if just have ex4 file or purchased from Market. The system is easily configured via a CONFIG button and associated pop-up
Trade Assistant MT4
Evgeniy Kravchenko
4.43 (197)
거래당 위험 계산, 라인을 사용한 손쉬운 신규 주문, 부분 청산 기능을 통한 주문 관리, 7가지 유형의 트레일링 스탑 및 기타 유용한 기능을 제공합니다. 추가 자료 및 지침 설치 지침 - 애플리케이션 지침 - 데모 계정용 애플리케이션 평가판 라인 기능       - 차트에 개시선, 손절매, 차익실현을 표시합니다. 이 기능을 사용하면 새로운 주문을 쉽게 하고 개봉 전에 추가 특성을 볼 수 있습니다. 위기 관리       -       위험 계산 기능은 설정된 위험과 손절매 주문의 크기를 고려하여 새 주문의 볼륨을 계산합니다. 이를 통해 손절매 크기를 설정하고 동시에 설정된 위험을 존중할 수 있습니다. 로트 계산 버튼 - 위험 계산을 활성화/비활성화합니다. 필요한 위험 값은 위험 필드에 0에서 100 사이의 백분율 또는 예금 통화로 설정됩니다. 설정 탭에서 위험 계산 옵션을 선택합니다. $ 통화, % 잔액, % 지분, % 자유 마진, % 사용자 정의, % AB 이전 일, % AB
PZ Trade Pad Pro MT4
PZ TRADING SLU
3.67 (3)
Effortlessly calculate lot sizes and manage trades to save time and avoid costly errors The Trade Pad Pro EA is a tool for the Metatrader Platform that aims to help traders manage their trades more efficiently and effectively. It has a user-friendly visual interface that allows users to easily place and manage an unlimited number of trades, helping to avoid human errors and enhance their trading activity. [ Installation Guide | Update Guide | Troubleshooting | FAQ | All Products ] One of the k
수동 매매를 위한 전문가용 트레이딩 패널로, 정밀한 진입부터 계좌 보호까지 매매의 전 과정을 차트 위 하나의 창에 담았습니다. 정해진 리스크에 정확히 맞춰 모든 포지션의 거래량을 산정하고, RR Tool로 차트에 직접 라인을 그려 거래를 설계하며, Market 주문과 예약 주문은 물론 Grid와 OCO까지 사용할 수 있습니다. 포지션 관리는 패널이 대신 처리합니다. 최대 다섯 단계 부분 청산, 여섯 가지 트레일링 스탑, 브레이크이븐, Virtual SL/TP를 지원합니다. 일간·주간·월간 한도가 예치금을 지키며, 기준을 넘기는 즉시 자동으로 발동됩니다. 가이드와 무료 Live 데모 무료 Live 데모 버전은 여기에서 이용할 수 있습니다 ( Free Live Demo ). 제품 사용 가이드는 여기에서 확인할 수 있습니다 ( User Manual ). NT Trade Manager는 트레이더의 모든 작업 흐름을 차트 위 작고 간결한 패널 하나에 모아, 터미널 창을 오갈 필요도, 진입할
Trading History MT4
Siarhei Vashchylka
5 (9)
Trading History - A program for trading and money management on the history of quotes in stratagy tester. It can work with pending and immediate orders, and is equipped with trailing stop, breakeven and take profit functions. Very good for training and testing different strategies. Manual (Be sure to read before purchasing) Advantages 1. Allows you to test any trading strategy in the shortest possible time 2. An excellent simulator for trading training. You can gain months of trading experience
MACD Divergence Scanner is a multi-timeframe and multi-symbol dashboard and alert that checks all timeframes and symbols to find regular and hidden divergences between price chart and MACD indicator. This divergence scanner is integrated with support and resistance zones so you can check the MACD divergences in the most important areas of the chart to find trend reversals in the price chart. Download demo version   (works on M 1,M5,M30,W1   timeframes) Full description of scanner parameters ->  
TradePanel MT4
Alfiya Fazylova
4.84 (95)
Trade Panel은 다기능 거래 도우미입니다. 이 애플리케이션에는 50개 이상의 수동 거래 기능이 포함되어 있으며 대부분의 거래 작업을 자동화할 수 있습니다. 구매하기 전에 데모 계정에서 데모 버전을 테스트할 수 있습니다. 데모 계정용 애플리케이션 체험판 다운로드: https://www.mql5.com/en/blogs/post/750865 . 전체 지침 여기 . 거래. 한 번의 클릭으로 거래를 수행할 수 있습니다: 리스크 자동 계산과 함께 예약 주문 및 포지션 열기. 한 번의 클릭으로 여러 주문 및 포지션 열기. 주문 그리드 열기. 예약 주문 및 포지션을 그룹별로 닫기. 포지션 방향 전환 (Buy 닫기 > Sell 열기, Sell 닫기 > Buy 열기). 포지션 잠금 (부족한 포지션을 열어 Buy와 Sell 포지션의 수량을 동일하게 만들기). 모든 포지션 한 번의 클릭으로 부분적으로 닫기. 모든 포지션의 테이크 프로핏과 스톱로스를 같은 가격 수준에 설정. 모든 포지션의 스톱로스를
King Trade Copier MT4
Mohammed Maher Al-sayed Mohammed Ahmed Saleh
King Trade Copier MT4 – Lightning-Fast Local Trade Copier (Master + Slave in ONE file) King Trade Copier is a professional local trade copier that mirrors every trading action from one Master account to unlimited Slave accounts on the same PC or VPS — with an internal copy latency of just a few milliseconds. It was built by a real trader for daily real-money use, with one goal: whatever happens on the Master must happen on the Slave, instantly and without exceptions. Watch the demo video to s
SmartFastTrade AI
Muhammad Faisal Sagala
Transform Your Trading with SmartFastTrade AI: Speed and Ease at Your Fingertips! Introduction Are you a trader struggling with slow order execution? Do you want a tool that can assist you in making quick and accurate trading decisions? If yes, then SmartFastTrade AI is the answer to all your trading needs. With its unique combination of speed, user-friendliness, and advanced features, SmartFastTrade AI will help you unlock your full trading potential. Let's delve deeper into why this innovativ
작동 체험판 다운로드 Copy Cat More (카피캣) MT4 트레이드 카피어 (Trade Copier) 는 단순한 로컬 트레이드 카피어가 아닙니다. 오늘날의 트레이딩 과제를 위해 설계된 완전한 리스크 관리 및 실행 프레임워크 (risk management and execution framework) 입니다. 프롭 펌 (prop firm) 챌린지부터 개인 포트폴리오 관리까지, 견고한 실행, 자본 보호, 유연한 설정, 고급 트레이드 처리의 조합으로 모든 상황에 적응합니다. 이 카피어는   마스터 (Master, 송신측) 와 슬레이브 (Slave, 수신측)   두 모드 모두에서 작동하며, 시장가 주문과 대기 주문, 트레이드 수정, 부분 청산, 상호 청산 (Close By) 작업을 실시간으로 동기화합니다. 데모 및 실거래 계좌, 트레이딩 또는 인베스터 로그인 모두와 호환되며, EA·터미널·VPS가 재시작되더라도 영구 트레이드 메모리 (Persistent Trade Memory) 시
The product will copy all telegram signal to MT4   ( which you are member  ) , also it can work as remote copier.  Easy to set up, copy order instant, can work with almost signal formats, image signal, s upport to translate other language to English Work with all type of channel or group, even channel have "Restrict Saving Content", work with  multi channel, multi MT5 Work as remote copier: with signal have ticket number, it will copy exactly via ticket number. Support to backtest signal. How to
Telegram to MT4 Multi-Channel Copier 는 Telegram 채널의 트레이딩 신호를 자동으로 MetaTrader 4로 직접 복사합니다. 봇도, 브라우저 확장 프로그램도, 수동 복사도 필요 없습니다. Telegram에서 신호를 받으면 EA가 몇 초 안에 터미널에서 거래를 엽니다. 본 제품은 두 가지 구성 요소로 구성되어 있습니다: Telegram 채널을 감시하는 Windows 애플리케이션과 MT4 터미널에서 신호를 실행하는 이 Expert Advisor입니다. MT5 버전도 제공됩니다. 설정 가이드 및 애플리케이션 다운로드: https://www.mql5.com/en/blogs/post/768988 작동 방식 Windows 애플리케이션은 봇이 아닌 사용자 자신의 API 자격 증명을 사용하여 Telegram에 연결됩니다. 이는 프라이빗 및 VIP 채널을 포함하여 구독 중인 모든 채널, 그룹 또는 주제를 읽을 수 있음을 의미합니다. 신호를 감지하면 이를 파싱하여
MT4 to Telegram Signal Provider 는 사용하기 쉽고 완전히 사용자 정의가 가능한 도구로, 텔레그램으로 신호를 보내어 계정을 신호 제공자로 변환할 수 있습니다. 메시지 형식은 완전히 사용자 정의가 가능합니다! 그러나 간단한 사용을 위해 미리 정의된 템플릿을 선택하고 메시지의 특정 부분을 활성화하거나 비활성화할 수도 있습니다. [ 데모 ]  [ 매뉴얼 ] [ MT5 버전 ] [ 디스코드 버전 ] [ 텔레그램 채널 ]  New: [ Telegram To MT5 ] 설정 단계별 사용자 가이드 가 제공됩니다. 텔레그램 API에 대한 지식이 필요 없으며, 개발자가 필요한 모든 것을 제공합니다. 주요 기능 구독자에게 보낸 주문 세부 정보를 사용자 정의할 수 있는 기능 예를 들어 브론즈, 실버, 골드와 같은 계층 구독 모델을 만들 수 있습니다. 골드 구독은 모든 신호 등을 받게 됩니다. ID, 심볼 또는 코멘트별 주문 필터링 주문이 실행된 차트의 스크린샷을 포함 보낸
TradeMirror 은 MT4/MT5 플랫폼을 위해 특별히 설계된 현지화된 주문 복사 도구로, 실시간 거래 작업을 동기화합니다. 튜토리얼 더 많은 튜토리얼을 보려면 Trademirror 튜토리얼 링크를 클릭하세요. 제품 장점 금융 소프트웨어의 보안성, 안정성 및 개인정보 보호에 대한 높은 표준 요구사항을 기반으로, 우리는 세 가지 핵심 차원에서 심층 최적화를 수행했습니다: 직관적이고 간결한 그래픽 인터페이스로 누구나 쉽게 조작 가능 강화된 개인정보 보호 메커니즘으로 금융 환경의 민감한 데이터 격리 요구 충족 밀리초 단위의 주문 동기화로 신호 분배의 정확성과 지연 없음 보장 MT4/MT5 양 플랫폼과 완전히 호환되어 다양한 거래 환경에 원활하게 적용 지능형 시스템 모니터링과 이메일 알림을 결합하여 거래 안정성을 실시간으로 보장 핵심 기능 특성 제품은 다음과 같은 전문적인 복사 기능을 탑재하고 있습니다: 다중 계정 병렬 연결 이메일 실시간 푸시 맞춤형 로트 크기 조정 신호 필터링 메커
RS Trade Copier - 진짜 그래픽 인터페이스를 갖춘 초고속 로컬 트레이드 카피어입니다. 계좌번호를 일일이 입력하지 마세요. 200개가 넘는 복잡한 입력 파라미터 목록은 이제 끝입니다. 여러 MT4와 MT5 터미널 간 거래 작업을 복사하기 위한 안정적이고 유연한 도구입니다. 이 도구는 경험 많은 트레이더, 신호 서비스, 개인 투자자 모두에게 적합합니다. 하나 또는 여러 시그널 소스(Provider)에서 하나 또는 여러 리시버(Client)로 트레이딩을 동기화 하여 높은 정밀도와 최소 지연 시간을 제공합니다. 간단한 자동 설정부터 고급 수동 구성까지 지원합니다. 수동 또는 다른 EA로 열린 주문에 간섭하지 않습니다. 모든 작업이 MT4 내부에서 로컬로 처리 되며 외부 서버 의존성 없이 실행됩니다. RS Trade Copier와 다른 솔루션 비교 RS Trade Copier 다른 솔루션 설정 시각적 단계별 마법사. 설정에 약 1분 소요. 200개 이상의 불분명한 입력 매개변수.
Telegram to MT4 Coppy
Sergey Batudayev
4.09 (11)
Telegram에서 MT4로:   최고의 신호 복사 솔루션 최첨단 유틸리티인   Telegram to MT4를   사용하여 거래를 간소화하세요. DLL 없이도 Telegram 채널과 채팅에서 MetaTrader 4 플랫폼으로 거래 신호를 직접 복사할 수 있습니다. 이 강력한 솔루션은 탁월한 정밀도와 맞춤 설정 옵션을 통해 원활한 신호 실행을 보장하여 시간을 절약하고 효율성을 높여줍니다. [ Instructions and DEMO ] 주요 특징 직접 Telegram API 통합 전화번호와 보안 코드를 통해 인증하세요. 사용자 친화적인 EXE 브리지를 사용하여 채팅 ID를 손쉽게 가져오고 관리하세요. 여러 채널/채팅을 추가, 삭제, 새로 고침하여 동시에 신호를 복사합니다. 고급 필터를 사용한 신호 파싱 사용자 정의 예외 단어(예: "보고서", "요약")가 포함된 원치 않는 신호를 건너뜁니다. 유연한 SL 및 TP 형식을 지원합니다: 가격, 핍 또는 포인트. 신호가 가격 대신 지점을 지정
Trade Copier Global
Laszlo Tormasi
5 (15)
Trade Copier Global: The name speaks for itself. This copier allows you to copy orders between MT4 terminals even if they are not installed on the same computer. Features Copying trades between MT4 terminals around the world with a short delay. Automatically recognizes symbol prefixes. Can connect many Slaves to the same Master. Supports pending and market orders. Supports partial order close (with limitations, see below) Can send messages and notifications to the Slaves from the Master Several
복사기->편리하고 빠른 인터페이스 상호작용으로 사용자가 바로 사용 가능       ->>>> Windows 컴퓨터 또는 VPS Windows에서 사용하는 것이 좋습니다. 특징: 다양하고 개인화된 복사 거래 설정: 1. 다양한 신호 소스에 대해 다양한 로트 모드를 설정할 수 있습니다. 2. 다양한 신호 소스를 포워드 및 리버스 복사 거래에 대해 설정할 수 있습니다. 3. 신호는 주석으로 설정할 수 있습니다. 4. 계약 로트에 따라 로트를 교정할지 여부 다양하고 개인화된 복사 주문 설정 2: 1. 다양한 품종에 대해 다양한 로트 모드를 설정할 수 있습니다. 2. 정방향 및 역방향 복사 주문에 대해 다양한 품종을 설정할 수 있습니다. 3. 주석으로 신호를 설정할 수 있습니다. 4. 계약 로트에 따라 로트를 교정할지 여부 댓글 필터링, MAGIC 필터링, 시그널 로트 필터링, 로컬 제품 필터링 근무시간 설정 역동기화 SLAVE 닫힘 주문 바인딩 기능: 모든 주문은 설정된 신호 소스 주문
News Filter EA: Advanced Algo Trading Assistant News Filter EA is an advanced algo trading assistant designed to enhance your trading experience. By using the   News Filter EA , you can integrate a Forex economic news filter into your existing expert advisor, even if you do not have access to its source code. In addition to the news filter, you can also specify   trading days   and   hours   for your expert. The News Filter EA also includes   risk management   and   equity protection   features
일별 및 주별 마감 거래 내역, 현재 진행 중인 거래, 외환 노출을 한 차트에서 즉시 확인하세요! 히트맵을 사용하여 수익성 있는 거래와 거래 포트폴리오 내에서 현재 하락이 있는 위치를 파악하세요. 빠른 마감 버튼 빠른 마감 버튼을 사용하여 단일 심볼에 대한 모든 거래를 마감하거나, 개별 거래를 전체적으로 마감하거나, 버튼을 클릭하여 일부 수익 또는 손실을 실현하세요. 더 이상 목록에서 거래를 찾아 거래의 일부를 마감하는 방법을 알아낼 필요가 없습니다. 대시보드는 외환 쌍을 거래하는 동안 각 통화 심볼에 대한 현재 노출도 표시하므로 주요 뉴스 이벤트에 앞서 과도하게 노출될 수 있는 영역을 파악하는 데 도움이 됩니다. 버튼을 사용하여 뉴스가 나오기 전에 노출을 즉시 빠르게 줄이거나, 이미 뉴스가 발생하여 수익을 창출한 경우 클릭 한 번으로 빠르게 수익을 확보할 수 있습니다! 진행 중인 거래 히트맵 거래 히트맵은 달러 비용 평균화를 사용하여 거래의 확장 및 축소를 수행하는 포지션 거
Простая в управлении Торговая панель обеспечит безопасную торговлю. Вычислит объём сделки от заданного уровня Stop Loss и величины убытка. Поможет рассчитать сейф, и в ноль закрыть неверную сделку. Интуитивно понятный интерфейс делает панель удобной в управлении, освобождая внимание трейдера для принятия решения о входе в сделку. Программа сделает все расчёты за вас. Поэтому работа с помощью панели Снайпер - оптимальное решение для торговли с соблюдением Мани-менеджмента. А это главный ключ к по
Grid Manual MT4
Alfiya Fazylova
4.71 (17)
"Grid Manual"은 주문 그리드 작업을 위한 거래 패널입니다. 이 유틸리티는 보편적이며 유연한 설정과 직관적인 인터페이스를 제공합니다. 그것은 손실을 평균화하는 방향뿐만 아니라 이익을 증가시키는 방향으로 주문 그리드와 함께 작동합니다. 거래자는 주문 그리드를 만들고 유지할 필요가 없으며 유틸리티에서 수행합니다. 거래자가 주문을 시작하는 것으로 충분하며 "Grid Manual"는 자동으로 그를 위한 주문 그리드를 생성하고 거래가 마감될 때까지 그와 동행할 것입니다. 전체 설명 및 데모 버전 여기 . 유틸리티의 주요 기능: 모바일 터미널을 포함하여 어떤 방식으로든 열린 주문과 함께 작동합니다. "제한" 및 "중지"의 두 가지 유형의 그리드와 함께 작동합니다. 고정 및 동적(ATR 표시기 기반)의 두 가지 유형의 그리드 간격 계산과 함께 작동합니다. 오픈 오더 그리드의 설정을 변경할 수 있습니다. 차트에서 각 주문 그리드의 손익분기점 수준을 표시합니다. 각 주문 그리드에 대한 이익
Trader Evolution MT4
Siarhei Vashchylka
5 (2)
" Trader Evolution " - A utility designed for traders who use wave and technical analysis in their work. One tab of the utility is capable of money management and opening orders, and the other can help in making Elliott wave and technical analysis. Manual (Be sure to read before purchasing) | Version for MT5 Advantages 1. Trading in a few clicks. Immediate and pending orders are available in the panel 2. Money management. The program automatically selects the appropriate lot size 3. Simplifies
Auto Trade Copier
Vu Trung Kien
4.76 (85)
Auto Trade Copier is designed to copy trades to multiple MT4, MT5 and cTrader accounts/terminals with 100% accuracy. The provider and receiver accounts must be on the same PC/VPS. With this tool, you can copy trades to receiver accounts on the same PC/VPS. All trading actions will be copied from provider to receiver perfectly. This version can be used on MT4 accounts only. For MT5 accounts, you must use Auto Trade Copier for MT5 . Reference: - For MT4 receiver, please download Trade Receiver Fre
Close by percentage MT4
Konstantin Kulikov
5 (1)
Hello friends. I wrote this utility specifically for use in my profile with a large number of Expert Advisors and sets ("Joint_profiles_from_grid_sets" https://www.mql5.com/en/blogs/post/747929 ). Now, in order to limit losses on the account, there is no need to change the "Close_positions_at_percentage_of_loss" parameter on each chart. Just open one additional chart, attach this utility and set the desired percentage for closing all trades on the account. The utility has the following function
Drawdown Protector MT4
Konstantinos Kalaitzidis
5 (2)
하락 보호 장치는 원하는 최대 일일 하락폭을 관리하는 데 사용됩니다. 이는 거래자, 특히 소품 회사 거래자에게 매우 귀중한 도구이므로 하락 한도에 주의해야 합니다.    이는 자산 손실 관리 목적으로 사용하기 쉬운 효과적인 EA입니다. 이는 새로운 거래를 차단하고 기존 거래를 종료하는 방식으로 작동하며, 유동 자산(잔액 아님)이 귀하가 설정한 일일 손실 한도를 초과하는 경우. 또한 단일 거래에 대해 최대 손실 한도를 설정할 수 있습니다. 이 한도를 초과하면 다음 날까지 거래가 차단됩니다. 사용자는 3개의 매개변수 값을 삽입합니다. $ 단위의 일일 손실 한도:   명목 통화 단위의 최대 손실률(예제 목적으로 "$"를 사용함)   계정 잔액   에 대해 명목 가치로 허용되는 최대 감소액입니다   . 초과하는 경우 EA는 다음 날까지 거래를 차단합니다. $로 표시된 거래당 손실 한도:    명목 통화로 표시된 최대 손실(단지 예시 목적으로 "$"를 사용했습니다). 이는   단일 거래
X2 Copy MT4
Liubov' Shkandrii
빠르게. 정확하게. 혁신적으로. 기술 기반. 혁신적인 X2 Copy MT4로 즉각적인 거래 복사를 경험해 보세요. 단 10초의 간단한 설정만으로 단일 컴퓨터 또는 Windows VPS에서 MetaTrader 터미널 간의 거래를 전례 없는 속도로 동기화하는 강력한 도구를 얻을 수 있습니다. 여러 계정을 관리하든, 신호를 따라 거래하든, 전략을 확장하든, X2 Copy MT4는 비교할 수 없는 정밀도와 제어력으로 작업 흐름에 적응합니다. 가장 기술 중심적인 거래 복사 솔루션으로 더 빠르고 안정적으로 작업하세요. 무료 평가판을 사용해 보고 시스템에서 속도를 확인해 보십시오. *중요: MT5 터미널 작업에는 별도의 X2 Copy MT5 버전이 필요합니다 X2 Copy MT4/5 설정 및 기능 설명 | X2 Copy 체험판 설치 방법 주요 기능 고속 복사 — 0.1초 이내 거래 전송 모든 복사 유형에 대한 범용 지원: MT4>MT4, MT4>MT5, MT5>MT4, MT5>MT5 직관적인 인
Trendline PRO MT4 Trendline PRO MT4는 사용자가 만든 추세선과 차트 레벨을 기반으로 거래를 실행하고 주문을 관리하거나 알림을 보내는 MetaTrader 4용 반자동 Expert Advisor입니다. 이 Expert Advisor는 거래 신호를 생성하지 않으며 내장 거래 전략을 포함하지 않습니다. 모든 진입, 청산, 리스크 설정, 관리 규칙은 사용자가 차트에서 정의합니다. 이 제품은 자체 분석에서 추세선, 돌파 레벨, 지지와 저항, 채널 또는 계획된 가격 구역을 이미 사용하는 트레이더를 위해 설계되었습니다. 기존 Trendline EA MT4와 비교해 PRO 버전은 시각적 차트 패널, 인터랙티브 TP 및 SL 구역, OCO 진입 쌍, 라인별 로트 크기, 자동 breakeven, trailing stop, 차트 저장 유지, 개선된 MT4 주문 기반 거래 관리를 추가합니다. 추가 자료 사용자 가이드 및 문서 기능 개요 시각적 거래 계획 차트 패널에서 진입, 돌파
제작자의 제품 더 보기
This is an interactive and easy-to-set indicator which allows to form seven equally spaced channels which have your settings simultaneously. All seven channels are enabled by default. But you can easily enable one or another channel using control buttons located in the upper case of the indicator's control panel. You can change a period of the indicator calculation by clicking one of buttons indicating number of the channel in the lower case of the control panel. Two other buttons (one of them i
This EA represents an interactive panel with adjustable parameters destined for installation and deletion of pending orders (orders grid generator). You can place the panel anywhere on the screen or hide it into a dot clicking on the button in the upper left part of the chart (it will be shown after clicking on it for the second time). Number and step of orders, lot size, vertical shift for limit orders - all these things make your work easier. There are functions for restoring according to pend
Equidistant channel
Valeriy Medvedev
The purpose of the indicator is drawing an equidistant channel. It is somewhat different from the traditional model. The choice of control parameters is simple and does not require any special description. Enter the calculation interval in hours and the solution to the problem will appear on the screen. Please note that the time involved in calculation of the channel must be greater than the timeframe it will be displayed on. If the parameters you enter are beyond the allowable limits, you will
This indicator is designed for drawing equidistant channels. Two options are available: based on the number of hours in the indicator calculation and by the number of bars. To draw a channel, enter a number 1 or greater. The maximum value is limited by the amount of visible bars. If the parameters you enter are beyond the allowable limits, you will get notified if the indicator restrictions. Please note that the time involved in calculation of the channel must be greater than the timeframe it wi
ZigZag on average
Valeriy Medvedev
This is a well-known ZigZag indicator. But it differs by the fact that its plot is based on values of the middle line which is set by a user. It can display Andrews’ Pitchfork and standard or Bobokus Fibo levels. NO REPAINTING. Parameters Period МА — middle line period. Default value is 34. Minimum value is 4. Maximum value is set at your discretion. Used to calculate price - base price to calculate the middle line. The averaging method - method of smoothing the middle line. Turning pitchfork —
The indicator displays the moving average of all periods on one chart. It shows the MA of a one step lower timeframe and all the MAs equal to and higher than it. Parameters Period moving average - Moving Average period (default is 34); Used to calculate price - price used for the MA calculation (default is the average price = (high+low)/2); The averaging method - default is linear-weighted; Moving average shift - MA shift (default is 0). Just enter the MA calculation period and its parameters,
Desk Analytical Table Portfolio Monitoring for Active Traders Overview: The Desk Analytical Table indicator is a professional tool designed for traders managing multiple financial instruments simultaneously. It consolidates key data on open positions, orders, and market statistics into a single window, ensuring seamless portfolio control even during high-intensity trading sessions. Key Features: ️ Multi-Instrument Analysis - Monitor up to 30 assets in real time with quick switching between inst
This is a prototype of the famous Control and management of transactions panel. There are two main differences: Allows to work with all the variety of financial instruments opened by a user and not only with instruments it was attached to; To activate levels of order closure hidden from a broker, it uses not lines but modifiable virtual levels. To enjoy the full functionality of the panel you are advised to have: Desk analytical table . Their combined operation allows to keep the situation under
It is widely known that colors affect the emotional state of a human, especially if this human is a trader. Psychologists recommend that you follow your instincts and select the color of your environment that is most comfortable to you. In order to reduce emotional stress, impact of colors on a person should be considered. The optimal range of the most beneficial colors includes green, yellow-green and green-blue ones. This indicator allows you to manage your emotional state and health. Choose a
FREE
The indicator is based on the two-buffer scheme and does not require any additional settings. It can be used on any financial instrument without any restrictions. The indicator is a known ZigZag, but it does not redraw . The indicator allows to easily detect significant levels on the price chart, as well as demonstrates the ability to determine the probable direction of a price movement. The calculations are based on the candles' Close prices, thus improving the reliability of the levels. Param
The idea of the indicator stems from the necessity to clearly define the borders of support and resistance levels, which helps to plan the opening and closing of positions in the areas that most appropriately determine the process. Look at the breakdowns of the resistance level that confirm the intention of the price to continue the upward movement, after it passed the support level and entered the channel formed by the two levels. The same is for the case when the price enters the channel downw
This indicator is a logical extension of the product at https://www.mql5.com/en/market/product/12526 . The only difference is that price movement is displayed using a histogram with levels, allowing to assess the direction and strength of the movement. How to interpret the signal: 0 - the middle of the channel; above 0.5 - the breakdown of the channel up; below -0.5 - the breakdown of the channel down. Both indicators are displayed in the attached screenshots. Install the indicator and you will
Simple Line
Valeriy Medvedev
The indicator shows the levels of the past week and day. In addition, it draws a level in percentage. This level is specified relative to the difference between the High and Low of the past month and week. For the daily levels of the past day, the Close levels are additionally displayed. All you need to do is configure the display parameters of the levels to your liking. Parameters Over the past months installations - settings for the last months; PasteMonthsLines - the level display mode is on
This indicator is the logical continuation of the well-known equidistant channel indicator: https://www.mql5.com/en/market/product/8723 . The main purpose of the indicator is the visualization of price levels relative to the parallel channel using Fibo Bobokus levels in a separate window and the price history. This often allows forecasting the future price movement with a sufficiently high degree of probability. The Fibo levels calculation equation is as follows: FiboLevel = (50-(100*((Close[i]-
This simple to use utility allows opening charts from the list of financial instruments by left clicking their names. The chart window is opened using the Default template. The template name can be changed to one of those stored in Charts-Templates section of the terminal. It is possible to customize the background colors of panels and their labels, and also to select the display type for a more comfortable working environment. This is all you need to know in order to see the result quickly. Pa
If you need to quickly evaluate the results of trading on a current financial instrument by hypothetical price movement in the chosen direction and up to a certain level, set the indicator on any chart that contains open positions and move the line to the desired level after it appears together with the results tab. This is all you need to understand what happens to your deposit if the price is at this level without taking into account existing stop loss and take profit. Enable considering pendi
This is an individual tool for analyzing the market situation. It is very simple to use. After attaching the indicator to the chart, you will see three vertical lines named "VLine 1", "VLine 2" and "VLine 3", following in this order from left to right. For the utility to operate correctly, this sequence should always be observed. Please note: at the first start, the lines are not bound to specific price levels on the chart. This should be done by user in accordance with the following rule: if li
This indicator displays a set of moving average lines across all higher timeframes. The indicator can be installed on any financial instrument and any timeframe. For the analysis of the lines, a panel with timeframe values is provided in the lower right corner. Using the panel, you can easily enable/disable the display of the MA line of any higher timeframe. This allows a more thorough analysis of the market situation. The color of the button matches the color of the moving average line. Parame
This indicator is designed for monitoring RSI levels on the current and higher timeframes. The control panel is user friendly and consists of buttons, with which you can control the display of lines as per the names of the buttons. The button color matches the line color. Parameters "___| Settings of the main indicator " RSI Period - averaging period for index calculation (default is 14); RSI Price type - price used for calculations (default is the Close price); "___| Color palette " Text color
Этот индикатор предназначен для контроля уровней CCI на текущем и старших от него таймфреймах. Панель управления проста в понимании и состоит из кнопок, с помощью которых можно управлять отображением линий, соответствующим указанным на наименовании кнопок. Цвет кнопки совпадает с цветом линии. Этот индикатор из серии подобных индикаторов, которые уже успели завоевать популярность: https://www.mql5.com/ru/market/product/30276 и https://www.mql5.com/ru/market/product/30403 Параметры "___| Setti
This is a well-known ZigZag indicator. But it differs by the fact that its plot is based on values of the middle line which is set by a user. It can display Andrews’ Pitchfork and standard or Bobokus Fibo levels. NO REPAINTING. Parameters Period МА — middle line period. Default value is 34. Minimum value is 4. Maximum value is set at your discretion. Used to calculate price — type of price used for the midline calculations. The averaging method — type of smoothing for the middle line. Turning p
The indicator is similar to https://www.mql5.com/en/market/product/12330 . However, it considers the MQL5 platform features. Peaks and bottoms are calculated based solely on external bars. After a swing is formed, the indicator does not redraw providing opportunities for traders working on horizontal level breakthroughs. Traffic can be reduced by changing the amount of calculated bars in the MinBars variable (default value is 500). All you need is to select the output options, so that you can se
The indicator is based on the two-buffer scheme and does not require any additional settings. It can be used on any financial instrument without any restrictions. The indicator is a known ZigZag, but it does not redraw . The indicator allows to easily detect significant levels on the price chart, as well as demonstrates the ability to determine the probable direction of a price movement. The calculations are based on the candles' Close prices, thus improving the reliability of the levels. Param
It is an analogue of the indicator of levels at https://www.mql5.com/en/market/product/24273 for the MetaTrader 5 platform. The indicator shows the levels of the past month, week and day. In addition, it draws a level in percentage relative to the difference between the High and Low of the past month and week. For the daily levels of the past day, the Close levels are additionally displayed. All you need to do is to configure the display parameters of the levels to your liking. In some cases, af
필터:
Marco
560
Marco 2019.07.10 01:54 
 

사용자가 평가에 대한 코멘트를 남기지 않았습니다

620500
21
620500 2015.11.27 11:21 
 

这信号怎么设置 刚开始测试的时候用的好好的 后来买了正版就不能运作了 求大神帮忙

리뷰 답변