CDV Swing Levels

5
Cumulative Delta Volume (CDV) Swing Level - Absorption & Exhaustion Detector

📖 Full Documentation: [Download PDF]
📖 CDV Swing Aggressive Score Guide: [Download PDF]
🎓 Free Professional Education Course: After purchasing, contact me to receive access to the complete CDV Professional Training Video Course.

Professional CDV Analysis for Market Reversals

This indicator identifies CDV absorption and exhaustion patterns to detect precise market turning points. It analyzes cumulative delta volume flow to reveal when smart money accumulates (absorption) or distributes (exhaustion) before major price reversals.

Core CDV Functionality

CDV Absorption Detection: Identifies zones where cumulative delta volume accumulates while price remains stable or declines. These areas show institutional buying pressure building before upward moves.

CDV Exhaustion Detection: Locates points where cumulative delta volume weakens while price continues rising. These signals indicate selling pressure building before downward reversals.
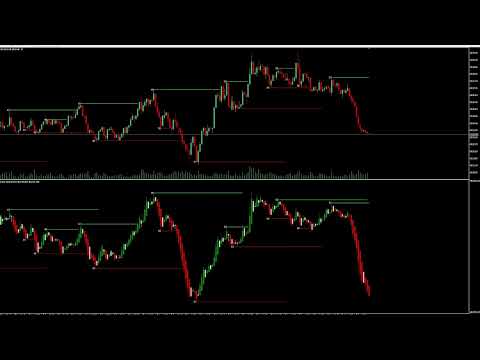
Visual CDV Signals

  • Green/Red Candles: Normal CDV flow direction
  • Light Green Candles: CDV absorption - Bullish divergence (CDV rising, price falling)
  • Light Pink Candles: CDV exhaustion - Bearish divergence (CDV falling, price rising)
  • Swing Lines: Automatic support/resistance levels from CDV analysis

CDV Trading Strategy

Long Entry (CDV Absorption):

  1. Monitor for CDV accumulation pattern
  2. Wait for light green candle confirmation
  3. Enter when CDV shows absorption while price weakness

Short Entry (CDV Exhaustion):

  1. Identify CDV distribution pattern
  2. Wait for light pink candle confirmation
  3. Enter when CDV shows exhaustion during price strength

Exit Strategy: Close positions when normal green/red candles return, indicating CDV absorption or exhaustion phase completed.

Key CDV Features

  • Real-time CDV absorption and exhaustion detection
  • Zero repainting CDV calculations
  • Multi-timeframe CDV compatibility
  • Automatic CDV divergence alerts
  • Professional CDV swing analysis

Technical Specifications

Platform: MetaTrader 5 (Build 3950+) Timeframes: All (M1 to MN1) Markets: Forex, Stocks, Indices, Commodities Type: Custom CDV Indicator (.ex5)

Trading Applications

Day Trading: Intraday CDV reversals Swing Trading: Multi-day CDV turning points Scalping: Precise CDV entry/exit timing Volume Analysis: Professional CDV market analysis

Included CDV Resources

CDV Enhanced Trading Strategy PDF: Complete CDV absorption and exhaustion trading methodology with institutional techniques and professional trading tricks.

CDV Documentation Package:

  • Full CDV strategy framework
  • Advanced CDV analysis techniques
  • CDV-specific optimal settings
  • Professional CDV setup templates
  • CDV trading tricks and tips

This indicator provides professional CDV analysis capabilities for identifying market absorption and exhaustion patterns that precede significant price movements

レビュー 4
mikee11
50
mikee11 2026.04.27 17:07 
 

it is an amazing indicator, gives a very good picture how the market is moving..

Francesco Pierini
197
Francesco Pierini 2025.11.20 18:33 
 

This indicator is EXACTLY what I needed. I've been using it for a while on Trading View, but having it directly on MT5 is fantastic🤩 Plus, you can see the divergences graphically... that's all I need. Many thanks to the developer who quickly clarified some of my questions about the functions👏🏻👏🏻

Eka Aristanto
24
Eka Aristanto 2025.10.06 09:23 
 

This indicator is excellent and has been very helpful in my trading. It provides a broader perspective on volume analysis. Although volume in spot/CFD forex trading is generally not as accurate as in futures trading, this indicator is extremely helpful. It's also easy to identify divergences. Optional combination for who use this tool more accurate, you can add Multi stochastic or Multi MFI ( combine between short period and medium period ). The seller also very helpful, great job by the way. Very Recommended!!!.

おすすめのプロダクト
Easy Correlations Indicator The Easy Correlations Indicator is designed to help traders analyze the relationship between two correlated instruments. By monitoring the distance between their Relative Strength Index (RSI) values, the indicator highlights situations where one instrument has moved significantly further than the other. This creates potential trading opportunities: Sell the stronger instrument (overstretched RSI) Buy the weaker instrument (lagging RSI) Because the positions are opened
FREE
概要 このインジケーターは、クラシックな ドンチャンチャネル を強化したバージョンで、実践的なトレード機能を追加しています。 標準の3本線(上限、下限、中央線)に加え、 ブレイクアウト を検出し、チャート上に矢印で視覚的に表示します。また、チャートを見やすくするために、 現在のトレンド方向と逆側のラインのみを表示 します。 インジケーターの機能: 視覚的シグナル :ブレイクアウト時にカラフルな矢印を表示 自動通知 :ポップアップ、プッシュ通知、Eメール RSIフィルター :市場の相対的な強弱に基づいてシグナルを検証 カスタマイズ可能 :色、ラインの太さ、矢印コード、RSI閾値など 動作原理 ドンチャンチャネルは次のように計算します: 上限線 :直近N本のクローズ済みローソク足の最高値 下限線 :直近N本のクローズ済みローソク足の最安値 中央線 :最高値と最安値の平均値 上方ブレイクアウト は終値が上限線を超えたときに発生し、 下方ブレイクアウト は終値が下限線を下回ったときに発生します。 インジケーターは以下を行います: 3本のドンチャンラインを描画 方向転換後の最初のブレイクアウト
FREE
FlatBreakout MT5 (Free Version) Flat Range Detector and Breakout Panel for MT5 — GBPUSD Only FlatBreakout MT5   is the free version of the professional FlatBreakoutPro MT5 indicator, specially designed for flat (range) detection and breakout signals on the   GBPUSD   pair only. Perfect for traders who want to experience the unique fractal logic of FlatBreakout MT5 and test breakout signals on a live market without limitations. Who Is This Product For? For traders who prefer to trade breakout of
FREE
Important Lines
Terence Gronowski
4.88 (24)
This indicator displays Pivot-Lines, preday high and low, preday close and the minimum and maximum of the previous hour. You just have to put this single indicator to the chart to have all these important lines, no need to setup many single indicators. Why certain lines are important Preday high and low : These are watched by traders who trade in a daily chart. Very often, if price climbs over or falls under a preday low/high there is an acceleration in buying/selling. It is a breakout out of a
FREE
PROMETHEUS TECHNICAN VERSION Free | By THE SONS A gift from The Sons — no strings, no trial, no expiry. Every trader deserves access to professional-grade market intelligence. That belief is why Prometheus Technical Version exists, and why it costs nothing. Consider it our handshake to the trading community. What You're Getting This is not a simplified tool dressed up as a gift. Prometheus Technican Version is a fully built, institutional-quality technical analysis indicator running a dual-model
FREE
Norion Daily Key Levels is a professional indicator designed to display the most relevant price reference levels of the trading day in a clear and objective way. The indicator automatically plots essential daily levels such as: Previous day close Current day open Daily high Daily low In addition, the indicator allows the inclusion of other custom daily reference levels, making it adaptable to different trading styles and market strategies. These levels are widely used by professional traders as
FREE
The Penta-O is a 6-point retracement harmonacci pattern which usually precedes big market movements. Penta-O patterns can expand and repaint quite a bit. To make things easier this indicator implements a twist: it waits for a donchian breakout in the right direction before signaling the trade. The end result is an otherwise repainting indicator with a very reliable trading signal. The donchian breakout period is entered as an input. [ Installation Guide | Update Guide | Troubleshooting | FAQ | A
FREE
ピボットポイントフィボRSJは、フィボナッチレートを使用してその日のサポートラインとレジスタンスラインを追跡するインジケーターです。 この壮大な指標は、フィボナッチレートを使用してピボットポイントを通じて最大7レベルのサポートとレジスタンスを作成します。 価格がこのサポートとレジスタンスの各レベルを尊重する方法は素晴らしいです。そこでは、オペレーションの可能な入口/出口ポイントを認識することができます。 特徴 最大7レベルのサポートと7レベルの抵抗 レベルの色を個別に設定します 入力 ピボットタイプ ピボットフィボRSJ1 =フィボ比1の計算 ピボットフィボRSJ2 =フィボ比2の計算 ピボットフィボRSJ3 =フィボ比3の計算 ピボットフィボクラシック=クラシックピボット計算 最小ピボットレベル ピボット3レベル ピボット4レベル ピボット5レベル ピボット6レベル ピボット7レベル それでも質問がある場合は、ダイレクトメッセージで私に連絡してください: https://www.mql5.com/ja/users/robsjunqueira/
FREE
Free automatic Fibonacci is an indicator that automatically plots a Fibonacci retracement based on the number of bars you select on the BarsToScan setting in the indicator. The Fibonacci is automatically updated in real time as new highest and lowest values appears amongst the selected bars. You can select which level values to be displayed in the indicator settings. You can also select the color of the levels thus enabling the trader to be able to attach the indicator several times with differe
FREE
DF Fib Trader Pro DF Fib Trader Proは、MetaTrader 5向けに設計された自動取引システムです。 フィボナッチベースの価格水準とトレンドおよびストラクチャー分析を組み合わせ、エントリーポイントとエグジットポイントを決定します。このEAはロングポジションとショートポジションの両方をサポートし、リスク管理パラメータも組み込まれています。 主な機能: • フィボナッチ・リトレースメントとエクステンション・ロジックを用いて、エントリーポイント、SLポイント、TPポイントをプロットします。 • ロットサイズと損切り/利益確定レベルを設定可能 • エントリーポイントは1つまたは2つから選択可能 • 市場状況に応じて、固定または動的な損切り/利益確定をサポート • 複数の時間枠と通貨ペアに対応 • 最大スプレッド、スリッページ、取引頻度の制御オプションを搭載 • 自動取引管理:損益分岐点、トレーリングストップ、部分決済オプション • 希望に応じて成行注文もサポート入力項目の概要: • リスク管理:ロットサイズ、取引ごとのリスク、最大取引回数 • エントリー
FREE
The Mirror Chart MT5 is a overlay indicator specifically designed to project a second financial instrument directly onto the main chart window. This tool is invaluable for traders who rely on correlation analysis, as it visualizes the price movements of two different instruments in real time. Unlike traditional overlays, this indicator utilizes intelligent, dynamic centering and scaling logic. It continuously analyzes the visible price range in the current window for both symbols and calculates
FREE
ZigZagサポート&レジスタンスレベル  は、MetaTrader 5用のインジケーターで、ZigZagのピボットポイントに基づいてサポートおよびレジスタンスレベルを特定します。また、クラスタリング手法を使用して近接レベルをゾーンにまとめ、価格が複数回反応したエリアを視覚化するのに役立ちます。 主な機能 1. ZigZagピボットの検出 設定可能なパラメータ Depth、Deviation、Backstep を使用してスイング高値と安値を検出します。 2. サポートおよびレジスタンスレベルの検出 低いピボットから サポートレベル 、高いピボットから レジスタンスレベル を作成します。 レベルは先に延長され、価格が突破するまでアクティブなままです。 アクティブ(オープン) および ブロークン(クローズド) レベルの両方をサポートします。 3. クラスタ検出とゾーンの可視化 設定可能な距離閾値に基づき、近接するレベルをゾーンにグループ化します。 小さなグループをフィルタリングするために、最小クラスタサイズを設定できます。 クラスタ表示に平均価格またはゾーン境界を使用するオプションがあり
FREE
MT4 Version Most indicators draw lines. This one draws the battlefield. If you ever bought an EA or indicator based on a perfect equity curve — and then watched it bleed out live — you’re not alone. The problem? Static logic in a dynamic market. Fibonacci Bollinger Bands   adapts. It combines Bollinger structure with customizable Fibonacci levels to mark   zones of control   — where price reacts, pauses, or reverses. No magic. Just logic that follows volatility. Why this tool matters   It
FREE
Statistical Arbitrage Spread Generator for Cointegration [MT5] What is Pair Trading? Pair trading is a market-neutral strategy that looks to exploit the relative price movement between two correlated assets — instead of betting on the direction of the market. The idea? When two assets that usually move together diverge beyond a statistically significant threshold, one is likely mispriced. You sell the expensive one, buy the cheap one , and profit when they converge again. It’s a statistica
FREE
This indicator displays pivot points in the chart, including historical vales, and supports many calculation modes for Pivot Points and S/R levels. [ Installation Guide | Update Guide | Troubleshooting | FAQ | All Products  |  Get Help ] It plots historical levels for backtesting purposes It allows you to select the reference timeframe It implements different Pivot Point calculation modes It implements different SR calculation modes It implements customizable colors and sizes Calculation Mod
FREE
Daily Support and Resistance Levels は、クラシックピボットポイント手法に基づき、日中取引用の重要な価格レベルを自動計算・表示するプロ仕様のインジケーターです。 主な機能: ピボットポイント(PP)の自動計算 3つのレジスタンスレベル(R1, R2, R3) 3つのサポートレベル(S1, S2, S3) 前日の高値/安値の表示 リアルタイム情報パネル 市場バイアス(強気/弱気)表示 近いレベルまでの距離表示 色と表示設定の完全カスタマイズ 毎日自動更新 全タイムフレーム対応 計算方法: 前日の高値、安値、終値に基づくクラシックピボットポイント。 トレード活用例: サポート/レジスタンス反発トレード ブレイクアウト戦略 レンジトレード 方向性バイアス判断 利確目標設定 使用方法: 任意のチャートに追加 レベルは自動計算 価格 > PP = 強気バイアス 価格 < PP = 弱気バイアス S1-S3 = サポートゾーン R1-R3 = レジスタンスゾーン 設定: ピボット/サポート/レジスタンス色 線幅/スタイル 価格ラベル表示ON/OFF 情報パネル表示
FREE
マルチタイムフレーム対応、カスタマイズ可能なビジュアルシグナル、設定可能なアラートシステムを備えたAverage True Range(ATR)インジケーター。 フリーランスプログラミングサービス、アップデート、その他のTrueTL製品は私の MQL5プロフィール でご覧いただけます。 フィードバックとレビューを大変お待ちしております! ATRとは? Average True Range(ATR)は、J. Welles Wilderが開発した市場のボラティリティを測定するテクニカルインジケーターです。指定した期間のTrue Rangeの平均を計算します。True Rangeは以下の中で最大の値です:現在の高値から現在の安値までの距離、前回の終値から現在の高値までの距離、または前回の終値から現在の安値までの距離。 ATRは価格方向を示しません — ボラティリティのみを測定します。ATRが上昇するとボラティリティの増加を示し、ATRが低下するとボラティリティの減少を示します。トレーダーはATRを使用して市場状況を評価し、動的なストップロスを設定し(例:ATRベースのトレーリングストッ
FREE
Little useful tool - you manually select range on chart by dragging vertical blue lines and indicator shows support and resistance zones for this range and extends them outside of selected range.  Useful for: * Range trading * Range breakout * Range breakout & retest * Good entry during pullback in trend phase when previous high is retested * Good for scalping on short timeframes * Good for trades on longer timeframes around selected important zones like daily high or low
FREE
BKT Pro Tooco MetaTrader 5向けのマルチメソッド・サポート&レジスタンスツールキット。4種類の検出アルゴリズムを選択してスイングレベルをリアルタイムに検出し、確定済みシグナルは再描画しません。 BKT Pro Tooco は MetaTrader 5 向けのサポート&レジスタンス指標で、複数の市場構造において信頼性の高いゾーン検出を必要とするトレーダーのために設計されています。4種類の独立した検出メソッドを提供しており、トレーダーは自身のトレードスタイルに合わせてアルゴリズムを選択できます。ピボットベースの構造分析、ドンチャンチャネルの反転、連続ローソク足のシーケンス、またはZigZagスイング識別から選択可能です。すべての確定ゾーンは確定済みバーから算出され、再描画は行いません。   概要 この指標は過去の価格動向と現在のバーをスキャンして、重要なスイング高値・安値を特定します。スイングポイントが識別されると、ATRベースの深度計算を使用してサポートまたはレジスタンスゾーンが構築されます。ゾーンの幅は2つのパラメーターで決まります。1つはゾーン本体用、もう1つ
FREE
Enhanced Volume Profile: The Ultimate Order Flow & Liquidity Analysis Tool Overview Enhanced Volume Profile is an indicator for MetaTrader 5 that displays the traded volume at specific price levels over a defined period. It separates the total volume into buy and sell components, presenting them as a side-by-side histogram on the chart. This allows users to observe the volume distribution and the proportion of buy and sell volumes at each price level. Graphics Rendering The indicator uses the
FREE
価格波形パターン MT5へようこそ --(ABCD パターン)-- ABCD パターンは、テクニカル分析の世界で強力で広く使用されている取引パターンです。 これは、トレーダーが市場での潜在的な売買機会を特定するために使用する調和的な価格パターンです。 ABCD パターンを使用すると、トレーダーは潜在的な価格変動を予測し、いつ取引を開始および終了するかについて十分な情報に基づいた決定を下すことができます。 EA バージョン:     Price Wave   EA MT5 MT4バージョン:   Price Wave Pattern MT4 特徴 :  ABCDパターンの自動検出。 強気パターンと弱気パターン。  任意のシンボルと任意の時間枠で機能します。 主要なレベルと価格目標。 カスタマイズ可能な設定と繊維レベルの調整。 アラートと通知。 今後  さらに多くの 機能が追加される  予定です 。
FREE
Day Trader WorkTime
Aurthur Musendame
4.75 (16)
The worktime indicator helps you identify the most important times to day to trade the currency pairs. It was created based on the ICT day trading free tutorials that are freely vailable on his youtube channel.  You can use this indicator together with my other indicators that i have shared freely with you like the true day, custom periods, daily month, weekly open lines - they together complement each other very well. Nuggets from this indicator: 1. Draws the asian session box showinng you the
FREE
Follow The Line MT5
Oliver Gideon Amofa Appiah
4.6 (35)
This indicator obeys the popular maxim that: "THE TREND IS YOUR FRIEND" It paints a GREEN line for BUY and also paints a RED line for SELL. (you can change the colors). It gives alarms and alerts of all kinds. IT DOES NOT REPAINT and can be used for all currency pairs and timeframes. Yes, as easy and simple as that. Even a newbie can use it to make great and reliable trades. NB: For best results, get my other premium indicators for more powerful and reliable signals. Get them here: https://www.m
FREE
Strifor Pivot ATR Target MetaTrader 5用 ATRターゲット付きピボットレベル指標と分析パネル Strifor Pivot ATR Target は、日中および中期トレード向けのツールで、クラシックピボットと動的ATRターゲット、拡張分析パネルを統合しています。指標は、取引レンジ、価格反応の可能性ゾーン、価格の動きの潜在力を事前に評価し、手作業の計算や主観的な判断を排除します。 主な機能 ピボットレベルの自動描画(PP, R1–R3, S1–S3) 平均ボラティリティに基づくATRターゲットの計算 上昇・下降別ターゲット(ATR Long / ATR Short) 情報パネル表示: 現在のATR値 日内レンジ進行率 残りの潜在力 高値/安値からの動きの評価 前日のデータを考慮可能 ラインとパネルの表示設定が柔軟 全種類の金融商品に対応:指数、通貨、商品、暗号資産 MT5完全対応(ヘッジ・ネット取引) 動作ロジック 前日のデータを基にピボットを描画し、ATR(14)に基づくターゲットレベルを設定。 ATRターゲットは統計的に予測される日内レンジを示し
FREE
「Haven Key Levels PDH PDL」   インジケーターは、トレーダーがチャート上の主要なレベルを視覚化するのに役立ちます。次のレベルを自動的にマークします: DO (Daily Open)   — 日足の始値。 NYM (New York Midnight)   — ニューヨーク時間の深夜0時のレベル。 PDH (Previous Day High)   — 前日の高値。 PDL (Previous Day Low)   — 前日の安値。 WO (Weekly Open)   — 週足の始値。 MO (Monthly Open)   — 月足の始値。 PWH (Previous Week High)   — 前週の高値。 PWL (Previous Week Low)   — 前週の安値。 CMH (Current Month High)   — 当月の高値。 CML (Current Month Low)   — 当月の安値。 PMH (Previous Month High)   — 前月の高値。 PML (Previous Month Low)   — 前月の
FREE
This is a buyer and seller aggression indicator that analyzes the shape of each candle and project this data in a histogram form. There are 4 histograms in one. On the front we have two: Upper - Buyer force. Lower - Seller force. At the background we also have two histogram, both with same color. They measure the combined strenght of buyers and sellers. This histograms can be turned off in Input Parameters. It is also possible to have the real or tick volume to help on this force measurement. IN
FREE
Donchian Channel is an indicator created by Richard Donchian. It is formed by taking the highest high and the lowest low of the last specified period in candles. The area between high and low is the channel for the chosen period. Its configuration is simple. It is possible to have the average between the upper and lower lines, plus you have alerts when price hits one side. If you have any questions or find any bugs, please contact me. Enjoy!
FREE
Bounce Zone MT5
Nguyen Thanh Cong
4.56 (9)
Introduction The Bounce Zone indicator is a cutting-edge non-repainting technical tool built to identify key areas on the price chart where market sentiment is likely to cause a significant price reversal. Using advanced algorithms and historical price data analysis, this indicator pinpoints potential bounce zones. Combined with other entry signal, this indicator can help forex traders place the best trades possible Signal A possible buy signal is generated when price is in the green zone an
FREE
Market Profile 3 ForexArby com
Hussien Abdeltwab Hussien Ryad
4 (15)
Market Profile 3 MetaTrader 5 indicator  version 4.70— is a classic Market Profile implementation that can show the price density over time, outlining the most important price levels, value area, and control value of a given trading session. This indicator can be attached to timeframes between M1 and D1 and will show the Market Profile for daily, weekly, monthly, or even intraday sessions. Lower timeframes offer higher precision. Higher timeframes are recommended for better visibility. It is als
FREE
マルチタイムフレーム対応、カスタマイズ可能なビジュアルシグナル、設定可能なアラートシステムを備えたBalance of Power(BOP)インジケーター。 フリーランスプログラミングサービス、アップデート、その他のTrueTL製品は私の MQL5プロフィール からご利用いただけます。 フィードバックとレビューを大歓迎します! BOPとは? Balance of Power(BOP)は、価格の変化をバーの値幅と比較することで、買い手と売り手の強さを測定するオシレーターです。インジケーターは(終値 - 始値)/(高値 - 安値)として計算され、その後Simple Moving Average(SMA)で平滑化されます。 BOP値は-1から+1の間で変動します。正の値は買い手が強いことを示し(終値が始値より高い)、負の値は売り手が強いことを示します(終値が始値より低い)。値の大きさは動きの強さを示します。BOPは買い圧力と売り圧力のバランスを示すことで、市場の強さと潜在的な反転を識別するのに役立ちます。 特徴: 矢印と垂直線によるビジュアルシグナルマーカー 設定可能なトリガーを持つ3
FREE
このプロダクトを購入した人は以下も購入しています
ARIPoint is a powerful trading companion designed to generate high-probability entry signals with dynamic TP/SL/DP levels based on volatility. Built-in performance tracking shows win/loss stats, PP1/PP2 hits, and success rates all updated live. Key Features: Buy/Sell signals with adaptive volatility bands Real-time TP/SL/DP levels based on ATR Built-in MA Filter with optional ATR/StdDev volatility Performance stats panel (Success, Profit/Loss, PP1/PP2) Alerts via popup, sound, push, or email Cu
このインジケーターを購入された方には、以下の特典を 無料 で提供しています: 各トレードを自動で管理し、ストップロスとテイクプロフィットを設定し、戦略ルールに基づいてポジションを決済する補助ツール 「Bomber Utility」 様々な銘柄に合わせたインジケーターの設定ファイル(セットファイル) 「最小リスク」、「バランスリスク」、「待機戦略」 の3つのモードで使用できる Bomber Utility 用の設定ファイル このトレーディング戦略をすぐに導入・設定・開始できる ステップバイステップのビデオマニュアル ご注意: 上記の特典を受け取るには、MQL5のプライベートメッセージシステムを通じて販売者にご連絡ください。 オリジナルのカスタムインジケーター 「Divergence Bomber(ダイバージェンス・ボンバー)」 をご紹介します。これは、MACDのダイバージェンス(乖離)戦略に基づいた 「オールインワン」型のトレーディングシステム です。 このテクニカルインジケーターの主な目的は、価格とMACDインジケーターの間に発生するダイバージェンスを検出 し、将来の価格の動きを示す
Power Candles V3 - 自己最適化型強弱インジケーター Power Candles V3は 、通貨や銘柄の強さを、適用されたすべてのチャート上で実行可能なトレードプランに変換します。単にローソク足を色分けするだけでなく、バックグラウンドでリアルタイムの自動最適化を実行し、目の前の銘柄に対して最適なストップロス、テイクプロフィット、およびシグナルの閾値を提示します。ワンクリックで実取引に適用でき、エントリーポイント、ストップロス、テイクプロフィットのラインが正確な価格位置にチャート上に表示され、方向性を示すアラートがリアルタイムで発動します。 このツールは、Stein Investmentsのエコシステムの一部です。  18種類以上のツールをすべて閲覧し、AIを活用したセットアップの推奨事項を入手し、  https://stein.investments でコミュニティに参加しましょう クローズしたバーごとに3,000回以上のトレードシミュレーション。9つの強さの状態。2つの戦略を並行してテスト。勝率の高い設定をワンクリックで適用。 なぜこれが必要なのか ほとんどの強
SignalTech MT5 is a fully rule based trading system for EURUSD, USDCHF, USDJPY, AUDUSD, NZDUSD, EURJPY, AUDJPY, NZDJPY, CADJPY.  All the winning trades with chart setups are published on the comments page. 2025-12 1174 Pips 2026-01 2624 Pips 2026-02 2937 Pips 2026-03 2165 Pips 2026-04 2243 Pips It can generate signals with Buy/Sell Arrows and Pop-Up/Sound Alerts. Each signal has clear Entry and Stop Loss levels, which should be automatically flagged on the chart, as well as potential Targets 1,
ご紹介     Quantum Breakout PRO は 、ブレイクアウト ゾーンの取引方法を変革する画期的な MQL5 インジケーターです。 13年以上の取引経験を持つ経験豊富なトレーダーのチームによって開発されました。     クォンタム ブレイクアウト プロ   は、革新的でダイナミックなブレイクアウト ゾーン戦略により、あなたのトレーディングの旅を新たな高みに押し上げるように設計されています。 クォンタム ブレイクアウト インジケーターは、5 つの利益ターゲット ゾーンを備えたブレイクアウト ゾーン上のシグナル矢印と、ブレイクアウト ボックスに基づいたストップロスの提案を提供します。 初心者トレーダーにもプロのトレーダーにも適しています。 量子EAチャネル:       ここをクリック 重要!購入後、インストールマニュアルを受け取るためにプライベートメッセージを送ってください。 推奨事項: 時間枠: M15 通貨ペア: GBPJPY、EURJPY、USDJPY、NZDUSD、XAUUSD アカウントの種類: ECN、Raw、またはスプレッドが非常に低い R
このインジケーターを購入すると、プロ仕様のトレードマネージャーを無料で差し上げます。 まず第一に、このトレーディングシステムがノンリペイント、ノンリドロー、ノンラグのインジケーターであることを強調する価値がある。これにより、手動取引とロボット取引の両方に理想的なものになっています。 オンラインコース、マニュアル、プリセットのダウンロード。 「スマートトレンドトレーディングシステム MT5」は、新規および経験豊富なトレーダー向けにカスタマイズされた包括的なトレーディングソリューションです。10以上のプレミアムインジケーターを組み合わせ、7つ以上の堅実なトレーディング戦略を備えており、多様な市場状況に対応する多目的な選択肢となっています。 トレンドフォロー戦略:トレンドを効果的に乗り越えるための正確なエントリーとストップロス管理を提供します。 リバーサル戦略:潜在的なトレンドの反転を特定し、トレーダーがレンジ相場を活用できるようにします。 スキャルピング戦略:高速で正確なデイトレードおよび短期取引のために設計されています。 安定性:すべてのインジケーターはノンリペイント、ノンリドロー、ノ
Azimuth Pro
Ottaviano De Cicco
5 (7)
Azimuth Pro V2:MT5向けシンセティック・フラクタル構造分析と確認済みエントリー 概要 Azimuth Pro は Merkava Labs によるマルチレベルスイング構造インジケーターです。4つのネストされたスイングレイヤー、スイングアンカーVWAP、ABCパターン検出、3タイムフレーム構造フィルタリング、そして確定バーでの確認済みエントリー — 1つのチャートで、ミクロスイングからマクロサイクルまでを網羅するワークフロー。 これはブラインドシグナル製品ではありません。ロケーション、コンテキスト、タイミングを重視するトレーダーのための構造ファーストワークフローです。 V2発売記念オファー — Azimuth Pro V2をUSD 399で(次の100本)。最終価格:USD 499。 1. V2での変更点 シンセティック・マルチタイムフレームエンジン 上位タイムフレーム分析をMeridian Proと同じ独自のシンセティックアーキテクチャで一から再構築。よりクリーンなHTFコンテキスト、安定したライブ動作、従来のMTF同期問題なし。シンセティックエンジンは 固定比率タ
Meridian Pro
Ottaviano De Cicco
5 (2)
Meridian Pro 2.00:MT5向けプロ仕様マルチタイムフレーム・トレンドマトリクス Meridian Pro 2.00 は、MetaTrader 5 向けのプロ仕様の適応型トレンドマトリクスです。オリジナルの Meridian トレンドエンジン、クリーンなチャート ribbon、確定足ベースのシグナル矢印、8時間足 dashboard、Fuel momentum、weighted consensus、synthetic HTF processing、そしてチャート上に直接表示される上位足コンテキストラインを統合します。 目的はシンプルです。現在のトレンド、マルチタイムフレーム構造、強度、momentum、EA-ready 状態を、複数チャートに無関係なインジケータを重ねるのではなく、1つの整理された workflow で読むことです。 Meridian Pro の違い 1つの適応型エンジン - 同じ volatility-aware Meridian ロジックを M1 から W1 まで適用します。 Synthetic HTF architecture - 上位足行は下位足デ
Quantum TrendPulse を ご紹介します。これは、   SuperTrend   、   RSI   、および Stochastic のパワーを 1 つの包括的なインジケーターに組み合わせて、取引の可能性を最大限に引き出す究極の取引ツールです。精度と効率を求めるトレーダー向けに設計されたこのインジケーターは、市場のトレンド、勢いの変化、最適なエントリー ポイントとエグジット ポイントを自信を持って特定するのに役立ちます。 主な特徴: SuperTrend 統合: 現在の市場動向に簡単に追従し、収益性の波に乗ることができます。 RSI精度: 買われすぎと売られすぎのレベルを検出し、市場の反転のタイミングに最適で、SuperTrendのフィルターとして使用されます。 確率的精度: 確率的振動を活用して、変動の激しい市場で隠れたチャンスを見つけます。SuperTrend のフィルターとして使用されます。 マルチタイムフレーム分析:   M5 から H1 または H4 まで、さまざまなタイムフレームで市場を常に把握します。 カスタマイズ可能なアラート: カスタム取引条件が満たされ
まず第一に、この取引ツールはノンリペイント、ノンリドロー、ノンラグの指標であり、プロの取引に理想的ですことを強調する価値があります。 オンラインコース、ユーザーマニュアル、デモ。 スマートプライスアクションコンセプトインジケーターは、新米から経験豊富なトレーダーまで、非常 に強力なツールです。Inner Circle Trader AnalysisやSmart Money Concepts Trading Strategiesなど、20以上の有用な指標を1つに組み合わせています。このインジケーターはスマートマネーコンセプトに焦点を当て、大手機関の取引方法を提供し、彼らの動きを予測するのに役立ちます。 特に、流動性分析に優れており、機関がどのように取引しているかを理解しやすくしています。市場のトレンドを予測し、価格の動きを慎重に分析するのに優れています。機関の戦略とトレードを合わせることで、市場の動向についてより正確な予測ができます。このインジケーターは多目的であり、市場構造を分析し、重要な注文ブロックを特定し、さまざまなパターンを認識するのに優れています。 このインジケーター
このダッシュボードは、選択されたシンボルの最新の利用可能なハーモニックパターンを表示するので、時間を節約し、より効率的に /   MT4バージョン 。 無料インジケーター:   Basic Harmonic Pattern インジケーター列 Symbol : 選択したシンボルが表示されます。 Trend :   強気または弱気 Pattern : パターンの種類(ガートレー、バタフライ、バット、カニ、サメ、サイファー、ABCD) Entry : エントリー価格 SL: ストップロス価格 TP1: 1回目の利食い価格 TP2: 2回目の利食い価格 TP3:   3回目の利食い価格 Current price :   現在値 Age (in bars):    最後に描画されたパターンの年齢 主な入力項目 Symbols:   "28 Major Currency Pairs "または "Selected Symbols "から選択。 Selected Symbols:   カンマで区切られた監視したいシンボル("EURUSD,GBPUSD,XAUUSD")。ブローカーがペアに接
まず第一に、この取引インジケーターは再描画されず、再描画されず、遅延しないことを強調する価値があります。これにより、手動取引とロボット取引の両方に理想的なものになります。 ユーザーマニュアル:設定、入力、戦略。 アトミックアナリストは、価格の強さとモメンタムを利用して市場でより良いエッジを見つけるためのPA価格アクションインジケーターです。ノイズや誤ったシグナルを除去し、取引ポテンシャルを高めるための高度なフィルターを備えています。複雑なインジケーターの複数のレイヤーを使用して、アトミックアナリストはチャートをスキャンし、複雑な数学的計算をシンプルなシグナルと色に変換します。これにより、どのような初心者トレーダーでも理解して使用し、一貫した取引の決定を行うことができます。 「アトミックアナリスト」は、新規および経験豊富なトレーダー向けにカスタマイズされた包括的な取引ソリューションです。プレミアムインジケーターとトップノッチの機能を1つの取引戦略に組み合わせ、すべてのタイプのトレーダーにとって汎用性のある選択肢にします。 デイリートレーディングとスキャルピング戦略:高速で正確なデイ
多くの矢印インジケーターは、シグナルだけを表示して、その後の判断をすべてトレーダーに任せてしまいます。KT Alpha Hunter Arrows は、完整なトレードプランをチャート上に提示します。 各シグナル矢印が表示されるたびに、エントリーライン、ストップロス、4つのテイクプロフィット水準、そして現在の銘柄と時間足が今トレードに値するかどうかを示すリアルタイムのエッジ判定が、すでに描画された状態で表示されます。付属の Trade Manager EA は、あなたが手動でエントリーした後の実行管理を担当し、相場が荒れて判断がぶれやすい場面でも規律あるトレードを保ちやすくします。リペイントなし。確定足シグナルのみ。Forex、ゴールド、指数、その他あなたが取引するあらゆる銘柄に対応します。 主な機能 リペイントしない買い矢印と売り矢印を、足の確定後にのみ表示。 各シグナルに、エントリーライン、構造的ストップロス、4つのテイクプロフィット水準を表示。 Edge Dashboard が、現在のチャートで買いセットアップと売りセットアップを別々に評価。 判定システム:No Edge、Mar
優れたテクニカルインジケーター「Grabber」をご紹介します。これは、すぐに使える「オールインワン」トレーディング戦略として機能します。 ひとつのコードに、市場のテクニカル分析ツール、取引シグナル(矢印)、アラート機能、プッシュ通知が強力に統合されています。 このインジケーターを購入された方には、以下の特典を無料で提供します: Grabberユーティリティ:オープンポジションを自動で管理するツール ステップバイステップのビデオマニュアル:インジケーターのインストール、設定、取引方法を解説 カスタムセットファイル:インジケーターをすばやく自動設定し、最大限の成果を出すための設定ファイル 他の戦略はもう忘れてください!Grabberだけが、あなたを新たなトレードの高みへと導いてくれるのです。 Grabber戦略の主な特徴: 推奨タイムフレーム:M5〜H4 対応通貨ペア・資産:どれでも使用可能ですが、私が実際に検証した以下を推奨します(GBPUSD、GBPCAD、GBPCHF、AUDCAD、AUDUSD、AUDSGD、AUDCHF、NZDUSD、NZDCAD、EURCAD、EURUSD、E
これはMT5のインジケーターで、再描画なしで取引に参入するための正確なシグナルを提供します。 外国為替、暗号通貨、金属、株式、インデックスなど、あらゆる金融資産に適用できます。かなり正確な見積もりを提供し、取引を開始して終了するのに最適な時期を教えてくれます。1つのシグナルを処理しただけでインジケーターの元が取れた例の 動画 (6:22)をご覧ください。Entry PointsPro インジケーターの助けを借りたほとんどのトレーダーの最初の1週間の結果が改善しています。 Telegramグループ に登録してください。Entry Points Proインジケーターのメリットは次の通りです。 再描画のないエントリーシグナル 再描画されるインジケーターでは一度表示されたシグナルが削除されて大きな金銭的損失につながることがありますが、これと異なり、表示されて確認されたシグナルは消えることがありません。 エラーなしの取引開始 インジケーターアルゴリズムによって取引を開始する(資産を売買する)理想的な瞬間を見つけることができます。それを使用するすべてのトレーダーの成功率が向上します。 あら
RelicusRoad Pro: 定量的市場オペレーティングシステム 【期間限定】無制限アクセス 70% OFF - 2,000人超のトレーダーと共に なぜ多くのトレーダーは「完璧な」インジケーターを使っても失敗するのでしょうか? それは、文脈を無視して 単一の概念 だけでトレードしているからです。文脈のないシグナルは単なるギャンブルです。勝ち続けるには、 根拠の重なり(コンフルエンス) が必要です。 RelicusRoad Proは単なる矢印インジケーターではありません。完全な 定量的市場エコシステム です。独自のボラティリティモデリングを用いて、価格が推移する「適正価値の道(Fair Value Road)」をマッピングし、ノイズと真の構造的ブレイクを判別します。 推測はやめましょう。機関投資家レベルの「ロード・ロジック」でトレードを。 コアエンジン:「Road」アルゴリズム システムの中心となる Road Algo は、市場環境にリアルタイムで適応するダイナミックなボラティリティチャネルです。 安全ライン(平衡点) と、価格が数学的に反転しやすい 拡張レベル を投影します。 Si
Trend Forecaster – Since 2023. The Trend Forecaster indicator utilizes a unique proprietary algorithm to determine entry points for a breakout trading strategy. The indicator identifies price clusters, analyzes price movement near levels, and provides a signal when the price breaks through a level. The Trend Forecaster indicator is suitable for all financial assets, including currencies (Forex), metals, stocks, indices, and cryptocurrencies. You can also adjust the indicator to work on any time
BTMM State Engine Pro is a MetaTrader 5 indicator for traders who use the Beat The Market Maker approach: Asian session context, kill zone timing, level progression, peak formation detection, and a multi-pair scanner from a single chart. It combines cycle state logic with a built-in scanner dashboard so you do not need the same tool on many charts at once. What it does Draws the Asian session range; session times can follow broker server offset or be set in inputs. Tracks level progression (L
トレンドラインプロ   市場の真の方向転換点を理解するのに役立ちます。この指標は、真のトレンド反転と主要プレーヤーが再び参入するポイントを示します。 分かりますか     BOSライン   複雑な設定や不要なノイズなしに、より長い時間足でのトレンドの変化と重要なレベルを把握できます。シグナルは再描画されず、バーが閉じた後もチャート上に残ります。 MT4バージョン   -   RFI LEVELS PRO インジケーター と組み合わせることで、その最大限の能力を発揮します インジケーターが示す内容: 本当の変化   トレンド(BOSライン) 一度シグナルが現れたら、それは有効です!これは、リペイント機能を持つインジケーターとの重要な違いです。リペイント機能を持つインジケーターは、シグナルを発した後、それを変更し、資金の損失につながる可能性があります。これにより、より高い確率と精度で市場に参入できます。また、矢印が現れた後、目標値(利益確定)に達するか、反転シグナルが現れるまで、ローソク足の色を変更する機能もあります。 繰り返しエントリ   主要プレーヤーの補充 エントリーポイントを探す
Introducing Indicator for PainX and GainX Indices Traders on Weltrade Get ready to experience the power of trading with our indicator, specifically designed for Weltrade   broker's PainX and GainX Indices.  Advanced Strategies for Unbeatable Insights Our indicator employs sophisticated strategies to analyze market trends, pinpointing optimal entry and exit points.  Optimized for Maximum Performance To ensure optimal results, our indicator is carefully calibrated for 5-minute timeframe charts on
このインジケーターは、反転ポイントと価格戻りゾーンを正確に表示します。     主要プレーヤー 。新たなトレンドが形成される場所を把握し、最大限の精度で意思決定を行い、すべての取引をコントロールします。 TREND LINES PRO インジケーターと組み合わせることで、その潜在能力を最大限に発揮します。 VERSION MT4 インジケーターが示す内容: 新しいトレンドの始まりに活性化する反転構造と反転レベル。 リスクと報酬の比率を最小限に抑えた利益 確定 と 損失停止の レベルの表示     RR 1:2   。 インテリジェントな削減ロジックによるストップロス。 指定されたインジケーターから 2 つのトレンド タイプの反転パターンを表示します。 指標: トレンドを追う   TREND LINES PRO   (世界的なトレンドの変化) TREND PRO   (クイックトレンド変更) シンプルで効果的   スキャナー   リアルタイムトレンド(新機能)。 マルチタイムフレームのインストゥルメント フィルタリング。 画面   利益     LOGIC AI信号の後。 当日プラス方
Super Signal Market Slayer 非リペイント|高精度|マルチマーケット対応インテリジェントトレンド指標 トレードにおいて本当に難しいのは、 注文することではなく、相場のノイズの中で「トレンドが始まった瞬間」を見極めることです。 Market Slayer はそのために開発されました。 本インジケーターは、日中取引向けに設計された非リペイント型のインテリジェント指標です。 多層確認とトレンドフィルターにより、重要な局面でのみ明確かつ信頼性の高い Buy / Sell シグナルを表示します。 主な特長 非リペイントシグナル 一度表示されたシグナルは固定され、消えたり移動したりしません。 高精度なトレンド判定 複数銘柄で検証され、特にゴールド M5 / M15 で安定した結果を示します。 マルチマーケット対応 ゴールド、FX、指数、主要暗号資産に対応。 日中取引向け最適化 M5・M15 に特化し、ノイズを抑え実行性を向上。 直感的で分かりやすい 初心者でも理解しやすく、すぐに使用可能。 技術ロジック概要 Market Slayer は単一条件の矢印ではありません。 以
OmniSync Projection
Antonio-alin Teculescu
5 (1)
Chronos Fractal Engine is an innovative price projection indicator for MetaTrader 5, designed to transform your technical analysis by intelligently identifying and projecting historical price patterns. Built upon an advanced correlation algorithm and the fractal principles of the market, this powerful tool visualizes potential future price movements, giving you a unique edge in your trading decisions. What is Chronos Fractal Engine? At its core, the Chronos Fractal Engine employs a sophisticat
このインディケータは、価格アクション分析とドンチャンチャネルのみを使用して、ジグザグ方式で価格の反転を検出します。再描画やバックペインティングを一切行わずに、短期取引向けに特別に設計されています。それは彼らの操作のタイミングを増やすことを目指している賢明なトレーダーにとって素晴らしいツールです。 [ インストールガイド | 更新ガイド | トラブルシューティング | よくある質問 | すべての製品 ] 驚くほど簡単に取引できます すべての時間枠で価値を提供します 自己分析統計を実装します 電子メール/音声/視覚アラートを実装します 可変長のブレイクアウトと混雑ゾーンに基づいて、インディケータは価格アクションのみを使用して取引を選択し、市場が非常に高速に行っていることに反応します。 過去のシグナルの潜在的な利益が表示されます この指標は、独自の品質とパフォーマンスを分析します 負けブレイクアウトは強調表示され、説明されます インジケータは、非バックペインティングおよび非再ペイントです この指標は、日中のトレーダーが単一の価格反転を見逃さないようにするのに役立ちます。ただし、すべての
初心者やエキスパートトレーダーに最適なソリューション! このインジケーターは、独自の機能と新しい計算式を取り入れた、ユニークで高品質、かつ手頃な価格のトレーディングツールです。たった1枚のチャートで28の為替ペアの通貨強度を読み取ることができます。新しいトレンドやスキャルピングチャンスの引き金となるポイントを正確に特定することができるので、あなたのトレードがどのように改善されるか想像してみてください。 ユーザーマニュアルはこちら  https://www.mql5.com/en/blogs/post/697384 これが最初の1本、オリジナルだ! 価値のないクローンを買わないでください。 特別な サブウィンドウの矢印で強い通貨の勢いを表示 GAPがあなたのトレードを導く! 基準通貨や気配値が売られすぎ・買われすぎのゾーン(外相フィボナッチレベル)にあるとき、個別チャートのメインウィンドウに警告表示。 通貨がレンジの外側から反落した場合、プルバック/リバーサルのアラート。 クロスパターンの特別なアラート 複数の時間枠を選択可能で、トレンドを素早く確認できます。通貨強度のライン
Smart Structure Concepts MT5
Cristhian Alexander Gaibor Cuasquer
Smart Structure Concepts MT5 は MetaTrader 5 で最も完全な機関投資家向け SMC ツールキットです — 4言語の教育的ツールチップと、価格がゾーンに入った瞬間のライブプッシュアラートを備えています。 ほとんどの SMC インジケーターはボックスを描くだけで、あなたに推測を強いります。このインジケーターはチャート上で各シグナルを直接説明します。任意の BOS、CHoCH、Order Block、FVG、流動性レベルにマウスを合わせれば、その意味と次に何をすべきかが即座にわかります — 英語、スペイン語、ポルトガル語、フランス語で。 含まれる機能 — Internal & Swing BOS / CHoCH をリアルタイムで検出(リペイントなし) — Internal & Swing Order Blocks と自動ミティゲーション — 上昇・下降 Fair Value Gaps — Equal Highs & Lows(EQH / EQL)流動性マッピング — Premium / Discount / Equilibrium ゾーン —
MetaTrader 5 向けスマート多層ブレイクアウト&プルバック検出器 「スマート・シンプル・ファスト!」 高確率のブレイクアウトエントリーを見逃すことにうんざりしていませんか? 複数のチャートを何時間もスキャンし、ブレイクアウトをトレンド方向と通貨のモメンタムに合わせようとして、それでも動きを逃してしまうことはありませんか? Break Pullback は、1つのインジケーターでそのすべてを解決します。 Break Pullback とは何ですか? Break Pullback は、マーケットストラクチャー、ブレイクアウト、トレンド継続のセットアップを取引するトレーダー向けに特別に設計されたプロフェッショナルグレードの MetaTrader 5 インジケーターです。 リアルタイムで複数の通貨ペアにわたるブレイクとプルバックの形成を自動的に検出し、3層の確認を通じてすべてのシグナルをフィルタリングします: ストラクチャラルブレイクアウト検出 — チャート上の主要なブレイクレベルを特定 HTF 日足バイアス — エントリーを支配的な日足トレンド方向に合わせる 通貨強弱指数 —
ARICoin is a powerful trading companion designed to generate high-probability entry signals with dynamic TP/SL/DP levels based on volatility. Built-in performance tracking shows win/loss stats, PP1/PP2 hits, and success rates all updated live. Key Features: Buy/Sell signals with adaptive volatility bands Real-time TP/SL/DP levels based on ATR Built-in MA Filter with optional ATR/StdDev volatility Performance stats panel (Success, Profit/Loss, PP1/PP2) Alerts via popup, sound, push, or email Cust
MightyPips Sentiment Pro is a market sentiment indicator for MetaTrader 5 designed to help traders analyze buying and selling pressure in the market. The indicator evaluates market behavior to provide a clearer view of trend direction, momentum strength, and overall sentiment conditions. It helps traders understand whether buyers or sellers are currently dominating the market. Features Buyer vs Seller Analysis Displays the balance between buying and selling pressure using real-time market data.
Meta Cipher A
SILICON HALLWAY PTY LTD
5 (1)
Meta Cipher A:価格アクションのための高精度オーバーレイインジケーター Meta Cipher A は、人気のある Market Cipher A のコンセプトを MetaTrader 5 に導入した高精度のオーバーレイ型インジケーターです。価格チャート上に先行シグナルを直接表示するよう設計されており、 8本のEMAリボン 、WaveTrend分析、そして8種類の異なるシグナルを組み合わせることで、エントリーやエグジット、リスクの高い環境を事前に把握できます。 Meta Cipher A は単体でも強力なツールですが、 Meta Cipher B と組み合わせることで、より深い分析と確認が可能になります。 機能概要 動的なEMAをトレンドベースのカラーで描画し、視覚的な分かりやすさのために塗りつぶしエリアを採用したオーバーレイシステムです。さらに、 Blood Diamond (反転シグナル)、 Yellow Cross (操作警告)、 Blue Triangle (継続パターン)など8種類の特殊シグナルを備えています。 WaveTrendオシレーターはバックグラウンドで
作者のその他のプロダクト
Advanced Market Analysis Tool. Full Documentation: Download Free Professional Education Course: After purchasing, contact me to receive access to the complete CDV Professional Training Video Course. — It will help you master CDV , Aggressive Buyer & Seller dynamics , and Volume Microstructure concepts through a clear, step-by-step learning process. Overview The Professional CDV with Aggressive Score is a comprehensive volume analysis tool that combines visual Cumulative Delta Volume (CDV)
Orderflow Scalp Pro v2.4   delivers institutional-grade trading intelligence through advanced volume analysis, dynamic VWAP calculations, real-time aggressive score monitoring, and precision arrow signals. This complete trading system transforms complex market data into clear, actionable signals for consistent profitability on 3-4 minute timeframes. Full Documentation: [Download PDF] Four Powerful Components in One System Volume Profile HeatMap with POC/VAH/VAL Transform your charts into inst
What is VWAP? The Volume Weighted Average Price (VWAP) is a trading benchmark that reflects the average price of a security, weighted by volume, over a specific time period. It helps traders identify fair value and is used widely in intraday trading to assess price action relative to institutional trading levels. Key Features of Anchored VWAP PRO Anchored Calculation : Unlike traditional VWAP that resets daily, your indicator allows users to anchor VWAP to specific time frames or key points (e.g
Max Min Delta Indicator - Market Volume Imbalance Analysis Gain Deeper Insights into Market Volume Imbalance with Delta Analysis What is the Max Min Delta Indicator? The Max Min Delta Indicator is a powerful market volume analysis tool that visually represents maximum and minimum delta values using a histogram. It helps traders identify market strength, weakness, absorption, and aggressive buying/selling activity with precision. Key Features Histogram Visualization: Displays Max Delta (Green) an
Risk Management EA - Advanced Trading Tool with Visual Controls Description: This comprehensive Risk Management EA transforms your trading experience with an intuitive visual interface directly on your chart. Take full control of your trades with precise risk calculation, customizable entry/exit points, and one-click order execution. Key Features: Visual Trade Management : Drag-and-drop SL/TP lines with real-time profit/loss calculations Automated Risk-Based Position Sizing : Instantly calculate
ORDERFLOW SCALPER EA 4.5 [Real time high accurate absorption/exhaustion detection] Advanced Delta Merge Trading System for Professional Traders Full Documentation: [ Download PDF ] Instrument : US30 [DJ30] Time Frame : 15Min Myfxbook Chart: [myfxbook.com/members/DeltaMerge/] Recommended Brokers : icmarkets, fpmarkets [This EA is fully optimized for ICMARKETS US30 conditions] ️ Original Price: $2,399 Limited-Time Offer: $899 Revolutionary Order Flow Analysis Technology with Sma
The Absorption & Exhaustion Detector Professional indicator is a sophisticated volume analysis tool designed to identify critical market turning points by analyzing the relationship between price movement and cumulative volume delta (CVD). This indicator helps traders spot when price movements lack volume confirmation, indicating potential absorption or exhaustion zones. KEY FEATURES Real-time Cumulative Volume Delta (CVD) calculation and normalization Price-volume divergence gap measurement dis
Professional VWAP Trading System with Advanced Signal Detection Transform your trading with the most comprehensive VWAP indicator available for MetaTrader 5. Magic VWAP Key Levels Pro combines multiple timeframe analysis, intelligent signal detection, and professional-grade visualization to give you the edge in modern markets. CORE FEATURES: Multi-Timeframe VWAP Analysis Session, Weekly, and Monthly VWAP calculations Previous 10-day VWAP support/resistance Dynamic anchor periods (Session/Week/Mo
Aurum VWAP EA - Professional Gold Trading System Institutional-Grade VWAP Analysis for XAUUSD H4 ️ XAUUSD 4 H Set File : [ Download ] Limited-Time Discount! Get this powerful tool now for only $699 — price will increase at the end of this month! Don’t miss your chance to lock in the discount before the price goes up. Aurum VWAP EA is a sophisticated automated trading system designed specifically for Gold (XAUUSD) on the H4 timeframe. Built on proven institutional trading principles, this Exp
Professional Institutional Trading System Symbol: XAUUSD Recommended Timeframe: M30 Minimum Capital Requirement: 300 USD (or equivalent in other currencies) Broker Compatibility: Fully compatible with all MT5 brokers Delta Wave v1.2 is an advanced algorithmic trading system that integrates Volume Weighted Average Price (VWAP) analytics with Cumulative Delta Volume (CDV) to identify high-probability trading opportunities. It is designed for traders seeking professional execution, objective signa
Gold Liquidity Engine v1.7 — AI-Powered Institutional Order Flow Scalper for XAUUSD Gold Liquidity Engine is an advanced algorithmic trading system built on institutional Smart Money Concepts, designed exclusively for XAUUSD (Gold). It identifies and exploits liquidity sweeps, order blocks, and fair value gaps the way professional traders operate — fully automated on the M15 timeframe. EA Checking Account. Login : 52744271 Password : GLE_Pass #2026 Server : ICMarketsSC-Demo Core Strategy The EA
フィルタ:
mikee11
50
mikee11 2026.04.27 17:07 
 

it is an amazing indicator, gives a very good picture how the market is moving..

Francesco Pierini
197
Francesco Pierini 2025.11.20 18:33 
 

This indicator is EXACTLY what I needed. I've been using it for a while on Trading View, but having it directly on MT5 is fantastic🤩 Plus, you can see the divergences graphically... that's all I need. Many thanks to the developer who quickly clarified some of my questions about the functions👏🏻👏🏻

TitanScalper
1024
開発者からの返信 Adhikari Arachchilage Chathura Madhushanka Adhikari 2025.11.21 04:47
Thank you so much for your amazing feedback! 🙌
I’m really glad to hear the indicator is exactly what you needed and that having it on MT5 has made your workflow easier. Knowing that the graphical divergences and features are helping you is truly rewarding 🤩 If you have any questions, need adjustments, or want to add new features in the future, I’m always here to help.
Thanks again for your trust and support!
Eka Aristanto
24
Eka Aristanto 2025.10.06 09:23 
 

This indicator is excellent and has been very helpful in my trading. It provides a broader perspective on volume analysis. Although volume in spot/CFD forex trading is generally not as accurate as in futures trading, this indicator is extremely helpful. It's also easy to identify divergences. Optional combination for who use this tool more accurate, you can add Multi stochastic or Multi MFI ( combine between short period and medium period ). The seller also very helpful, great job by the way. Very Recommended!!!.

TitanScalper
1024
開発者からの返信 Adhikari Arachchilage Chathura Madhushanka Adhikari 2025.10.06 09:47
Thank you so much for your great review and kind words! I’m really glad the indicator has been helpful in your trading. Combining it with Multi Stochastic or Multi MFI is an excellent idea. great insight! I truly appreciate your support and feedback. Wishing you continued success and many profitable trades ahead! 📈🔥
Aravind Kolanupaka
10159
Aravind Kolanupaka 2025.08.02 02:01 
 

Very good CDV indicator and easy to spot divergences.

レビューに返信