DeMark Sequential MT5
- インディケータ
- バージョン: 1.2
- アップデート済み: 13 6月 2021
- アクティベーション: 5
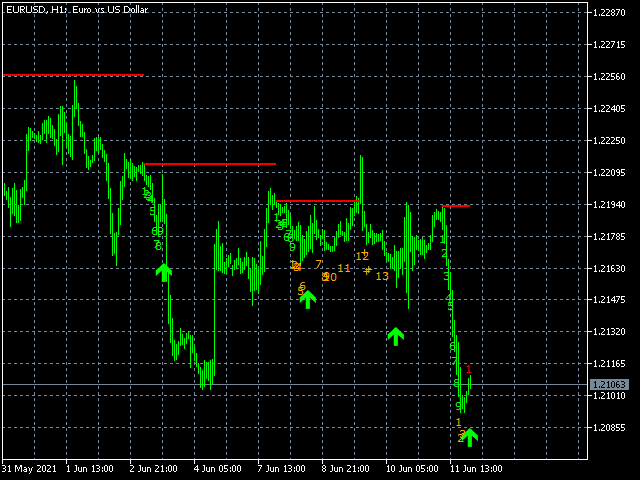
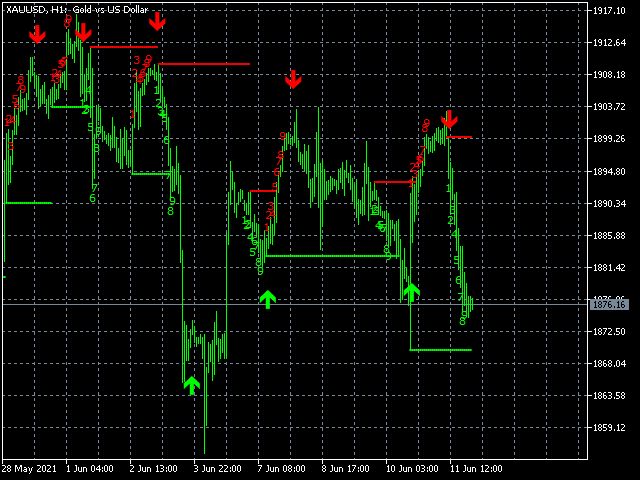
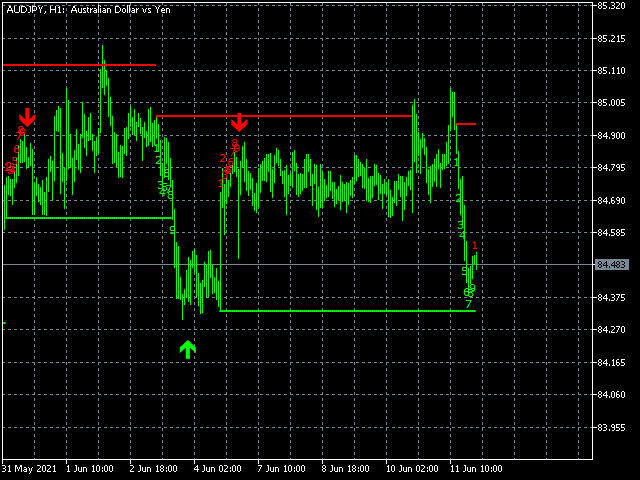
Tom DeMark developed TD Sequential by hand, through a process of trial and error, in the 1970s. It never ceases to amaze me how something originally created to analyze daily price data can be applied so effectively, more than thirty years later, to any time frame—from one minute to one year—and to any market.
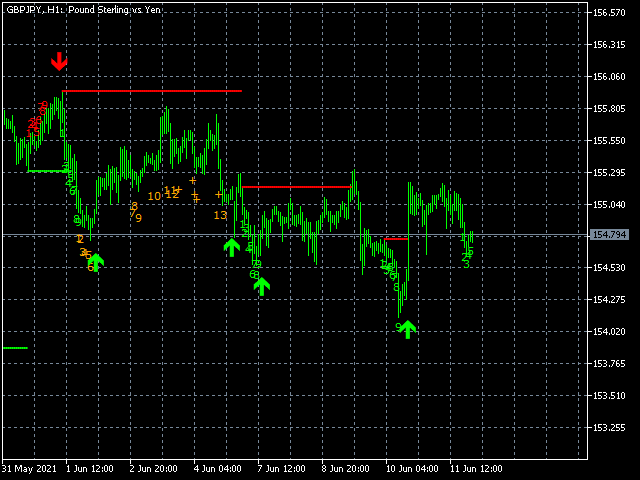
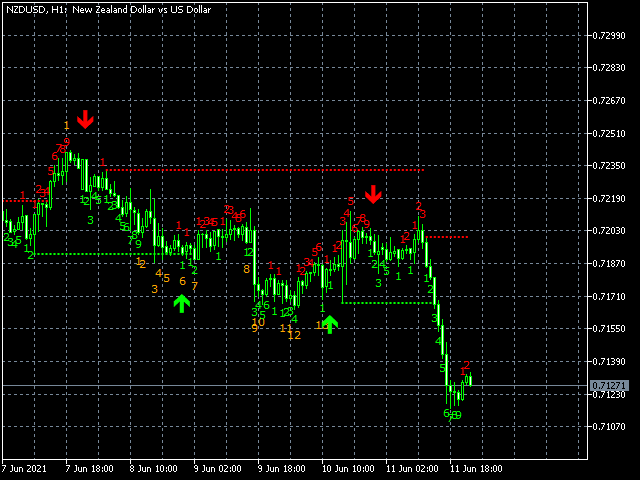
The indicator has two components: TD Setup, which relies on momentum to define price ranges, and TD Countdown, which is trend based, and looks for low-risk opportunities to fade established directional moves.
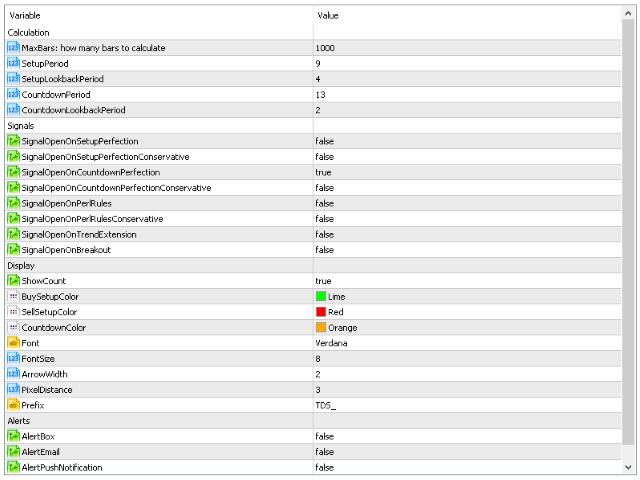
Input
- MaxBars - Number of bars to calculate
- SetupPeriod - Number of period or bar to complete TD Setup
- SetupLookbackPeriod - Number of period or bar lookback to compare for TD Setup
- CountdownPeriod - Number of period or bar to complete TD Countdown
- CountdownLookbackPeriod - Number of period or bar lookback to compare for TD Countdown
- SignalOpenOnSetupPerfection - Display arrow and give entry signal on TD Setup perfection
- SignalOpenOnSetupPerfectionConservative - Display arrow and give entry signal on Price Flip after TD Setup perfection
- SignalOpenOnCountdownPerfection - Display arrow and give entry signal on TD Countdown perfection
- SignalOpenOnCountdownPerfectionConservative - Display arrow and give entry signal on Price Flip after TD Countdown perfection
- SignalOpenOnPerlRules - Display arrow and give entry signal on TD Setup perfection and closing price hasn't break support and resistance
- SignalOpenOnPerlRulesConservative - Display arrow and give entry signal on Price Flip after Perl Rules established
- SignalOpenOnTrendExtension - Display arrow and give entry signal on TD support/resistance break in setup process
- SignalOpenOnBreakout - Display arrow and give entry signal if price close below or above support or resistance
- ShowCount - Display setup count and countdown count on chart
- BuySetupColor - Number color on buy setup
- SellSetupColor - Number color on sell setup
- CountdownColor: Number color on countdown
- Font - Number font
- FontSize - Number size
- ArrowWidth - Size of arrow that give signal
- PixelDistance - Distance of arrow that give signal from candle
- Prefix - Prefix for object name on chart
- AlertBox - Notification by alert box on entry signal given
- AlertEmail - Send email notification by alert box on entry signal given
- AlertPushNotification - Send push notifications to the mobile terminals on entry signal given
Buffer for iCustom()
- Buffer #0 - TDST Resistance: actual price level. EMPTY_VALUE if price already close above resistance level.
- Buffer #1 - TDST Support: actual price level. EMPTY_VALUE if price already close below support level.
- Buffer #2 - Setup: candle number - positive for Buy Setup, negative for Sell Setup. 0 on empty value.
- Buffer #3 - Countdown: candle number - positive for Buy Countdown, negative for Sell Countdown. 0 on empty value.
- Buffer #4 - Setup Perfection: 1.0 for Buy Setup Perfection, -1.0 for Sell Setup Perfection. 0 on empty value.
- Buffer #5 - Signal: 1.0 for Buy Signal, -1.0 for Sell Signal. 0 on empty value.