Resistance level and support level
- インディケータ
- バージョン: 1.1
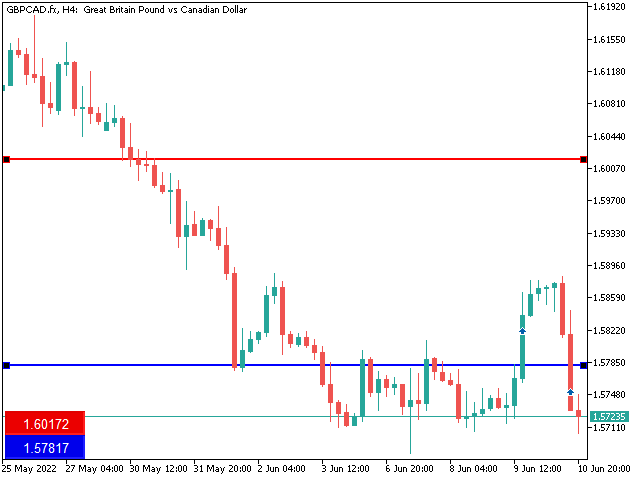
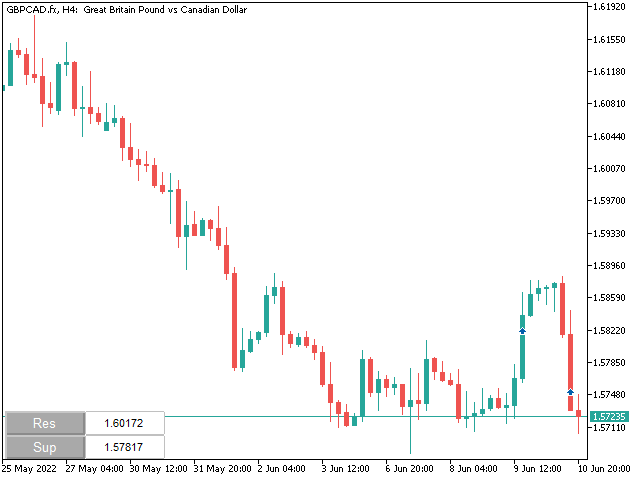
Resistance and Support is an easy to use indicator to apply horizontal lines of resistance and support.
There are two windows for adding levels.
When you press the button, a line appears on the price chart. It is possible to move this line with the mouse,
thereby changing the indicator readings.
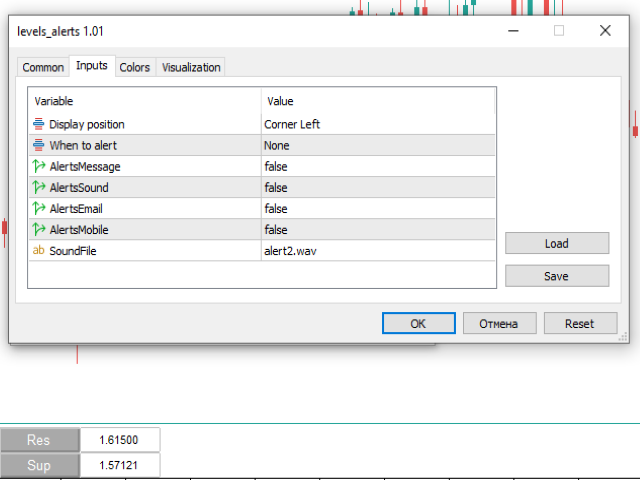
In the indicator menu there is a choice of possible alerts - no alert,
alert on touching the level and an alert for closing the candle after the level.


👍