 MetaTrader 5
 エキスパート
 インディケータ
 ライブラリ
ライブラリ
 ユーティリティ
 ウィジェット
 ルール
ルール
YouTubeにあるマーケットチュートリアルビデオをご覧ください
ロボットや指標を購入する
仮想ホスティングで
EAを実行
EAを実行
ロボットや指標を購入前にテストする
マーケットで収入を得る
販売のためにプロダクトをプレゼンテーションする方法
MetaTrader 5のための無料のテクニカル指標 - 40
 テクニカル指標からのシグナルは、株式および外国為替市場での取引の開始と終了に重要な役割を果たします。指標の本質は、将来の価格変動を予測することを目的とした金融銘柄価格の数学的変換です。
テクニカル指標をテストして、市場の動きとそれからの利益をより正確に予測します。
テクニカル指標からのシグナルは、株式および外国為替市場での取引の開始と終了に重要な役割を果たします。指標の本質は、将来の価格変動を予測することを目的とした金融銘柄価格の数学的変換です。
テクニカル指標をテストして、市場の動きとそれからの利益をより正確に予測します。 
NAS100 Doji Dual Supertrend is a non-trading chart indicator for MetaTrader 5. It combines a configurable moving average with two Supertrend calculations: one applied to Low and one applied to High. By default, both Supertrends use an ATR period of 240 and a factor of 4.8, while the moving average uses period 60 and the Open price. The indicator identifies confirmed Doji and Spinning Top candles and draws demand or supply wick zones according to the direction of the previous Low Supertrend. When
FREE

Velas Multi Time Frame
Las velas multi time frame, también conocidas como "MTF candles" en inglés, son un indicador técnico que permite visualizar velas japonesas de un marco temporal diferente al marco temporal principal en el que estás operando. Este enfoque ofrece una perspectiva más amplia del comportamiento del precio, lo que resulta especialmente útil para los traders que emplean estrategias de acción del precio. A continuación, se detallan los conceptos clave relacionados con este indic
FREE

This indicator is based on the Heiken Ashi indicator. It helps the user identifying whether to buy or sell. It comes with an alert that will sound whenever a new signal appears. It also features an email facility. Your email address and SMTP Server settings should be specified in the settings window of the "Mailbox" tab in your MetaTrader 5. Blue arrow up = Buy. Red arrow down = Sell. Line = Trailing Stop. You can use one of my Trailing Stop products that automatically move the Stop Loss and inc
FREE
Positions panel
This is a panel for counting current icon holdings. Convenient traders at any time to view the position and profit and loss situation. Perfect for traders who like to hold multiple orders at the same time. Main functions: Position statistics Total profit Average price calculation TP price calculation ST price calculation Positions valume
FREE

Session Map - a free trading sessions and ICT KillZone indicator for MetaTrader 5. See at a glance when Sydney, Tokyo, London and New York open and close, and mark the high-probability ICT kill zones directly on your chart. The biggest moves happen when sessions overlap and during the London and New York kill zones. Session Map shades every session and kill zone automatically, labels each one, and can alert you before they start - so you are at the chart when volatility arrives. Features: Sydney
FREE

Price tells a story, but volume tells the truth. Volume Truth is a visual analysis tool that reads the relationship between price and volume to reveal what institutions are doing behind the move — accumulating, distributing, or stepping aside. It does not just plot volume bars; it interprets them. [b]The four price/volume states[/b] Price up + volume up = institutional accumulation (bullish conviction) Price up + volume down = weak rally, no conviction, prone to reverse Price down + volume up =
FREE

Az Filter Trend Signal is a high-precision trading tool that combines statistical analysis with advanced trend filtering. By utilizing the Z-Score algorithm, this indicator normalizes price action to identify how far the current price is from its statistical mean, effectively filtering out market noise. The core of the indicator is a smoothed Signal Line (EMA) derived from the Z-Score. This line features a dynamic color-coding system based on its slope and a customizable sensitivity threshold, a
FREE

Live MTF Trend Panel for MT5 Professional Multi-Timeframe Trend Dashboard with Live Candlestick Analysis Live MTF Trend Panel adalah indikator profesional MetaTrader 5 yang menampilkan kondisi trend secara real-time pada 9 timeframe sekaligus , mulai dari M1 hingga Monthly , menggunakan analisis murni berdasarkan candlestick tanpa indikator teknikal apa pun. Panel ini dirancang untuk trader yang membutuhkan gambaran cepat mengenai arah pasar dari berbagai timeframe dalam satu tampilan yang ringk
FREE
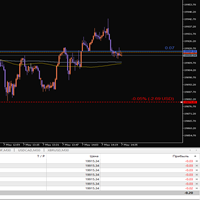
This indicator is designed for visual risk management and monitoring of open positions on the chart. It automatically calculates and displays: The average entry price for all open positions of the current instrument. The total volume of positions. A horizontal Stop Loss line, which can be moved manually. The potential loss if SL is triggered – both as a percentage of the account balance and in the account currency.
FREE

Investment Castle Horizontals — Key Levels, Mapped Clearly
The Horizontals Indicator gives you a clean, comprehensive map of the horizontal levels that matter — the prices where the market repeatedly reacts — so you can plan entries, exits and targets around real structure instead of guesswork.
What it does for you Key horizontal levels: the important support and resistance prices, drawn for you. Comprehensive yet clean: a clear map of structure without chart clutter. Plan with structure: set
FREE

MQL5に投稿する用の、短く実用的な日本語版の説明です: Dynamic Market Profile (DMP) — カスタム・ボリュームプロファイル Dynamic Market Profile は、チャート上の任意の場所の出来高(ボリューム)を、手動かつ瞬時に分析できるインジケーターです。日足や週足といった固定のプロファイルに縛られる必要はありません。分析したい特定の値動き、レンジ(保ち合い)、トレンドの波をピンポイントで自由に選択できます。 インタラクティブな長方形(レクタングル)を使って、最大 5つの独立したエリアを同時に チャート上に描画できます。 普段のトレードでの使い方 エリアを作成: キーボードの 「1、2、3、4、5」 のいずれかを押すか(または画面上のボタンをクリック)、長方形をチャートに表示させます。 チャート上で調整: 長方形の端をドラッグして、分析したい正確な「期間」と「価格帯」を囲みます。 瞬時に分析: インジケーターがそのエリアのボリュームプロファイルを生配信のようにリアルタイムで計算・描画します。 特定のプロファイルを消したい場合は、その長方形を削
FREE
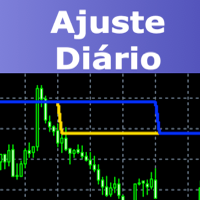
This indicator will draw two lines to represent the adjustment value, which can be used in both the Dollar and the Index.
The main advantage of this indicator is that it has two lines, one representing the adjustment calculated from the previous day and the other representing the adjustment calculated on the current day. The calculation of the adjustment on the current day is a great differential, since it will be possible to make operations in order to sleep bought or sold according to the ad
FREE

TLC MACD Multi-Timeframe plots a real MACD from a higher timeframe directly on your current chart, without you having to flip back and forth between windows.
Most "multi-timeframe" MACD indicators fake it by just using a longer period on your current timeframe. This one doesn't do that. It reads the actual MACD from the timeframe you choose (daily, for example) and holds that same reading across every bar on your chart until the next higher-timeframe bar actually closes. So what you see is exa
FREE

Combining the best of Price Action , Directional Movement , and Divergence/Convergence analysis, Candle Color Trend is a easy and reliable way to identify trend direction. The indicator automatically paints the candles according to the assumption that an uptrend is defined by prices that form a series of higher highs and higher lows. In contrast, a downtrend is defined by prices that form a series of lower highs and lower lows. Additionally, ADX Wilder indicator is used to measure trend weakness
FREE
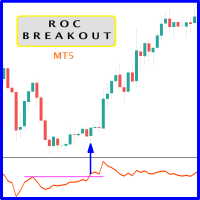
When prices breakout resistance levels are combined with Rate of Change oscillator "ROC" oscillator breaks out its historical resistance levels then probability emerges to record farther prices. It's strongly encouraged to confirm price breakout with oscillator breakout since they have comparable effects to price breaking support and resistance levels; surely, short trades will have the same perception. Concept is based on find swing levels which based on number of bars by each side to confirm
FREE
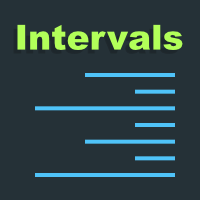
このプロジェクトが好きなら、5つ星レビューを残してください。 大規模なボリュームを取引するには、複数の楽器/チャートを調べる必要があります
新しい機会を見つける, このインジケータは、特定の特定のプロットによってあなたを助ける
数またはそのサフィックスの複数のレベルによって、それらを自動的に更新します
価格が変更されると、そうでなければ退屈なタスク。 例えば、GBPUSDでは、インジケーターの4つのインスタンスを
チャートをプロットする: 線長100バーの各0.01間隔。 線の長さ25バーの0.0075間隔で終わる各価格。 線長50バーの0.0050間隔で終わる各価格。 25バーの線長で0.0025間隔で終わる各価格。 このようにして、定規に似ているので、この例が非常に見られます。
スクリーンショット。 また、色やラインのスタイルを異なるスタイルで設定できます。
レベルを視覚化しやすいようにします。
FREE

Introduction to Fractal Moving Average Fractal Moving Average indicator was designed as part of Fractal Pattern Scanner. Inside Fractal Pattern Scanner, Fractal Moving Average Indicator was implemented as multiple of chart objects. With over thousands of chart object, we find that it was not the best and efficient ways to operate the indicator. It was computationally too heavy for the indicator. Hence, we decide to implement the indicator version of Fractal Moving Average indicator to benefit ou
FREE

MT5 Market Dashboard All-in-One Professional Market Dashboard — multi-layer indicator for MetaTrader 5 MT5 Market Dashboard is an indicator built to consolidate, within a single non-intrusive panel, all the information a trader needs to make informed decisions. It does not replace your analysis — it accelerates it, by eliminating the need to switch between multiple indicators, chart windows, and timeframes. Timeframes covered All timeframes covered - all displayed simultaneously Real-time update
FREE

Dynamics Edge: Statistical Precision in Mean Reversion Dynamics Edge is a volatility boundary indicator designed to identify price exhaustion with high precision. Using an advanced standard deviation calculation ( $2.2 \sigma$ ), it maps the extremities where price is statistically likely to return to equilibrium (median). Key Features: Dynamic Exhaustion Edges: Solid lines that expand and contract based on volatility, identifying overbought (Blue) and oversold (Red) zones. OCR-Ready Price Tags:
FREE

LRC Pro with Alerts Overview LRC Pro replaces standard candlesticks with Linear Regression smoothed candles , eliminating market noise and making trend direction instantly clear. A signal line (SMA or EMA) is overlaid directly on the smoothed candles, giving you clean, actionable entries and exits without cluttering your chart. Unlike standard candles that react to every tick, LRC Pro show you where price is actually trending — making it far easier to stay on the right side of the market. How It
FREE

Genaro Nexus Indicator Genaro Nexus Indicator は、スマートマネーコンセプト、ワイコフ、フェアバリューギャップ、オーダーブロック、流動性、RSI ダイバージェンスを組み合わせ、トレーダーが市場構造を読み取るのを支援するために設計されたテクニカル分析ツールです。その目的は、機関投資家の関心領域やトレンドの変化の可能性をチャート上で明確かつ整理された形で提供することです。 このインジケーターは視覚的なカスタマイズ性と使いやすさに重点を置いて構築されており、ユーザーは自分のトレードスタイルに合わせて色、形状、サイズ、分析期間を調整できます。すべての情報は非侵襲的なグラフィックオブジェクトとして描画され、価格の可読性を保ちます。 主な機能: 指数移動平均線 (EMA) によるトレンド:チャート上に 2 本の EMA(短期・長期)を表示し、主要な方向を識別するために色を設定可能。緑色の短期 EMA は買い圧力を示し、赤色の長期 EMA は売り圧力を示します。 フェアバリューギャップ (FVG):公正価値のギャップを自動的に検出し、価格が不均衡を残した領
FREE

Gold Impulse Detector H1 — Your Ultimate Compass for Finding Impulse and Trend Reversals! Trading gold (XAUUSD) and tired of missing out on powerful market moves? It's time to take full control of volatility!
Gold Impulse Detector H1 is a professional indicator for MetaTrader 5, designed specifically to detect key impulse candles that signal the end of the current phase and a high probability of a trend reversal or continuation of a strong impulse.
What's the indicator's superpower? Cap
FREE

BinaWin NoTouch is an indicator that sends an alert signal when the trade is in the right position to wait for the breakdown of a side market.
It is specially designed to trade under the “No Touch” strategy of the Binary.Com platform with synthetic indexes N.10, N.25, N.50, N.75 and N.100
Similarly, trading can be done with the conventional CALL and PUT strategy of any Binary Options platform.
Requirements to use the indicator:
1. Have an account at Binary.Com
2. Configure the Binary.Com d
FREE

Exponential Moving Average (EMA) Indicator The Exponential Moving Average (EMA) is one of the most widely used indicators in technical analysis.
It smooths out price fluctuations to help traders identify market trends more clearly — without being too slow to react to price changes. Unlike the Simple Moving Average (SMA), the EMA gives greater weight to recent prices , making it more responsive to new market information. This makes it ideal for traders who want to detect trend reversals earlier o
FREE
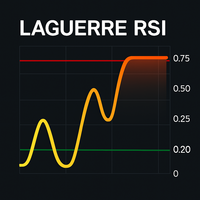
ラゲールRSI(Laguerre RSI):高度なオシレーター ラゲールRSI(Laguerre RSI) は、ジョン・エーラスによって開発された、デジタルフィルターに基づく高度なオシレーターです。このインジケーターは、 ラゲールフィルター と呼ばれる手法を使用して価格変動を平滑化し、 買われすぎ および 売られすぎ の領域をより正確に検出し、市場ノイズを低減します。 ラゲールRSIは 0から1の間 で変動し、その標準レベルは次のとおりです。 買われすぎ: 0.75 以上 売られすぎ: 0.25 以下 このインジケーターは、 市場の転換点 、 正確なエントリー 、 シグナルの確認 を検出するのに理想的です。 オプション機能 ラゲールRSIには、以下のようなオプション機能が含まれています。 音、メール、またはプッシュ通知によるアラート 重要なゾーン間の視覚的な塗りつぶし 平滑化の柔軟なパラメータ設定( ガンマ ) ユーザーマニュアル 設定可能なパラメータ: 1. 主要設定 ガンマ (0.1 から 0.9): 平滑化の度合いを制御します。 低い値 → 感度が高く、シグナルが多くなります。
FREE

INSIDE BAR ZONE - Interactive Price Action Mapper for MetaTrader 5 Automatically detects every inside bar on your chart and draws a transparent, draggable price zone from its High to its Low. Complete with High, Mid, and Low price labels rendered directly on the zone. WHY TRADERS USE IT - Zero-maintenance detection. Every inside bar across up to 500 bars back is mapped the moment you attach the indicator. No manual zone drawing. - Persistent zones. A built-in watchdog recreates any box you a
FREE
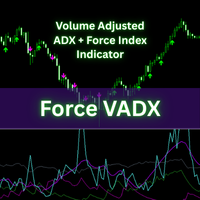
Force VADX Indicator Force VADX is an advanced, multi-factor indicator that fuses volume-adjusted trend strength, normalized force index, and adaptive directional signals. Designed for modern traders, it pinpoints high-confidence buy and sell zones, offering a robust technical foundation for both discretionary and automated trading.
Use this indicator in conjuntion with other tools for confirmation and confluene. This indicator is not intended to be a complete trading system but rather a tool
FREE

Confluence Engine builds scored SMC confluence zones on your chart. Instead of showing one signal type, it clusters independent Smart Money signals — liquidity sweeps and institutional higher-timeframe levels — into price zones and tells you exactly how many factors coincide at each one.
This answers the question every SMC trader is really asking: how many independent signals agree on this level right now?
How it works:
Detects liquidity sweeps of prior swing highs/lows (wick pierce + body cl
FREE

Indicator Description
This simple yet highly practical indicator draws clearly visible price levels above and below the current market price. It is optimized for use on the M1 timeframe, making it especially suitable for traders who depend on fast and precise market feedback. Although it is designed with M1 in mind, the indicator can be used on other timeframes as well. The indicator follows a minimalist design philosophy, focusing purely on functionality without unnecessary features or visual d
FREE

Check out the detailed blogpost with screenshots: https://www.mql5.com/en/blogs/post/771285
Features All trades in one subwindow — Every open BUY and SELL order gets its own mini candlestick chart, no matter what symbol it belongs to. Smart price scaling — EURUSD and BTCUSD look the same size. The indicator uses ATR normalization so every trade is equally readable. Live candle updates — The latest candle reflects the real-time Bid price, not just the last close. Entry, SL & TP lines — See exact
FREE
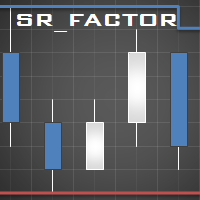
This indicator identifies short-term, medium-term and long-term highs and lows of the market according to the method described by Larry Williams in the book "Long-term secrets to short-term trading".
Brief description of the principle of identifying the market highs and lows A short-term high is a high of a bar with lower highs on either side of it, and, conversely, a short-term low of a bar is a low with higher lows on either side of it. Medium-term highs and lows are determined similarly: a
FREE
マルチタイムフレーム対応、カスタマイズ可能なビジュアルシグナル、設定可能なアラートシステムを備えたAwesome Oscillator(AO)インジケーター。
フリーランスプログラミングサービス、アップデート、その他のTrueTL製品は私の MQL5プロフィール からご利用いただけます。
フィードバックとレビューを大歓迎します!
AOとは? Awesome Oscillator(AO)は、ビル・ウィリアムズが開発したモメンタム指標で、中間価格(高値+安値)/2の34期間と5期間のSimple Moving Average(SMA)の差を計算することで市場のモメンタムを測定します。このインジケーターは、市場の全体的な方向性と潜在的な反転ポイントを識別するのに役立ちます。 AOはゼロラインを中心に振動します。正の値は強気のモメンタムを示し(速いSMAが遅いSMAを上回っている)、負の値は弱気のモメンタムを示します。ヒストグラム表示によりモメンタムの変化を視覚化しやすくなります:ヒストグラムがゼロより上で上昇している場合、強気のモメンタムが増加しています;ゼロより下で下落している場合、
FREE
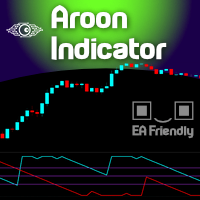
The name Aroon means “ Dawn's Early Light ” in Sanskrit. His creator Tushar Chande chose this name because the indicator is designed to catch the beginning of a new trend. At first sight it seems a little confusing all those jagged lines but after you understand the basics of it, you will find this indicator pretty cool and use it in a variety of ways, i.e.: Trigger, Trend Filtering System, and so on. The Aroon indicator was created in 1995 so it is a "modern" indicator compared to the Jurassic
FREE
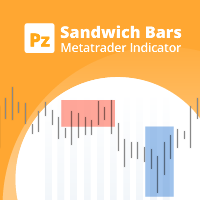
Spot high-probability trades: sandwich bar breakouts at your fingertips This indicator detects Sandwich Bars of several ranges, an extremely reliable breakout pattern. A sandwich setup consists on a single bar that engulfs several past bars, breaking and rejecting the complete price range. [ Installation Guide | Update Guide | Troubleshooting | FAQ | All Products ] Easy and effective usage Customizable bar ranges Customizable color selections The indicator implements visual/mail/push/sound ale
FREE

SmartRSI Pro – 賢いトレーダーのためのインテリジェントRSIシグナルインジケーター
SmartRSI Proは、RSIをベースにした次世代インジケーターで、トレーダーにチャート上で直接使いやすく信頼性の高い売買シグナルを提供します。人気の相対力指数(RSI)を基に、マーケットノイズをフィルタリングし誤ったシグナルを減らすスマートなロジックを追加しています。初心者から上級者まで幅広く利用可能です。 主な特徴:
自動売買矢印
カスタムRSI閾値に基づくはっきりと見える上下矢印(リペイントなし)。 リセットロジック付きスマートシグナルフィルター
RSIがリセットされた時にのみシグナルを発動し、過剰取引やノイズを回避。 カスタマイズ可能なRSIパラメーター
RSI期間、レベル、タイムフレームを選択可能で戦略に合わせて調整可能。 ミニマリストデザイン
余計なものがなく、正確な矢印シグナルとシンプルなラベルのみ。 全シンボル&タイムフレーム対応
Forex、指数、金属、暗号通貨などに対応。M1から日足まで利用可能。 動作原理:
買いシグナル
FREE

Sandwich Candle Scanner Pro Sandwich Candle Scanner Pro is a high-precision price action tool specifically engineered to detect Sandwich (Three-Method) candlestick patterns automatically. This indicator is a powerful asset for traders focusing on high-probability reversals and trend continuations, particularly effective on volatile assets like XAUUSD (Gold) , Indices, and Major Forex pairs. Stop hunting for patterns manually. Let this professional scanner do the heavy lifting, ensuring you never
FREE

The Keltner Channel Pro is a modern and enhanced version of the classic Keltner Channel , designed for traders who want to identify trends, reversals, and overbought/oversold zones with greater accuracy. Built with EMA (Exponential Moving Average) and ATR (Average True Range) , this indicator automatically adapts to market volatility, providing dynamic channels that help filter noise and improve trade timing. Key Features: Main channel (upper, middle, and lower) based on EMA + ATR. Optional ad
FREE

日中通貨の強さをグラフで表したものです。 計算は28通貨ペアに基づいて行われ、日足ローソク足の開始時刻から現在時刻までの値が追跡されます。 このインジケーターは元々、FX28 Traderダッシュボードの無料ツールとして開発されました。 現在は無料でご利用いただけます。 このインジケーターには複数のカスタマイズ設定があり、FX28 Traderチャートコントロールシステムに直接リンクすることもできます。 注意! このインジケーターはストラテジーテスターでは動作しません。 テストするには、ライブチャートにダウンロードしてインストールする必要があります。
日中通貨の強さをグラフで表したものです。 計算は28通貨ペアに基づいて行われ、日足ローソク足の開始時刻から現在時刻までの値が追跡されます。 このインジケーターは元々、FX28 Traderダッシュボードの無料ツールとして開発されました。 現在は無料でご利用いただけます。 このインジケーターには複数のカスタマイズ設定があり、FX28 Traderチャートコントロールシステムに直接リンクすることもできます。 注意! このインジケーターはスト
FREE
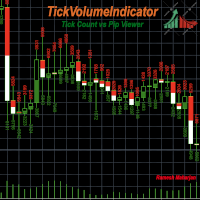
チャート上のトレンドを識別するための様々なインジケーターと手法があります。TickVolumeIndicatorもその一つです。ティックデータを用いて過去のトレンドを表示することで、将来のトレンドを特定し予測するのに役立ちます。
TickVolumeIndicatorは、ティックボリュームを用いてチャート上の表示可能なローソク足に色を描画するインジケーターです。ティックボリュームとは、ビッド値とアスク値です。ユーザーは、ローソク足の時間枠におけるビッド数とアスク数、またはピップの変化を選択できます。アスク数は、アスク値が前回のアスク値よりも大きい場合に加算され、ビッド数は、ビッド値が前回のビッド値よりも小さい場合に加算されます。これらは両方ともローソク足の高さに正規化されてチャートに表示されます。ピップの変化も同様に計算されます。
ユーザーには以下のオプションがあります。
1) アスク色:アスク値の色として、赤、緑、青、紫、黄、シアン、紫、茶、オレンジ、ピンク、白、なしから選択できます。デフォルトは緑です。
2) 入札色: 入札値の色として、赤、緑、青、紫、黄色、シアン、紫、
FREE
Time and Price Fractal Studies is an indicator that will help you identify certain patterns that tend to repeat themseleves at certail times of the day or at certain prices. It is used to study Fractal Highs ad Lows in relation to time and price. You will get to answer certail questions like: At what time of day does this market usually turn around. At what price does the market turn. Is it at round numbers etc.
FREE

BarionQuant MACD Color Lite displays a custom four-color MACD histogram that makes momentum shifts easy to read at a glance. DIF and DEF lines are included; divergence detection is reserved for the paid Divergence Pro edition. HOW IT WORKS DIF = Fast EMA(12) minus Slow EMA(26) DEF = Smoothed signal line of DIF Energy = (DIF − DEF) × 2, split into four histogram colors: Above zero, lengthening → red (momentum building) Above zero, shortening → aqua (momentum fading) Below zero, lengthening → gree
FREE

The indicator displays divergence for any custom indicator. You only need to specify the indicator name; DeMarker is used by default. Additionally, you can opt for smoothing of values of the selected indicator and set levels whose crossing will trigger an alert. The custom indicator must be compiled (a file with ex5 extension) and located under MQL5/Indicators of the client terminal or in one of the subdirectories. It uses zero bar of the selected indicator with default parameters.
Input parame
FREE

Bosenic V1 Trend Candles Bosenic V1 Trend Candles is a lightweight MT5 chart indicator designed to visually display the trend condition used by the Bosenic V1 trading system. Instead of using a separate trend calculation, the indicator applies the same baseline calculation used by the EA. This allows traders to see the underlying bullish or bearish condition directly on the main price chart. How It Works The indicator calculates EMA values separately from the Open, High, Low, and Close prices us
FREE

Blame The Box is a lightweight, session range and breakout analysis indicator. It identifies custom intraday consolidation sessions, maps out dynamic breakout levels, and displays real-time position sizing directly on your chart.
Key Features Automated Session Mapping: Automatically detects and frames intraday consolidation ranges (such as the Asian session) with a customisable background and border box. Dynamic Level Projections: Automatically plots Long/Short entry buffers, Stop Loss, Break
FREE

Trend Filter Line is a trend-following tool designed to help traders identify the market's core direction with surgical precision. Based on the popular Two-Pole Filter logic, this indicator eliminates market "noise" and provides a clear, color-coded visualization of the prevailing trend.
Whether you are a scalper, day trader, or swing trader, the Trend Filter Line Pro acts as your primary decision-making filter—ensuring you never trade against the momentum.
How It Works The indicator uses a s
FREE

Fibochian Flow: Mathematical Precision with 200-Period Trend Filter Fibochian Flow is a professional trading tool that combines dynamic channel volatility with the institutional strength of the 200-period Moving Average. Designed to capture trend ignitions (breakouts), the indicator provides a complete trade setup: Macro Filter, Entry Point, Stop Loss, and three Fibonacci-based Target levels. How Fibochian Flow Works: Trend Filter (Orange Line): Acts as the market's ultimate guide. We only look
FREE

VolumeFlow is a Volume Accumulation / Distribution tracking indicator. It works in a similar way to OBV, but it is much more refined and includes the options to use: Classical Approach = OBV; Useful Volume Approach; Gail Mercer's approach; Input Parameters: Input Parameters: Approach Type: Explained above; Volume Type: Real or Ticks; Recommendations: Remember: The TOPs or BOTTONS left by the indicator are good Trade Location points. This is because the players who were "stuck" in these regions w
FREE

Objective Market Sentiment Analysis for MT5 Emotional trading is a common challenge for retail traders. The AURA Market Sentiment Scanner provides a data-driven approach to market analysis by translating complex price action, momentum, and volatility into a simple 0-100 Fear & Greed Index. Designed as a plug-and-play dashboard, this scanner helps you maintain an objective view of the market without cluttering your chart with multiple indicators. "Simplify your trading, maximize your profits, and
FREE

This indicator is based on the Parabolic SAR indicator. It helps the user identifying whether to buy or sell. It comes with an alert that will sound whenever a new signal appears. It also features an email facility. Your email address and SMTP Server settings should be specified in the settings window of the "Mailbox" tab in your MetaTrader 5. Blue arrow up = Buy. Red arrow down = Sell. Line = Trailing Stop. You can use one of my Trailing Stop products that automatically move the Stop Loss and i
FREE

Support And Resistance indicator that can display round levels and zones . It shows them directly on the chart, providing an easy help when you want to set stop-loss or take-profit level, or when you want to see the next market target. If an asset price is moving down and bounces back up, the level is called support (think: price floor). If an asset price is moving upward and hits a level where it reverses downward, this is called resistance (think: price ceiling).
FREE

Высокоточный трендовый индикатор для платформы MetaTrader 5, разработанный для поиска идеальных точек входа на пробой зон консолидации. Индикатор автоматически определяет периоды накопления объема, строит динамические ценовые коробки и генерирует сигналы в моменты истинного выхода цены из диапазона. Главное преимущество алгоритма — строгий фильтр чередования сигналов (BUY / SELL) . Индикатор полностью исключает рыночный шум и серии однотипных ложных сигналов на затяжных трендах: после сигнала н
FREE

This indicator is a sophisticated MetaTrader 5 tool that calculates and displays Average Daily Range (ADR) levels on your chart. It draws horizontal lines representing expected price movement ranges based on historical daily volatility, helping traders identify potential daily high and low targets. ADR (Average Daily Range) = The average difference between the daily high and low over a specified period (default: 14 days). Unlike ATR which includes gaps between days, ADR focuses purely on int
FREE
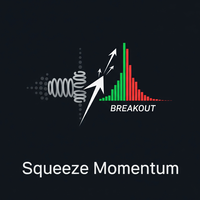
1. Introduction The Squeeze Momentum Plus is a powerful technical analysis tool designed to help traders identify periods of low market volatility (the "squeeze" phase) and assess the direction and strength of price momentum . This indicator combines the principles of Bollinger Bands and Keltner Channels to detect changes in market volatility, along with a momentum oscillator to measure buying/selling pressure. 2. Key Components of the Indicator The Squeeze Momentum Plus is displayed in a separa
FREE
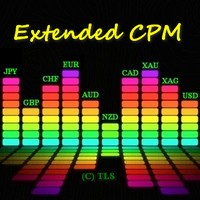
このアルゴリズムは、Currency PowerMeterインジケーターのアイデアに基づいています。このバージョンでは、表示される値の数は無制限であり、そのコードはよりコンパクトで高速であり、現在のバーの値はインジケーターバッファーを介して取得できます。 インジケーターが示すもの :細いバンドと通貨の前の上の数字は過去N時間の相対力指数を示し(Nは変数「時間」のパラメーターで設定されます)、広いバンドは日次インデックスを示します。入力パラメーターで指定するこの通貨を使用する通貨ペアが多いほど(ブローカーがペアの見積もりを提供すると仮定)、インデックスの重みが大きくなります(ただし、「非メジャー」通貨またはエキゾチック通貨のペアには注意してください。全体像を歪める)。たとえば、EURUSDのみを指定した場合、ユーロの相対インデックスはこのペアのみに基づいて計算されます。EURGBPを追加すると、ユーロインデックスは2つのペアに基づいて計算され、より重み付けされた値が取得されます。 データの使用方法 :重要なニュースがない場合、インデックス値が低い/高いほど、技術的な修正またはトレンドの継
FREE

FREE

Plus Color Candles — MetaTrader 5 用カラーローソク足 Plus Color Candles は、各期間の方向に応じてローソク足を自動的に色分けして表示します。 終値が始値と同じかそれより高い上昇ローソク足は緑色で表示されます。終値が始値より低い下降ローソク足はピンク色で表示されます。 このインジケーターは始値、高値、安値、終値の完全な情報を保持し、価格の動きをすっきりと直接的に確認できる表示を提供します。 特徴: 上昇ローソク足と下降ローソク足を異なる色で表示; 始値と終値に基づいて色を自動的に決定; ローソク足の実体とヒゲを完全に表示; 各ローソク足の方向を素早く確認; さまざまな銘柄と時間足に対応; 自動更新; MetaTrader 5 のストラテジーテスターに対応; Replay 環境向けの専用ビジュアル処理; 自動売買を実行しません。 Plus Color Candles はテクニカル分析を補助するための視覚的ツールです。このインジケーターは金銭的な結果を保証するものではなく、ご自身の分析基準および適切なリスク管理と併用してください。
FREE

トレーダーなら誰もが知っている儀式があります。インディケータの設定を開き、数値を変え、OKを押し、チャートを目を細めて眺め、違うと判断してまた設定を開く。Envelopes ではこの問題が特に深刻です。偏差パーセントは、クラシックなツール群の中で最も銘柄依存の強い数値だからです。デフォルトの 0.10% は、ある通貨ペアでは妥当に見えても、ゴールドでは見えないほど狭く、指数では極端に広くなります。それでも多くのトレーダーが一度設定したきり触らないのは、試すたびにダイアログを往復しなければならないからです。Envelopes Live Tuner はその手間を終わらせます。 本製品は、 チャート上でそのままリアルタイムに 調整できる本格的な Envelopes インディケータです。チャネルが描かれるローソク足の上で直接調整できます。チャート上の小さなパネルには、期間と 偏差パーセント(0.05% から 5.00% まで、0.05 刻み) のスライダーが並びます。これは Live Tuning ファミリーで最も分解能の高いスライダーで、小数点以下2桁まで指定できます。スライダーを動かせば、
FREE
マルチタイムフレーム対応、カスタマイズ可能なビジュアルシグナル、設定可能なアラートシステムを備えたAverage Directional Movement Index(ADX)インジケーター。
フリーランスプログラミングサービス、アップデート、その他のTrueTL製品は私の MQL5プロフィール からご利用いただけます。
フィードバックとレビューを大歓迎します!
ADXとは? Average Directional Movement Index(ADX)は、J. Welles Wilderが開発した技術的指標で、方向性に関係なくトレンドの強さを測定するために使用されます。ADXはポジティブ方向指標(+DI)とネガティブ方向指標(-DI)から導出されますが、トレンドの方向ではなく強さのみを示します。 ADX値は0から100の範囲です。一般的に、20〜25未満の値は弱いまたは存在しないトレンド(レンジ相場)を示し、25を超える値は強いトレンドを示します。50を超える値は非常に強いトレンドを示します。ADXは市場がトレンド中かレンジ中かを識別するのに特に役立ち、トレーダーがトレンドフォ
FREE

A stochastic oscillator is a momentum indicator comparing a particular closing price of a security to a range of its prices over a certain period of time. The sensitivity of the oscillator to market movements is reducible by adjusting that time period or by taking a moving average of the result. It is used to generate overbought and oversold trading signals, utilizing a 0-100 bounded range of values. This indicator show 8 stochastic on one chart.
FREE
A Renko Tick chart based on continuously adjusting percentage.
Live Renko bricks formed by tick data
Adjustable brick width expert for indicator attached Scalp with a Renko, get weird.
The settings can and will break the script if you turn them up too high. Turning off outline mode will not look as nice, but can potentially allow for a larger number of bricks.
FREE

Phoenix Master Engine v3は、MetaTrader 5専用の機関投資家向けマルチストラテジー・ダッシュボードです。ゴールド・スキャルピング、機関投資家の流動性、FVG分析の3つの高精度手法を1つに統合しています。
1. ゴールド・スキャルプ・モジュール: XAUUSDに特化。EMA 21フィルター、15分足レンジのスキャン、手動調整可能なブレイクアウト・アラートを搭載。 2. 機関投資家の流動性: ヒゲと実体の比率(2.0倍〜15.0倍)から「スマートマネー」を特定し、現在価格からの距離をピップスで表示。 3. FVG & S&R分析: M1とM5のフェアバリュー・ギャップを同時スキャン。タッチ回数カウント機能付きのフラクタル・サポレジで構造を分析。
特徴: ゼロラグ・インターフェース、Telegram連携(チャート画像送信対応)、視認性の高いブラック&ファイヤーブリック・レッドのテーマ。
FREE
マルチタイムフレーム対応、カスタマイズ可能なビジュアルシグナル、設定可能なアラートシステムを備えたボリューム(Volume)インジケーター。
フリーランスプログラミングサービス、アップデート、その他のTrueTL製品は私の MQL5プロフィール でご覧いただけます。
フィードバックとレビューを大変お待ちしております!
ボリュームとは? ボリュームはテクニカル分析において最も基本的な指標の一つです。特定のバーまたは期間中に取引されたコントラクト、株式、またはロットの総数を表します。MetaTraderではデフォルトでティックボリュームが使用されます — 各バー内の価格ティックの数をカウントするもので、ほとんどの市場において実際の取引量と密接に相関しています。 ボリュームは価格方向を示しません — 市場の活動と参加度を測定します。ボリュームの増加は価格動向の強さを確認し、低ボリュームは弱いまたは持続不可能なトレンドを示す可能性があります。トレーダーはボリュームを使用してブレイクアウトを検証し(高ボリュームのブレイクアウトはより信頼性が高い)、トレンドの枯渇を識別し(価格とボリュームの
FREE

Tick imbalance bars (TIB), described in the book Advances in Financial Machine Learning (2018) by Marcos López de Prado. Indicator that show candlestick bars with an different sampling method than time fixed. Real time data is sourced to the indicator and it may be used as substitute of the default graph. Each bar is formed when a predefined tick balance is exceeded, showing in the graph the OHLC of this cluster of ticks. The input variable is the amount of ticks of each bar. The indicator may
FREE

ENGLISH VERSION (FREE INDICATOR) Smart ZigZag Signal & Statistics Monitor – FREE Multi‑Timeframe Indicator Free automated trading signals based on ZigZag peak ratios, live trade tracking, win/loss statistics, and one‑click signal inversion – designed to work with the commercial Smart Logic Executor PRO EA. This indicator is completely FREE. Use it standalone or as a signal source for the paid Expert Advisor Smart Logic Executor PRO (sold separately). Key Features 6 Adjustable Ran
FREE

Stochastic Multi-Timeframe Dashboard shows the Stochastic reading of four timeframes at the same time, so you can judge momentum across the market without opening several charts. By default it displays the M15, H1, H4 and D1 timeframes, and the K period, D period, slowing and levels are all configurable. Each timeframe is color coded, with red when the reading is overbought, green when it is oversold and grey when it is neutral, which makes extremes easy to spot. Alerts are based on the closed b
FREE

Anchored VWAP is a lightweight, interactive volume-weighted average price indicator designed for traders who need precision without clutter.
Unlike standard VWAP that resets every session, this tool lets you drop up to five custom anchors directly on any candle. Each anchor calculates VWAP from that exact point forward, complete with standard deviation bands to highlight where price may find support or resistance relative to volume.
Key Features: • Up to 5 simultaneous anchors — compare multi
FREE

The indicator plots three lines on the chart — an upper band, a moving average, and a lower band — forming an envelope around price. On each bar it computes a momentum value by subtracting the price n bars ago from the current price (where n is the momentum period). This captures how fast price is moving, not just where it is. It then looks back over the last period bars and sums up the squared momentum values. The square root of that average gives a momentum-based standard deviation — essential
FREE

これは無料でご利用いただける製品です。お客様のニーズに合わせてご利用ください。
このインジケーターが気に入ったら、ぜひ短い肯定的なフィードバックを残してください!ありがとうございます!
高品質のトレーディングロボットとインジケーターをご覧になるにはここをクリックしてください!
MT5 用 Forex インジケーター スプレッド ディスプレイ、優れた補助取引ツール。 ................................................................................................... - スプレッド ディスプレイ インジケーターは、接続された Forex ペアの現在のスプレッドを表示します。 - スプレッド ディスプレイの値は、チャートのどのコーナーにも配置できます. - 色とフォント サイズも設定できます。 これは、この MQL5 Web サイトでのみ提供されるオリジナル製品です。
FREE
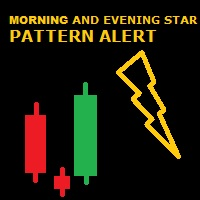
GIVE A LOOK TO MY OTHER PRODUCTS ! 100 % PER MONTH PROFIT----CONTACT ME FOR MORE INFO ! Morning and evening star are 2 famous and reliable candlestick patterns, very helpful to understand an imminent change of trend. This indicator finds for you this patterns on your chart and send you an alert just when a pattern is 100 % formed. To make this indicator more reliable,you can choose the body lenght in pips of the last bar closed ( so the reversing one ),and you can, by this ,making more or less
FREE

TrendView — Clear Trend Visualization for Confident Trading
TrendView is a free trend indicator designed to give traders a clean and reliable view of market direction. It displays clear trendlines in three colors, making it easy to identify bullish, bearish, and neutral phases without cluttering the chart with unnecessary elements. Whether you are monitoring long-term market structure or short-term price action, TrendView helps you keep your focus on the bigger picture. For traders who also w
FREE
MetaTraderマーケットは、開発者がトレーディングアプリを販売するシンプルで便利なサイトです。
プロダクトを投稿するのをお手伝いし、マーケットのためにプロダクト記載を準備する方法を説明します。マーケットのすべてのアプリは暗号化によって守られ、購入者のコンピュータでしか動作しません。違法なコピーは不可能です。

取引の機会を逃しています。
- 無料取引アプリ
- 8千を超えるシグナルをコピー
- 金融ニュースで金融マーケットを探索