 MetaTrader 5
 エキスパート
 インディケータ
 ライブラリ
ライブラリ
 ユーティリティ
 ウィジェット
 ルール
ルール
YouTubeにあるマーケットチュートリアルビデオをご覧ください
ロボットや指標を購入する
仮想ホスティングで
EAを実行
EAを実行
ロボットや指標を購入前にテストする
マーケットで収入を得る
販売のためにプロダクトをプレゼンテーションする方法
MetaTrader 4のためのエキスパートアドバイザーとインディケータ - 66
 自動売買ロボットは市場取引を自動的に実行しますが、インジケータを使用すると、相場をより適切に分析し、価格行動を予測できます。
これらのアプリケーションを使用すると、より多くの機会を獲得しながら、より多くの情報に基づいた方法でMetaTrader4で取引を実行できるようになります。
自動売買ロボットは市場取引を自動的に実行しますが、インジケータを使用すると、相場をより適切に分析し、価格行動を予測できます。
これらのアプリケーションを使用すると、より多くの機会を獲得しながら、より多くの情報に基づいた方法でMetaTrader4で取引を実行できるようになります。 
Range Box Indicator for Trading Sessions This indicator allows traders to visualize and analyze specific time ranges directly on their chart by drawing rectangular boxes for each trading session. Key Features: Customizable session interval: set your own session start and end times. Number of days displayed: choose how many past sessions are visible. Default color and special color for Monday: easily highlight weekly patterns. Adjustable border width: customize the appearance of the rectangles to
FREE

The Magic SMA indicator is of great help in determining trend direction. It can be an excellent addition to your existing strategy or the basis of a new one. We humans can make better decisions when we see better visually. So we designed it to show a different color for rising and falling trends. Everyone can customize this in the way that suits them best. By setting the Trend Period, we can optimize it for longer or shorter trends for our strategy. It is great for all time frames.
IF YOU NEED
FREE
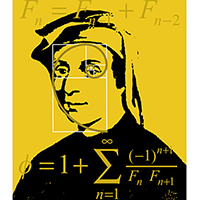
The script sets Fibonacci levels on the chart using maximums and minimums visible on the chart. The script names Fibo with such timeframe on which it has been launched (Fibo D1 or Fibo M30, etc.), therefore preserving previously constructed levels on different time charts. This instrument will be useful for those who start studying Fibonacci levels and those who need to form these levels in a speedy fashion. The script does not have additional settings. Fibonacci lines can be amended in standard
FREE
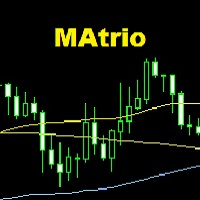
The MAtrio indicator displays three moving averages on any timeframe at once with a period of 50-day, 100-day, 200-day. After attaching to the chart, it immediately displays three moving averages with the parameters of simple (SMA) moving average SmoothingType50 , simple (SMA) moving average SmoothingType100 , simple (SMA) moving average SmoothingType200 . Accordingly, with the price type ValuePrices50, ValuePrices100, ValuePrices200 , by default, the price is Close price everywhere. All parame
FREE
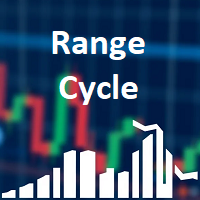
Range Cycle Indicator. Gives signal on price range cycling smoothed by moving average. It is better to use it on H1+ timeframes and avoid side markets. Because if market is flat this indicator will give too many zero profit or even losing signals. Parameters: PopUpAlert - to allow it to alert when trend changes; EMailAlert - for email alerts; period - this is a smoothing criteria, use higher values on lower timeframes; TimeFrame(new) - higher timeframe (or the same) to use for calculation, defa
FREE

Introducing Force Jurik—a powerful indicator designed to enhance trading insights by combining custom moving averages based on Jurik with the MetaTrader 4 indicator, Force Index.
Jurik moving averages are renowned for their precision and smoothness, making them ideal for analyzing price movements in the forex market. They offer traders a reliable method of identifying trends and filtering out market noise, ultimately providing clearer signals for decision-making.
The Force Index, a popular Me
FREE

This is a regression tree indicator for MT4/MT5.
This indicator classificate nodes on the time period so that the deviation becomes smaller,
and displays regression line and channel for each node.
It's free!
Attached CartDemo.ex4 and CartDemo.ex5 is a Demo version and has the following limitations:
Can't use HighSpeed method (default method is RandomForest)
Maximum number of bars is 260 (increase from 200)
There is no expiration date and can be started many times, but it stops after an hour.
FREE

Velvet RVI is intended for use with the Velvet advanced ordering layer. It is based on the algorithm for the Relative Vigor Index, provided by Investopedia here . All of the data it displays is accurate and verified against the internal API function iRVI, when it is detected by the ordering layer. In order to place orders with the Velvet RVI indicator, the ordering layer must be installed and running. Ordering from the Velvet RVI indicator requires that "Velvet Ordering Layer" ( found here ),
FREE
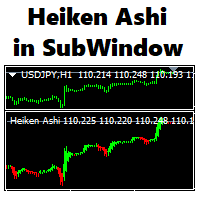
This indicator plots Heiken Ashi candles in a subwindow instead of the main chart, making it possible to analyse HA candles whilst keeping the main chart clean.
- optional bid/close line is provided, stylable, updates on tick - HA candles are stylable via the inputs tab - optional price smoothing to the HA candles, with moving average period and method options - auto-scaling when scrolling back and forth
FREE

Check the Trend Power This indicator is designed to identify the POWER of trend. This is NOT define bullish or bearish trend. It is quite easy to look at the power when the indicator line turns Green the trend are strong when the indicator line turns Red the trend are Weak strategy for trade is : Open possition only when the power go Green Exit possition when the power change to Red
FREE

Советник использует две МА ( Moving Average ) для открытия позиции. В MA Slim гибкие настройки для выставления стоп лосс и тейк профит. Так же можно выставить свой трейлинг стоп. Хорошо оптимизирован для eurusd H4 , но можно настроить под любую валютную пару по своему усмотрению. Lots/ Лот DecreaseFactor/ Коэффициент Уменьшения SL/ Стоп Лосс TP/ Тейк профит MovingPeriod1/ Период MA MovingPeriod2/ Период MA MovingShift/ Сдвиг МА AllPositions/ Управлять всеми позициями ProfitTrailing/ Тралить то
FREE

The VMA is an exponential moving average that adjusts its smoothing constant on the basis of market volatility. Its sensitivity grows as long as the volatility of the data increases. Based on the Chande's Momentum Oscillator, the VMA can automatically adjust its smoothing period as market conditions change, helping you to detect trend reversals and retracements much quicker and more reliable when compared to traditional moving averages.
FREE

The " Comfort Zone Signal " indicator identifies a daily zone that, when broken, has a high probability of the market continuing the established trend .
Upon signal, the indicator calculates stop loss and take profit, which can be set by you.
You can also set the trend. If the price is above the MA, it looks only for long positions, if below, it looks only for short positions.
You can choose to ignore the moving average and display all signals.
Additionally, you have the risk percentage displ
FREE

It's a simple but useful tool for creating a grid based on Envelopes.
Only 2 parameters can be set: 1) "Period" - the period of all visible Envelopes (i.e. 4) and 1 Moving Average (Envelopes axis), 2) "Deviations Distance" - the distance between Envelopes.
Naturally, the colors of all 9 lines can be changed as desired. It works with everything that is available in your Market Watch.
Good luck!
FREE

Uses of EA: Close orders and close charts when conditions are met. in_Test: + True: there is a command when running in Backtest mode. + False: Not entered, used for real time in_Closebyprofit: + true: use payment in USD + false: do not use closed in USD in_profit_win: stop rate (USD) in_profit_loss: stop loss (USD) in_Closebypercent: + true: use close to percent of balance + false: do not use the percent percent of balance in_profit_win: percent stop rate in_profit_loss: perce
FREE
The purpose of this new version of the MT4 standard indicator provided in your platform is to display in a sub-window multiple timeframes of the same indicator. See the example shown in the picture below. But the display isn’t like a simple MTF indicator. This is the real display of the indicator on its timeframe. Here's the options available in the FFx indicator: Select the timeframes to be displayed (M1 to Monthly) Define the width (number of bars) for each timeframe box Alert pop up/sound/ema
FREE
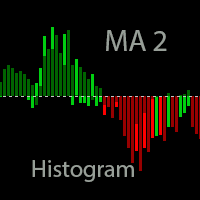
The indicator is based on two Moving Averages. Its only difference from traditional indicators is that it is presented as a histogram. The histogram has four colors; each color represents a MA with its own period. In case of a descending trend, if a price is lower than a moving average, the indicator displays a value lower than the red zero level. In case of ascending trend, the indicator value is higher than the green zero level. Parameters: Period MA 1 - Period of the first moving average. MA
FREE

There is a very simple and surprisingly effective indicator called Pi Cycle, which starts to give the first warning. It is worth a look, so as not to miss the giant elephant in the living room!))
What is Pi Cycle?
Pi Cycle is a very simple indicator created by analyst Philip Swift . It takes into account two (DMA biased moving averages ): 350-day average x 2 111-day average Both can be considered long-term indicators. The second one is obviously more sensitive to current market changes, since
FREE
High, Low, Open, Close — isn't this too much? Sometimes you need a unique history of prices. But if choose one thing, you lose the rest. Smoothing also leads to data loss. Often you lose one of the most important market details: information about extremes. It is due to the preservation of information about the highs and lows, the correct "smoothing" for the history of price is a zigzag. But zigzags also have drawbacks — they do not provide intermediate values. The Price Line indicator solves thi
FREE

EA_Agr_Test
This is a free version of EA_Agr_Full , designed to provide the buyer with the opportunity to check the product not in the tester, but on a live account. Here exactly the same trading algorithm is used, but there is no possibility to change the parameters, except for GMToffset .
Orders cannot be more than 0.01 lot and profit is taken very early.
For this reason, it is impossible to achieve high returns. Algorithm verified with broker just2trade
Parameters
GMToffset - differenc
FREE
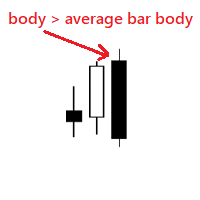
Very simple indicator that shows if body of a new bar is bigger than the average bar body. We can use the indicator to notice bars that are bigger than usual, for example this could mean a new trend. Input params: history bars to display from how many bars to get the average bar body To calculate only bars from the same type distance for the dots bull color bear color dot size
FREE

Индикатор вычисляет наиболее вероятные уровни возврата цены. Может быть использован для установки уровня тейк профит. Рекомендуемый таймфрейм - любой, при соответствующей настройке. Настройки.
Period - количество свечей для анализа. Accuracy - точность расчёта уровня в пунктах. Width - размер ценовой метки. Отработка уровней как правило не занимает много времени, уровни достаточно точны при касании и процент возврата цены к ним достаточно высок. Но следует учитывать риск продаж на локальных мин
FREE
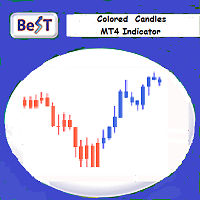
BeST_Colored Candles is an MT4 FREE indicator that can change the color of the Candlesticks based on the MACD, SAR or RSI values and levels. It is a Composite indicator that by selection uses the values each one of these 3 indicators and their critical levels in order to create numerical relationships that when satisfied cause their corresponding candlesticks coloration.
Input parameters
== Basic Settings
-- Please Select Indicator - for selecting which one of the above 3 indicators
FREE
High and Low Levels EMA Технический индикатор в помощь трейдеру. Однажды пришла идея при изучении индикатора Moving A verage ( MA ).
Так как мувинги эти сглаженное, среднее значения цены за выбранный период, то как и у обычной цены и у мувинга
должны быть «хаи и лои».
Данный индикатор, показывает уровни High и Low . Динамических уровней поддержки и сопротивления.
О понятии High и Low .
Хай — от английского high — обозначает наиболее высокую цену («рынок на хаях » — капитализация актив
FREE

AR Canada Standard is a fully automated Expert Advisor optimized for trading USDCAD H1. The Expert Advisor DOES NOT use hedging, martingale, grid strategies, arbitrage, etc. It uses a trading algorithm based on the intersection of two moving averages for analyzing the market conditions. The Take Profit and Stop Loss values are fixed and have a ratio of 1 to 3,6. The EA closes positions when Take Profit or Stop Loss are reached. Risk management is a key concept in Forex trading. This EA allows se
FREE

InpRSIshort =13; // RSI short InpRSIPeriod =34; // RSI long PeriodRs =0; //Price 0C 4HL/2 5HLC/3 mafast =13;//mafast maslow =65;//MAslow
Double line RSI sub graph index. The parameters are adjustable. The RSI lines with two different cycles can be used to observe the trend strength effectively. Meanwhile, a short period cross long period color column image is displayed below. When the cycle (Jin Cha) is on the short cycle, the color of the column map changes from the light green to the
FREE

SkalpAUDNZD is a highly accurate and reliable advisor for trading the AUDNZD currency pair( time frame М5) . The advisor does not have dangerous technologies such as martingay, grids and averaging and is therefore safe for a trading account. Orders are closed using a signal or take profit and stop loss; the advisor forcibly closes orders on the opening day. The advisor opens only one order at a time and all orders are protected by a fixed Stop Loss. The advisor is easy to use, as it has fe
FREE

The GJ_H1_220100009_S_HD_CF_SQX_SL20 is an algorithmic trading strategy for MetaTrader, tested on GBPJPY using the H1 timeframe from April 1, 2004, to April 24, 2024. There is no need to set up parameters, all settings are already optimized and fine-tuned.
Recommended broker RoboForex because of EET timezone.
You can find the strategy source code for StrategyQuant at the link: https://quantmonitor.net/gbpjpy-macd-trader/
Key details are:
Parameters
MagicNumber: 220100009
Main Chart: Cu
FREE

Clonify PRO - Local Trade Copier for MT5 and MT4 Professional tool for copying trades between MT5 and MT4 accounts (via the shared "Common" folder). FEATURES: 1. SENDER: Exports trades in real-time Sends everything (no filters) Requires no additional settings 2. RECEIVER: Copies trades. Magic Number: Uses the sender's account ID (default) or a custom number. Lot Modes: Analogous: Exactly the same volume as the sender. The Lot Multiplier allows you to decrease or increase the transmitted lot. Pr
FREE

This free EA is built on a robust strategy designed for long-term stability and performance.
The best results are achieved by optimizing the parameters and adapting them to your broker’s conditions (transaction costs, latency, leverage). For a more powerful edition (with additional filters, advanced risk management, and asset-specific presets) or a MT5 version feel free to contact me.
️ Test Parameters
Pair : GBPUSD Timeframe : H3 Initial Deposit : 10 000 Leverage : 1:30
FREE

Description VisualHistory plots positions (Buy and sell orders only) from history of account on a chart. It draws the standard arrows for entry/exit and connects them by the dashed line. Also, VisualHistory displays information on the top left corner of a chart concerning displayed positions: positions count, net profit. Download it to the <MQL4/Experts> directory of your MetaTrader.
Options
Start date for history orders - start date of displayed trade history End date for history orders - end
FREE

EA「JAYRO(ジャイロ)」 汎用性 × 安定性 × 戦略性を兼ね備えた マーチンゲールEA(2024年作)
ご覧いただきありがとうございます。 「 JAYRO(ジャイロ) 」は、2024年に開発された 汎用性の高いマーチンゲールEA です。
マーチン系の魅力である「連勝力」と、「コントロール可能なリスク管理」を両立させた、 中長期運用向けのEA として設計されています。 単なるナンピン・ロット倍加型のEAではなく、
「トレードの判断・リスクの設定・決済のタイミング」までをユーザーが柔軟に制御できるよう工夫された構造が特徴です。 初心者の方へ トレーリングストップ・増加倍率・最大ポジション数など、 すべての要素を最適化してあるのでそのまま使えます。 高精度なロジックゆえ、 様々な通貨・相場環境に対応。 推奨ロット数は証拠金100万円に対して0.01LOTです。 稼働中は 自動でエントリー・ポジション管理・クローズ まで完結します
こちらは損益結果の一部です証拠金500万円でスタートして現在も稼働中です 2025/2/9運用スタート
2026/2
FREE

Hermes Trend
プロフェッショナル向けに設計されており、堅牢なシグナルロジックと安全な計算機能により、遅延や誤更新を排除します。 過去のシグナルの再描画、削除、変更は行いません。
すべてのシグナルはローソク足自体に生成され、固定されたままです。
実際の取引では再描画は行われず、シグナルはローソク足自体に瞬時に表示されます。 プロフェッショナルレベルの安定性、精度、柔軟性を提供します。 システムはトレンドやモメンタムの変化、そして横ばい(フラット)を正確に識別し、ノイズや誤シグナルを最小限に抑えながら、勝率の高い取引シグナルを提供します。
主な機能:
マルチレベルフィルタリングシステム(モジュール式、完全にカスタマイズ可能)。
リアルなリアルタイム視覚化。 チャート上で直接明確なシグナルを表示。 MT4に完全に最適化されています。
あらゆる通貨ペア、指数、株式、FX、暗号通貨に対応しています。
トレンドトレード、スイングトレード、反転確認に対応しています。
信頼性が高く明確なプロフェッショナルシグナルを求め
FREE
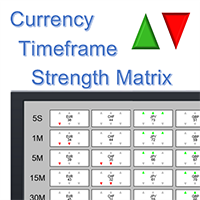
Note: this product is a free limited version of the full featured product Currency Timeframe Strength Matrix . It only includes AUD, CAD, CHF currencies instead of all 8 currencies. It includes only 5S, 1M, 5M time frames instead of all 8 (5S, 1M, 5M, 15M, 30M, 1H, 4H, 1D).
What is it? The Currency TimeFrame Strength Matrix is a simple and comprehensive Forex map that gives a snapshot of what is happening in the Forex market at the very present time. It illustrates the strength and momentum ch
FREE
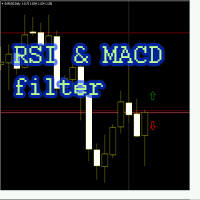
Советник "RSI and MACD filter" торгует по индикатору RSI, использует фильтр в качестве индикатора MACD (главная линия выше сигнальной - покупка, продажа - наоборот), по желанию Пользователя применяется мартингейл (количество умножения лота при серии убытков ограничивается), безубыток, трейлинг стоп, инвертирование сигнала. Настройки советника: Индикатор RSI: RSI_Period = 14; используемый период индикатора
RSI_Shift = 1; номер свечи выбранного графика, с которой советник берет сигнал, 0 -ориенти
FREE

Do not use Windows 7 with this EA MT4toTLGRM EA only sends text messages from Metatrader4 to a Telegram group or channel of your choice. From version 4.23 it sends messages to Discord, Twitter and Facebook. The messages are customizable to show information about any trading activity in the account. Also it shows a daily PnL report. Several instances of this EA can be used simultaneously in the same MT4 terminal for sending messages to different Telegram group/channel but ensure that each one ha
FREE
Perfected RSI (Relative Strength Index) HTF (Higher Time Frame) is perhaps the most advanced and reliable HTF indicator. Highly optimized in terms of execution, the indicator comes with standard settings of the RSI indicator which is supplied with the MT4 platform. Place the indicator on the chart, any timeframe. You may select a higher time frame in indicator inputs. The same indicator can be used on a chart multiple times to draw RSI from multiple timeframes or for different RSI period values
FREE

"WinWiFi All in Signal is designed based on the principles of Candlestick Consolidation (กระจุกตัว) and Price Expansion (กระจายตัว). By identifying these key behaviors on the M5 timeframe, traders can execute high-frequency entries with confidence. Our system eliminates timezone discrepancies between brokers, focusing purely on price action."
WinWiFi All in Signal – Master the M5 Gold Market "Unlock the power of Price Action with our $600 proven strategy. WinWiFi uses a unique logic of Candlest
FREE

マルチタイムフレーム対応、カスタマイズ可能なビジュアルシグナルおよび設定可能なアラートシステムを備えたDeMarkerインジケーター。
フリーランスプログラミングサービス、アップデート、その他のTrueTL製品は私の MQL5プロフィール からご利用いただけます。
フィードバックとレビューを心よりお待ちしております!
DeMarkerとは? DeMarkerインジケーターはトム・デマーク(Tom DeMark)によって開発され、現在のバー内の高値・安値を前回ローソク足のレンジと比較します。0から1の範囲で変動し、0.7以上は買われすぎ、0.3以下は売られすぎと見なされます。他のオシレーターとは異なり、終値のモメンタムを測定するのではなく、方向性のある極端な動きとバー内の疲弊に焦点を当てます。 DeMarkerのシグナルは、インジケーターが極値ゾーン(0.7および0.3)をクロスした時、またはインジケーターと価格の間にダイバージェンスが発生した時に生成されます。真の疲弊ポイントの特定において、単純なストキャスティクスより信頼性が高いとされています。 機能: 矢印と垂直線によるビジュ
FREE

* The product for MT5 converted using "BRiCK TradeByArrow MT4" is here. BRiCK is a simple and versatile utility.
By combining Experts, Indicators and utilities like the Lego block, various trading styles can be realized. "TradeByArrow" is Utility that executes order processing when an arrow object is created on the chart.
Combined with Indicator which outputs arrow object, it can be used like Expert.
Parameter
[ArrowName] EntryBuy: Arrow object name for buy order (partial match) EntrySel
FREE
マルチタイムフレーム対応、カスタマイズ可能なビジュアルシグナル、設定可能なアラートシステムを備えたMoney Flow Index(MFI)インジケーター。
フリーランスのプログラミングサービス、アップデート、その他のTrueTL製品は MQL5プロフィール でご利用いただけます。
フィードバックとレビューを大変感謝いたします!
MFIとは? Money Flow Index(MFI)は、特定の期間にわたって証券に流入・流出するマネーフローの強さを測る、ボリューム加重モメンタムオシレーターです。RSIと同様に機能しますが、ボリュームを組み込むことでより包括的なモメンタム指標となっています。値は0から100の範囲で変動します。 MFI値が80を超えると買われすぎ状態を、20を下回ると売られすぎ状態を示します。価格上昇時にMFIが上昇すればトレンドを確認し、MFIと価格の乖離は差し迫った反転を警告する可能性があります。ボリューム要素により、MFIはトレンドの燃え尽きを検出するのに特に効果的です。 機能: ボリューム加重モメンタム計算 矢印と垂直線によるビジュアルシグナルマーカー 設定
FREE

forex のトレードで広く使われるRSIをベースにロジックをデザインしました。
通常、RSIの値が買われすぐ、売られすぎのエントリーは有名ですが、トレンドが逆行した場合は、あまり効果的ではありません。
そこでその対策として、このEAは、RSIの値を元にエントリーしたあと、逆方向にマーケットが動いた場合、順張りのエントリーを行います。いわゆるグリッドオーダーですが、一定間隔ごとではなく、一定間隔ごとに、RSIの値が売られすぎの場合は、SELL売りの追加オーダーがでます。また逆に買われ過ぎの場合は、トレンドに沿ってBUY買いのオーダーがでます。
RSIの値に基づいたメインオーダーと、順張りのグリッドオーダーを持ちながらトレードを行い、それらすべてのオーダーがバスケットクローズされます。
バスケットクローズされる利益は0.01ロットが$1を基準に
トータルロットサイズから平均利益を自動計算しています。
また、ストップロスは低めの20PIPSに設定していますが、もしストップロスでオーダーがクローズした場合、次のロットを上げてトレードするいわゆるマーチンゲールの機能も備えています。
最適通貨
FREE
Having trouble marking where the various forex sessions start and end? Or perhaps your strategy requires you trade only in a specific session, then this is for you.
The session indicator shades the session you require in a certain color so that you can identify it easily. The sessions shown include: London session, New York session, Asian Session, Asian - London overlap and London - New York Overlap.
Difference source give varying time ranges for the various session, mostly differing by not mo
FREE
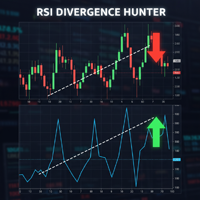
Powered by SVX Strategies Quant Team Divergences are among the most powerful signals in technical analysis, but spotting them in real-time is difficult and subjective. RSI Divergence Hunter automatically scans the market for these discrepancies between price and momentum. Eliminate Subjectivity, Automate Profit
Drawing lines manually leads to errors. If you prefer a fully automated, mathematical approach to trading, copy our official institutional algorithms: Copy "Friday Pulse" (Conservative/S
FREE

Follow the trail of the comet to know the development of the trend. This indicator helps you to determine the evolution of the price depending on how these astronomical objects are shown in the chart. When the comet seems to stop, it opens its tails considerably and warns us of a possible change in trend. On the contrary, when it seems to get speed (looks thin because lines of tail are grouped) demonstrates safety and continuity in trend. The head or comet nucleus will show red or green accordin
FREE
This indicator uses a formula based on bollinger bands to determine if the market is in Range or not. It can be used to filter entries and not operate in a sideways market.
It has a minimum value of 0.2 from which it could be operated, although you can modify it in the options to adjust it to your trading style or the market you use.
If the histogram below is red, the market is in range, if it is green, volatility is higher.
FREE

Simply Trailing Stop is a simple Expert Advisor that automatically trails stop on the chart that has been activated. It can be used as a complement to orders placed manually or through another expert advisor that does not perform a trailing stop, you only have to activate it in a new chart, not in the same one in which you already have your expert advisor but it will not work. You can see more of my products here: www.mql5.com/en/users/joaquinmetayer/seller
FREE

Arlene Sessions Background is an indicator that draws colored rectangles on the chart depending on your session, within the price range that has moved and when the sessions overlap, it will be painted in a color that will be the mixture of the colors of the respective sessions. You can see the version 2 here: https://www.mql5.com/en/market/product/68934
Inputs NumberOfDays AsiaBegin AsiaEnd AsiaColor EurBegin EurEnd EurColor USABegin USAEnd USAColor
If you only want to paint a session on your
FREE

This indicator works by plotting fractals on the chart as arrows that can be used as buy or sell signals. It is a great tool for both new and experienced traders as it provides a clear visual representation of the market and helps traders identify fractals. Although it repaints, it can be used quite effectively in conjunction with other tools to filter trading strategies.
We use this indicator in this way in our RoyalFractals II Expert Advisor, which you can purchase on the MQL5 Market: https:
FREE
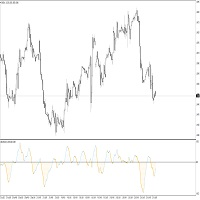
This indicator idea comes from Tushar Chande called Qstick.
Technical indicators quantify trend direction and strength in different ways.
One way is to use the difference between close and open for each bar and to sum it up over a period of time.
The formual is:
Qstick (period ) = Average ((close-open ), period )
In this indicator, we can choose how to calculate body by two famous chart types. The first and default indicator settings are based on Heiken Ashi chart, and the second is based
FREE

Metatrader 4 protection EA that limits profit Ways of working: * Aktif this EA to any pair in metatrader 4, you can start trade manual * Close all open orders if you have profit equity in money according to settings "Will close all open buy and sell orders regardless of profit or loss" * The EA/robot does not open orders, only closes orders if the settings are reached, this could be more or less due to market movements. For example, setting a profit of 5 $, the estimated profit can be 4.8 $ or
FREE

STOCHASTIC Dashboard Panel This indicator helps you to scan symbols which are in the Market Watch window and filter out a trend according to STOCHASTIC .
In technical analysis of securities trading, the stochastic oscillator is a momentum indicator that uses support and resistance levels. Dr. George Lane developed this indicator in the late 1950s.[1] The term stochastic refers to the point of a current price in relation to its price range over a period of time.[2] This method attempts to pre
FREE

MQL5ブログ: https://www.mql5.com/en/blogs/post/765148 MT4版: https://www.mql5.com/en/market/product/154458 MT5版: https://www.mql5.com/en/market/product/154459
期間限定無料
Telegram注文 [tambangEA] は、より速く、よりクリーンで、よりコントロールされた取引ワークフローを求めるトレーダーのために開発された、プロフェッショナルなセミマニュアル取引アシスタントです。
この製品は、既に独自の市場分析を行っており、取引の実行、管理、監視をより効率的に行う方法を必要としているトレーダー向けに設計されています。硬直的なブラックボックス戦略を押し付けるのではなく、取引判断を効率的な行動へと導く、実用的なチャートダッシュボードを提供します。
プレミアムなビジュアルレイアウト、クイックアクセスボタン、ライントリガー機能、シンボルチェンジャー、リアルタイム取引統計、そしてTelegram連携機能を備えたTelegram Orde
FREE

You have good intuitions, but you want more from your trade ... or you are a tireless hedger .
Would it be very useful for you if the TP moves further and further with configurable response times and offsets price ?
Imagine: You have a buy order on a bullish day on Dow Jones. You set a "take profit" at 200 points, but you know he can give you more!
Attach "Orions Move Target" to any chart and it will pass all the open orders in the terminal, moving them following these 3 trivial parameters:
1) "
FREE

UzFx-現地通貨換算ツール-MT4は、米ドルと現地通貨の両方で変動損益(P&L)と日次損益を追跡したいトレーダー向けに設計された、強力で使いやすいインジケーターです。このツールはユーザー定義の為替レートを用いたリアルタイム換算を提供し、トレーダーが取引パフォーマンスをより効果的に可視化するのに役立ちます。
主な機能
米ドルと現地通貨での損益をリアルタイムで表示。 日次損益計算 – 当日の決済済み取引の損益を追跡。 損益を希望の現地通貨(例:PKR、INR、AEDなど)に変換。 為替レートカスタマイズ – 正確な換算のため手動で為替レートを設定。 日次損失限度監視 – 日次損失限度額に達した際にアラートを発信。 深夜0時自動リセット – 取引日ごとに日次損益を自動リセット。 UI配置調整可能 – フォントサイズ・色・チャート上での位置を変更可能。
本インジケーターの利点
不要な手動換算や計算ミスを回避。 進行中・決済済み取引の利益を明確かつ体系的に可視化。 日次損失限度額の追跡によるリスク管理の強化。
注:本インジケーターは取引を実行しません。純粋に損益監視と通貨換算を目的
FREE
The purpose of this new version of the MT4 standard indicator provided in your platform is to display in a sub-window multiple timeframes of the same indicator. See the example shown in the picture below. But the display isn’t like a simple MTF indicator. This is the real display of the indicator on its timeframe. Here's the options available in the FFx indicator: Select the timeframes to be displayed (M1 to Monthly) Define the width (number of bars) for each timeframe box Alert pop up/sound/ema
FREE
The Swaps Indicator allows to monitor the swap rates of desired instruments in one place. There are several ways to choose the instruments list for the indicator: Select instruments from Market Watch Select all instruments Select instruments from the manually adjusted list All the setings color settings are adjustable in the indicator: you can set color for headers, for symbol names, for positive and negative swaps. There is also an ability to adjust the distance between the rows, columns and st
FREE
WONNFX create arrow tester. Сonstructor/Tester. Tester for buffer indicators. Converting a buffer indicator into an arrow signal on the chart. Combining two buffer indicators into one arrow signal. Filter by candle color. You can move the arrow signal several bars forward (useful in cases where the indicator gives signals 2-3 bars late
"WONNFX create arrow tester" is a tool designed specifically for traders who use buffer indicators in their trading strategies. This tester converts the buffer
FREE

This indicator is based on the MACD indicator
Also, some candlestick patterns are used in it to identify better signals
Can be used in all symbols
Can be used in all time frames
Easy to use method
Adequate settings
Settings: period: The number of candles used to calculate signals. pFast: Like the MACD indicator settings pSlow: Like the MACD indicator settings
alarmShow: If you want to receive an alert in Metatrader after receiving the signal, enable this setting alarmShowNoti: If you want to
FREE

A script that brings the cryptocurrency market to the MetaTrader platform. Make sure you have added the API address https://min-api.cryptocompare.com in the list of allowed URLs on tab 'Tools' → 'Options' → 'Expert Advisors'. After the script has successfully finished, go to menu and select 'File' → 'Open Offline', choose one of the generated timeframes (for example: BTCUSDBitst5 ) and click 'Open'. Now you can add your indicators or templates to customize the chart as you want.
Inputs Logging
FREE

Tired of using the same technical indicators? The "Tekno RSI" is an innovative tool designed to make the interpretation of the Relative Strength Index (RSI) more intuitive and accessible to traders of all levels. It displays the RSI as a 3-color histogram, providing a clear and intuitive visual representation of market conditions.
1)Key Features 3-Color Histogram: RSI is a versatile indicator providing insights into market direction and potential reversal points. However, when analyzing the cha
FREE
This is a free plug-in for Control-adora Expert adviser. It's main function is to create a Buy Stop arrow on the chart or a Sell Stop arrow when the price crosses above or below a trend line, which will allow Control-adora expert open a new trade when the desired lines will be crossed by the price.
Settings Prefix: Write here the prefix used to identify which trend lines are subject to be watched, value "Trendline" is set by default. Always use On Close Only: When set to true (by default) the c
FREE

平均トゥルー・レンジ( ATR )は、指定された日数における市場のボラティリティの指標です。 価格がレンジの端に達したとき、大きな継続的な動きを期待すべきではありません。 市場は燃料を使い果たしたと見なされます。価格が端に達していない場合は、まだ動きの余地があります。 このインジケータの計算式では、High-Lowレベルを全体でも個別 でも計算することができます。 また、これらのレベルをサポート/レジスタンスやターゲットと して使用することもできます。
入力パラメータ 。
Start Day (開始日) - 一日の開始を何時からカウントするか。00 - デフォルト。 ATR - 計算日数。 Calc Mode - 計算方法の選択(High-Low / High And Low)。
Visual Button - ボタン表示(有効/無効) 。 Corner - ボタンアンカー角度 。 X indent - ピクセル単位の水平パディング 。 Y indent - ピクセル単位の垂直パディング 。
Label Visual - 表示レベルラベル 。 Label F
FREE

THE_____ IIIDinoIIIIIPendelIII EA______
Set1: Price Offset: 100, Stop Loss 60, Take Profit 2000, "Object Chart Sub Window" 18:01- 18:03
Set2: Price Offset: 200, Stop Loss 60, Take Profit 2000, .".
Set1: Price Offset: 100, Stop Loss 60, Take Profit 2000,
Set2: Price Offset: 200, Stop Loss 60, Take Profit 2000,
Set3: Price Offset: 100, Stop Loss 60, Take Profit 1000,
Set4: Price Offset: 200, Stop Loss 60, Take Profit 1000, Indize: DE40 “FTMO" "E8" Recomment Broker
THIS EA „IIIDINOI
FREE
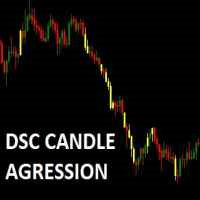
Corretora recomendada para usar esse indicador: https://tinyurl.com/5ftaha7c Indicador que pinta o candle de amarelo em pontos de muita agressão no mercado. Sempre que o mercado for se movimentar o candle irá ficar amarelo. Valido para todos ativos e todos timeframes. SEE OUR RESULTS ON INSTAGRAM: https://www.instagram.com/diogo.cansi/ TELEGRAM GROUP = https://t.me/robosdsc More information by email dscinvestimentos@gmail.com or by Whatsapp 55-991372299
FREE

Alerts utility issues notifications when orders are opened, closed and removed, as well as when the price touches the selected graphical objects on the chart. The utility supports all graphical objects used in graphical analysis and features a simple graphical interface. Once launched, the indicator works in the background, does not take up space on the chart and does not consume system resources. Tracking order status.
If tracking order status is enabled, the utility automatically checks order
FREE

This indicator highlights the exact points on the chart where the built-in ZigZag indicator repainted its peaks or troughs. Grey-colored arrows are plotted to show where a previously confirmed high or low was later shifted — a behavior known as repainting . Why it’s important:
Repainting can mislead traders by altering historical signals, giving a false impression of past accuracy. This tool helps traders visually track and understand when and where ZigZag repaints , improving strategy evaluati
FREE

This is a must have tool for every trader, because this indicator provides the scoreboard with most important basic information for trading. It displays current server time, remaining time of the current bar, a calculated lot for the specified risk and free margin, characteristic bar sizes, and spreads. When placed on a chart, the indicator creates a text label in the upper right corner with the following information: -17:50 [70%] 11:42:30 SL:0 SP:17 B:A41/M39/D67 L:0.26/5% remaining time to cur
FREE

Just Currency Strength is a simple, and easy to use as a market analysis tool. It could helps trader to understand the broder view of the market and forcasting the movemt of each currency symbol and trend direction of each specific currency pair. Parameters Timeframe (Move Timeframe box to move the pannel) Currency (Must NOT be less than 5 currencies) Refreshtime in second Colors Strong//Weak//Neutrial Alerts setting Alert On/Off Push notification On/Off Happy Trading...
FREE

Alba GMT Calibrator & Backtest Utility Stop guessing your broker's time zone. Start backtesting with surgical precision. In the world of algorithmic trading, the razor-thin margin between a highly profitable strategy and an inaccurate, failed backtest comes down to one critical factor: Timing . Many traders struggle with unreliable backtest simulations simply because they do not know their broker's true GMT offset. Using an incorrect time offset leads to distorted session opens, mistimed entry
FREE
MetaTraderマーケットはトレーダーのための自動売買ロボットやテクニカル指標を備えており、 ターミナルから直接利用することができます。
MQL5.community支払いシステムはMetaTraderサービス上のトランザクションのためにMQL5.comサイトに登録したすべてのユーザーに利用可能です。WebMoney、PayPal または銀行カードを使っての入金や出金が可能です。

取引の機会を逃しています。
- 無料取引アプリ
- 8千を超えるシグナルをコピー
- 金融ニュースで金融マーケットを探索