AverageTrueRange

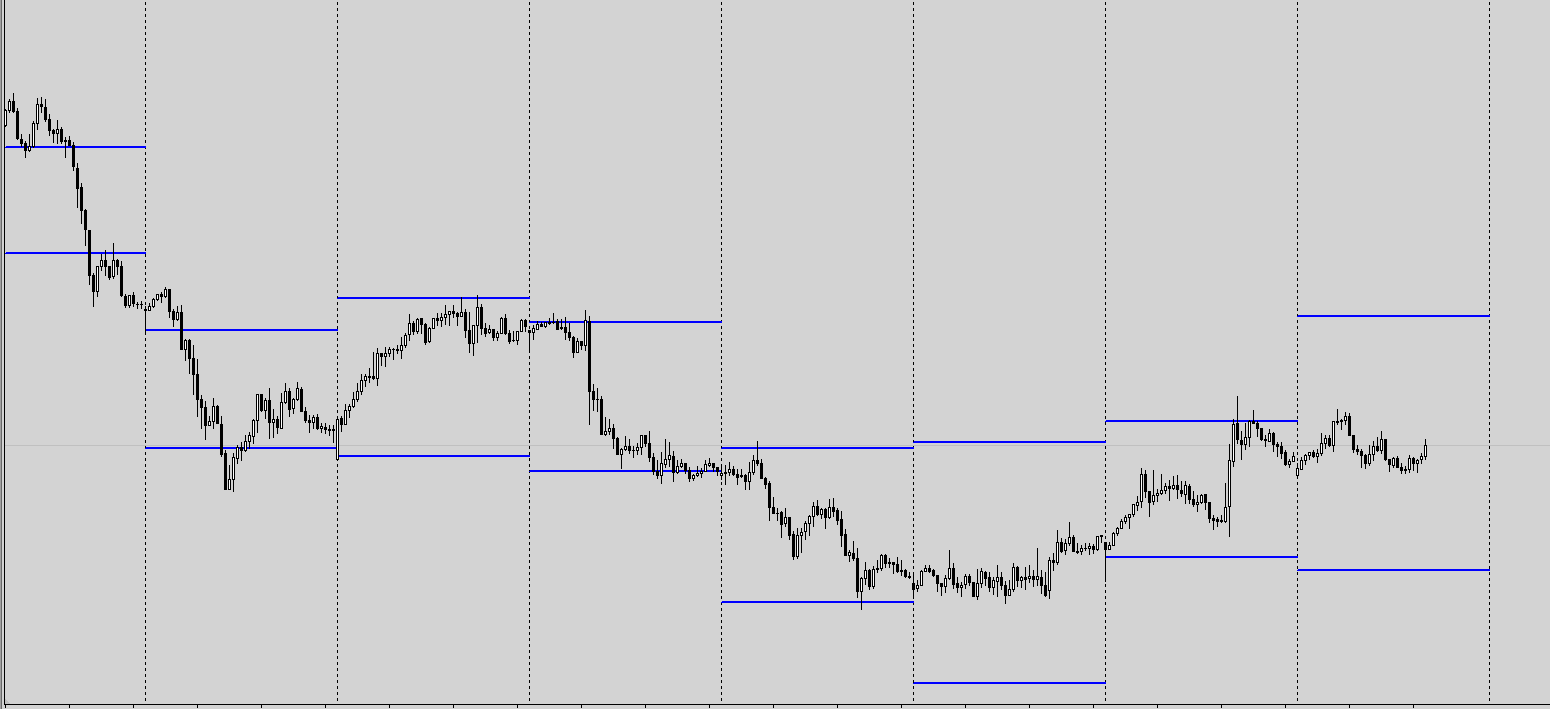
A simple but useful indicator for controlling volatility in intraday trading.

The indicator plots the average volatility (ATR) levels for the specified number of days on the current chart.

On the current trading day, the levels are dynamic and move depending on the minimum and maximum prices of the current day in "real time" mode.

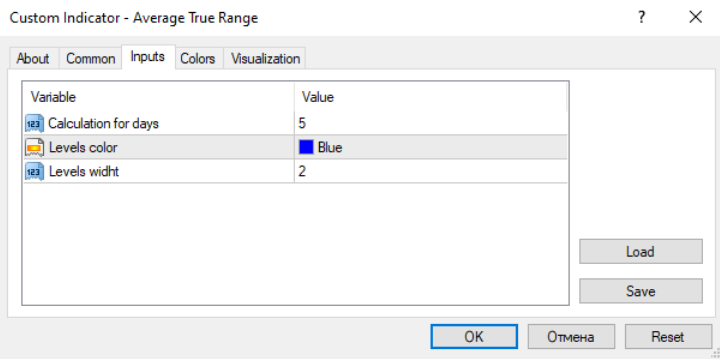
In the input parameters we specify:

- the number of days to calculate and draw the ATR levels

- color of the ATP level lines

- the thickness of the ATR level lines
おすすめのプロダクト
SpectorMA
Sergii Krasnyi
5 (1)
このインディケータは、チャートのビジュアルを向上させるだけでなく、チャートに躍動感やダイナミックさを与えます。このインジケータは、1つまたは複数の移動平均(MA)インジケータを組み合わ せたもので、常に色が変化し、カラフルで興味深い外観を作り出します。 この製品はグラフィカルなソリューションであるため、テキストでその機能を説明することは困難です。 このインジケーターは、ビデオ編集用にチャートの美しい画像を作成したいブロガーや、チャートを生き生きとカラフルにしたいトレーダーに適しています。 MAラインのカラーパレットは、虹のように変化したり、ランダムに変化したりします(設定したパラメータによる)。MAインジケータは、「MA期間」パラメータのステップを維持することで、独立に並び、美しい画像を作成します。 また、このインジケーターにはMA期間を常に変更する機能があり、チャートに活気とダイナミズムの効果を作り出すことができます。 ご清聴ありがとうございました。 ご清聴ありがとうございました。
FREE
MASi Three Screens is based on the trading strategy by Dr. Alexander Elder. This indicator is a collection of algorithms. Algorithms are based on the analysis of charts of several timeframes. You can apply any of the provided algorithms. List of versions of algorithms:     ThreeScreens v1.0 - A simple implementation, with analysis of the MACD line;     ThreeScreens v1.1 - A simple implementation, with analysis of the MACD histogram;     ThreeScreens v1.2 - Combines the first two algorithms in
FREE
FlatBreakout (Free Version) Flat Range Detector and Breakout Panel for MT4 — GBPUSD Only FlatBreakout is the free version of the professional FlatBreakoutPro indicator, specially designed for flat (range) detection and breakout signals on the GBPUSD pair only. Perfect for traders who want to experience the unique fractal logic of FlatBreakout and test breakout signals on a live market without limitations. Who Is This Product For? For traders who prefer to trade breakout of flat ranges (breakout,
FREE
Identify Trend
Aleksey Ivanov
4.09 (23)
トレンドの識別インジケータを使用すると、非常に正確に、そして最も重要なこととして、わずかな遅延で、(1)真のトレンドの動きの開始、および(2)フラットを識別できます。このような指標は、スキャルパー戦略による取引と長期取引戦略の使用の両方に使用できます。インディケーター操作アルゴリズムは、最後のスクリーンショットで詳しく説明されています。                              指標の読みは視覚的で非常に単純で、コメントを必要としません。インディケータの青い線は上昇トレンドを表し、金色の線はフラット、そして赤い線は下降トレンドです。したがって、赤または金の線が青に置き換えられた場合はBuyのエントリポイント、青または金の線が赤に置き換えられた場合はSell   - のエントリポイントです。               このインディケータにはあらゆる種類の警告があります。(トレンド方向の)インジケーターの表示が最後の2つのバーに一致すると、アラートがアクティブになります。                価格の動きの方向が変化する可能性のある瞬間も
FREE
The indicator analyzes the volume scale and splits it into two components - seller volumes and buyer volumes, and also calculates the delta and cumulative delta. The indicator does not flicker or redraw, its calculation and plotting are performed fairly quickly, while using the data from the smaller (relative to the current) periods. The indicator operation modes can be switched using the Mode input variable: Buy - display only the buyer volumes. Sell - display only the seller volumes. BuySell -
FREE
Are you tired of drawing trendlines every time you're analyzing charts? Or perhaps you would like more consistency in your technical analysis. Then this is for you. This indicator will draw trend lines automatically when dropped on a chart. How it works Works similar to standard deviation channel found on mt4 and mt5. It has 2 parameters: 1. Starting Bar 2. Number of bars for calculation The   starting bar   is the bar which drawing of the trend lines will begin, while the   number of bars for c
FREE
BoxInside MT4
Evgeny Shevtsov
4.83 (6)
This indicator calculates the volume profile and places labels that correspond to the VAH, VAL and POC levels, for each candle individually. Indicator operation features The indicator works on the timeframes from M5 to MN, but it uses the history data of smaller periods: M1 - for periods from M5 to H1, M5 - for the H4 period, M30 - for the D1 period, H4 - for the W1 period, D1 - for the MN period. The color and location of the VAL, VAH and POC labels on the current candle are considered to be c
FREE
外国為替マーケットプロファイル(略してFMP) これは何ではありません: FMPは、従来の文字コード化されたTPO表示ではなく、チャートデータプロファイルの計算全体を表示しません。また、チャートを期間に分割して計算しません。 それが何をするか: 最も重要なことは、FMPインジケーターは、ユーザー定義のスペクトルの左端とユーザー定義のスペクトルの右端の間にあるデータを処理することです。 ユーザーは、インジケーターの両端をマウスで引くだけでスペクトルを定義できます。 インジケーターの右端がライブバーに引き寄せられ、さらに(将来に)引っ張られると、インジケーターは「ライブ」と見なされます(新しいバーで更新されます) インジケーターは、アタッチされているチャートに「アンカー」オブジェクトをドロップし、その後、そのアンカーをハードドライブ上のファイルに関連付けます。 これにより、チャート(またはインジケーター)が閉じられるまで、再起動しても設定が維持された状態で、チャート上で継続的なFMPを実行できます。 FMPインジケーターは、1つのチャート上でそれ自体の多くのインスタンスを実行でき、
FREE
Market Profile 3
Hussien Abdeltwab Hussien Ryad
3 (2)
Market Profile 3 MetaTrader 4 indicator  — is a classic Market Profile implementation that can show the price density over time, outlining the most important price levels, value area, and control value of a given trading session. This indicator can be attached to timeframes between M1 and D1 and will show the Market Profile for daily, weekly, monthly, or even intraday sessions. Lower timeframes offer higher precision. Higher timeframes are recommended for better visibility. It is also possible t
FREE
PZ Penta O MT4
PZ TRADING SLU
2.33 (3)
The Penta-O is a 6-point retracement harmonacci pattern which usually precedes big market movements. Penta-O patterns can expand and repaint quite a bit. To make things easier this indicator implements a twist: it waits for a donchian breakout in the right direction before signaling the trade. The end result is an otherwise repainting indicator with a very reliable trading signal. The donchian breakout period is entered as an input. [ Installation Guide | Update Guide | Troubleshooting | FAQ | A
FREE
Free automatic Fibonacci is an indicator that automatically plots a Fibonacci retracement based on the number of bars you select on the BarsToScan setting in the indicator. The Fibonacci is automatically updated in real time as new highest and lowest values appears amongst the selected bars. You can select which level values to be displayed in the indicator settings. You can also select the color of the levels thus enabling the trader to be able to attach the indicator several times with differe
FREE
Not everyone can write an indicator. But anyone can have an idea. The indicator Universal Main Window Free , which takes as an input parameter the formula by which the indicator line will be drawn, will help to implement it. This indicator is intended for use in the main chart window. All indicators of the series Universal : Main window Separate window Free MT4 Universal Main Window Free MT5 Universal Main Window Free MT5 MT4 Universal Separate Window Free MT5 Universal Separate Window Free MT
FREE
マルチタイムフレーム対応、カスタマイズ可能なビジュアル信号、設定可能なアラートシステムを備えた相対力指数(RSI)インジケーター。 フリーランスプログラミングサービス、アップデート、その他のTrueTL製品は私の MQL5プロフィール からご利用いただけます。 フィードバックとレビューを心よりお待ちしております! RSIとは? 相対力指数(RSI)は、価格変化の速度と大きさを測定するモメンタムオシレーターです。このインジケーターは0から100の間で振動し、指定された期間にわたって最近の上昇幅と最近の下落幅の大きさを比較します。 RSIは主に買われすぎと売られすぎの状態を識別するために使用されます。高い値は買われすぎ状態を示し、低い値は売られすぎ状態を示します。トレーダーはまた、RSIと価格動作の間のダイバージェンスにも注目しており、これは潜在的なトレンド転換を示す可能性があります。 機能: 矢印と垂直線を使用したビジュアルシグナルマーカー 設定可能なトリガー付きの3つの独立したシグナルバッファ(方向変化、レベル交差、ピーク/谷、極端ゾーン) 時間帯フィルタリング付きの設定可能なア
FREE
The indicator analyzes the change in the minimum and maximum prices of the previous bars fixing the entrance of the big players. If the change (delta) increases, a signal is displayed on the graph in the form of an arrow. At the same time, virtual trade on history is carried out. In the free version, virtual trade is performed without refills in case of a repeat of the signal. The results of virtual trading in the form of losses / losses, profitability, drawdown and transaction lines are display
FREE
MACD indicator in MetaTrader 4/5 looks different than MACD does in most other charting software. That is because the MetaTrader 4/5 version of MACD displays the MACD line as a histogram when it is traditionally displayed as a line. Additionally, the MetaTrader 4/5 version computes the Signal line using an SMA, while according to MACD definition it is supposed to be an EMA. The MetaTrader 4/5 version also does not compute a true MACD Histogram (the difference between the MACD/Signal lines). This
FREE
Highlights trading sessions on the chart The demo version only works on the AUDNZD chart!!! The full version of the product is available at: (*** to be added ***) Trading Session Indicator displays the starts and ends of four trading sessions: Pacific, Asian, European and American. the ability to customize the start/end of sessions; the ability to display only selected sessions; works on M1-H2 timeframes; The following parameters can be configured in the indicator: TIME_CORRECTION = Correct
FREE
OrderBlock TS Roman
Vladislav Vlastovskii
3.8 (5)
Индикатор строит блоки заказов (БЗ) по торговой системе (ТС) Романа. Поиск блоков осуществляется одновременно на двух таймфремах: текущем и старшем (определяемым в настройках). Для оптимизации и игнорирования устаревших блоков в настройках задается ограничение количества дней в пределах которых осуществляется поиск блоков. Блоки строятся по правилам ТС состоящем из трех шагов: какую свечу вынесли (что?); какой свечой вынесли (чем?); правило отрисовки (как?).
FREE
The indicator has combined 5 popular strategies. Draws an arrow after confirming a signal for the selected strategy. There are signal alerts. Doesn't redraw its values. I recommend watching my advisor -   Night Zen EA 5 strategies. The main line crosses the signal line. The main line crosses the signal line in the oversold (for buy) / overbought (for sell) zones. The main line enters the oversold (for sell) / overbought (for buy) zones . The main line comes out of the oversold (for buy ) / over
FREE
1、能显示货币之间的强弱 0是最弱 7是最强 2、能显示28个货币以及黄金 原油的 涨跌幅度 3、能切换货币对 4、能显示持仓订单的货币对 1、能显示货币之间的强弱 0是最弱 7是最强 2、能显示28个货币以及黄金 原油的 涨跌幅度 3、能切换货币对 4、能显示持仓订单的货币对 5、能利用键盘的的上下键切换货币对,左右键切换周期 1、能显示货币之间的强弱 0是最弱 7是最强 2、能显示28个货币以及黄金 原油的 涨跌幅度 3、能切换货币对 4、能显示持仓订单的货币对 5、能利用键盘的的上下键切换货币对,左右键切换周期 5、能利用键盘的的上下键切换货币对,左右键切换周期 1、能显示货币之间的强弱 0是最弱 7是最强 2、能显示28个货币以及黄金 原油的 涨跌幅度 3、能切换货币对 4、能显示持仓订单的货币对 5、能利用键盘的的上下键切换货币对,左右键切换周期
FREE
This indicator has been created for finding the probable reversal points of the symbol price. A small candlestick reversal pattern is used it its operation in conjunction with a filter of extremums. The indicator is not redrawn! If the extremum filter is disabled, the indicator shows all points that have a pattern. If the extremum filter is enabled, the condition works – if the history Previous bars 1 candles back contains higher candles and they are farther than the Previous bars 2 candle, such
FREE
MT Supply Demand
Issara Seeboonrueang
4 (4)
We provide indicators tailored to better meet your trading requirements.       >>  MT Magical  << MT Supply Demand : It is an indicator created to find supply and demand, which will be important support and resistance levels for the price.  Supply Zone   is a zone where the price has reached, it is often resisted. In other words, when the price reaches this zone, there will be more selling power to push the price back down. Demand Zone   is a zone where the price has reached, it is ofte
FREE
このプロジェクトが好きなら、5つ星レビューを残してください。 このインジケータは、指定されたためのオープン、ハイ、ロー、クローズ価格を描画します 特定のタイムゾーンの期間と調整が可能です。 これらは、多くの機関や専門家によって見られた重要なレベルです トレーダーは、彼らがより多くのかもしれない場所を知るために有用であり、 アクティブ。 利用可能な期間は次のとおりです。 前の日。 前週。 前の月。 前の四半期。 前年。 または: 現在の日。 現在の週。 現在の月。 現在の四半期。 現年。
FREE
MTF Heiken Ashi MA is a multiple timeframe Heiken Ashi & Moving Average indicator. Fully customizable for advanced & unique Heiken Ashi & Moving Average calculations. Key Features Modified appearance and appeal from the traditional using only H eiken Ashi MA bodies. MTF Higher or lower timeframes available making this it great for trends and scalping. There are many settings that can be non-repaint for signals at a new bar and at bar 0. Inputs Timeframe  = PERIOD_CURRENT - timeframe of Moving
FREE
Zig Zag 123 tells us when a reversal or continuation is more likely by looking at the shift in supply and demand. When this happens a signature pattern appears known as 123 (also known ABC) will often break out in direction of higher low or lower high. Stop loss and take profit levels have been added. There is a panel that shows the overall performance of your trades for if you was to use these stop loss and take profit levels.  We get alerted if a pattern 123 appears and also if the price re
FREE
iMACD in iMA is indicator to change color in iMA if iMACD is upper of zero (up trend) or lower of zero (down trend). It is a useful tool to track when the upside and the downside iMACD on iMA. You can to get source code from here . Parameters MA_Periods — Period for iMA. MA_Method — Method for iMA. MACD_FastEMA — Fast EMA for MACD. MACD_SlowEMA — Slow EMA for MACD. MACD_SignalSMA — SMA signal for MACD. MACD_ApliedPrice — Price used for MACD. BarsCount — How many bars will show the line. Revers
FREE
This indicator alerts you when/before new 1 or 5 minute bar candle formed. In other words,this indicator alerts you every 1/5 minutes. This indicator is especially useful for traders who trade when new bars formed. *This indicator don't work propery in strategy tester.Use this in live trading to check functionality. There is more powerful Pro version .In Pro version,you can choose more timeframe and so on. Input Parameters Alert_Or_Sound =Sound ----- Choose alert or sound or both to notify y
FREE
This indicator help to mark the high and low of the session Asian,London,Newyork , with custom hour setting This indicator is set to count from minute candle so it will move with the current market and stop at the designated hour and create a accurate line for the day. below is the customization that you can adjust : Input Descriptions EnableAsian Enables or disables the display of Asian session high and low levels. EnableLondon Enables or disables the display of London session high and
FREE
Discover the power of precision and efficiency in your trading with the " Super Auto Fibonacci " MT4 indicator. This cutting-edge tool is meticulously designed to enhance your technical analysis, providing you with invaluable insights to make informed trading decisions. Key Features: Automated Fibonacci Analysis: Say goodbye to the hassle of manual Fibonacci retracement and extension drawing. "Super Auto Fibonacci" instantly identifies and plots Fibonacci levels on your MT4 chart, saving you tim
FREE
SignalFusion 5 Total market view in one chart. Monitor multiple pairs in real time, convert data into clear decisions, and spot opportunities for scalping, day trading, and swing. Works with majors like EUR/USD and GBP/USD and also exotics. Adds immediate value to any trader’s toolkit. 5 integrated indicators. Combines five signals into a single optimized list and runs by default with 9 pairs . Switching symbols is direct from parameters. After purchase, download for MT4/MT5 and use instan
FREE
Not everyone can write an indicator. But anyone can have an idea. The indicator Universal Separate Window Free , which takes as an input parameter the formula by which the indicator line will be drawn, will help to implement it. This indicator is intended for use in the separate chart window. All indicators of the series Universal : Main window Separate window Free MT4 Universal Main Window Free MT5 Universal Main Window Free MT5 MT4 Universal Separate Window Free MT5 Universal Separate Window
FREE
このプロダクトを購入した人は以下も購入しています
Gann Made Easy は、ミスター・ギャンの理論を使用した取引の最良の原則に基づいた、プロフェッショナルで使いやすい外国為替取引システムです。 W・D・ガン。このインジケーターは、ストップロスとテイクプロフィットレベルを含む正確な買いと売りのシグナルを提供します。 PUSH通知を利用して外出先でも取引可能です。 ご購入後、取引方法の説明と優れた追加インジケーターを無料で入手するには、私にご連絡ください! おそらく、ギャンの取引手法についてはすでに何度も聞いたことがあるでしょう。通常、ギャンの理論は初心者のトレーダーだけでなく、すでにある程度の取引経験がある人にとっても非常に複雑なものです。なぜなら、ギャンの取引手法は理論的にはそれほど簡単に適用できるものではないからです。私はその知識を磨き、最良の原則を私の外国為替インジケーターに組み込むために数年を費やしました。 このインジケーターは非常に簡単に適用できます。必要なのは、それをチャートに添付し、簡単な取引推奨事項に従うだけです。このインジケーターは常に市場分析の仕事を行い、取引の機会を探します。適切なエントリーポイントを検出す
M1 SNIPER は使いやすいトレーディングインジケーターシステムです。M1時間足向けに設計された矢印インジケーターです。M1時間足でのスキャルピングのためのスタンドアロンシステムとして、また既存のトレーディングシステムの一部としても使用できます。このトレーディングシステムはM1時間足での取引に特化して設計されていますが、他の時間足でも使用できます。元々、この手法はXAUUSDとBTCUSDの取引用に設計しましたが、他の市場においても役立つと考えています。 インジケーターのシグナルは、トレンドの方向と逆方向に取引できます。インジケーターのシグナルを利用して両方向に取引するのに役立つ特別な取引テクニックをご紹介します。この手法は、特別な動的なサポートとレジスタンスの価格帯を利用することに基づいています。 ご購入後、M1 SNIPER矢印インジケーターをすぐにダウンロードできます。さらに、M1 SNIPERツールのすべてのユーザーに、以下のスクリーンショットに表示されているApollo Dynamic SRインジケーターを無料で提供しています。この2つのインジケーターを組み合わせることで
Scalper Inside PRO – Since 2020. An exclusive indicator that utilizes an innovative algorithm to swiftly and accurately determine the market trend. The indicator automatically calculates opening, closing, and profit levels, providing detailed trading statistics. With these features, you can choose the most appropriate trading instrument for the current market conditions. Additionally, you can easily integrate your own arrow indicators into Scalper Inside Pro to quickly evaluate their statistics
Ultimate Sniper Dashboard
Hispraise Chinedum Abraham
4.82 (22)
299ドルで割引中! 今後値上げの可能性あり! 下の説明を読んでください! 究極のスナイパーダッシュボードのための最高のエントリーシステム。究極のダイナミックレベル。(私の製品をチェックしてください) 究極のスナイパーダッシュボードはMT4多通貨テスト制限のため、ライブマーケットでのみ作動します。 究極のスナイパーダッシュボードをご紹介します。HA-Sniper、MA-Sniper、その他多くの特別なモードが含まれる最高の製品です。究極のスナイパーダッシュボードは絶対的な獣です! 初心者やエキスパートトレーダーにとって最高のソリューションです。もう二度と動きを見逃さない! シンプルさとピップを愛するトレーダーのために、特別な製品をご用意しました。シンプルでありながら、ダッシュボードは複数のカスタムアルゴリズムに基づき28の通貨ペアを監視し、すべての作業を行います。たった一つのチャートで、プロのように市場を読み解くことができます。もし、為替ペアが動き出したときに、その方向性を正確に特定することができれば、あなたの取引はどれほど改善されることでしょう。   当社のシステムは、高い確率
After purchase, contact me privately to receive 1 month of free testing with EA Forex Proton! This advanced MT4 trading robot automatically executes signals from any MT4 indicator, including Market Makers. The latest version also includes AI integration, allowing each trade signal to be analyzed using Artificial Intelligence. Live Signal with EA Forex Proton: Click here Market Makers is a powerful price action trading system designed to identify high-probability Buy and Sell opportunities based
Trend Screener
STE S.S.COMPANY
4.79 (95)
トレンドインジケーター、1つのツールに組み込まれたすべての重要なトレンド機能を備えたトレンドトレーディングとフィルタリングのための画期的なユニークなソリューション! これは、すべてのシンボル/商品(外国為替、商品、暗号通貨、インデックス、株式)で使用できる100%再描画されていないマルチタイムフレームおよびマルチ通貨インジケーターです。 期間限定オファー: サポートおよびレジスタンス スクリーナー インジケーターは、たった 50 ドルで永久的にご利用いただけます。(元の価格 250 ドル) (オファー延長) トレンドスクリーナーは、チャート内のドットで矢印トレンドシグナルを提供するインジケーターに続く効率的なインジケーターです。 トレンド分析インジケーターで使用できる機能: 1.トレンドスキャナー。 2.最大利益分析を備えたトレンドライン。 3.トレンド通貨強度メーター。 4.アラート付きのトレンド反転ドット。 5.アラート付きの強いトレンドドット。 6.トレンド矢印 毎日の分析例、毎日のシグナルパフォーマンス...など、トレンドスクリーナーインジケーターを使用して、ここで見つけること
まず第一に、この取引インジケーターは再描画されず、再描画されず、遅延しないことを強調する価値があります。これにより、手動取引とロボット取引の両方に理想的なものになります。 ユーザーマニュアル:設定、入力、戦略。 アトミックアナリストは、価格の強さとモメンタムを利用して市場でより良いエッジを見つけるためのPA価格アクションインジケーターです。ノイズや誤ったシグナルを除去し、取引ポテンシャルを高めるための高度なフィルターを備えています。複雑なインジケーターの複数のレイヤーを使用して、アトミックアナリストはチャートをスキャンし、複雑な数学的計算をシンプルなシグナルと色に変換します。これにより、どのような初心者トレーダーでも理解して使用し、一貫した取引の決定を行うことができます。 「アトミックアナリスト」は、新規および経験豊富なトレーダー向けにカスタマイズされた包括的な取引ソリューションです。プレミアムインジケーターとトップノッチの機能を1つの取引戦略に組み合わせ、すべてのタイプのトレーダーにとって汎用性のある選択肢にします。 デイリートレーディングとスキャルピング戦略:高速で正確な
Super Signal – Skyblade Edition プロ仕様のノンリペイント / ノーラグ・トレンドシグナルシステム。卓越した勝率を実現 | MT4 / MT5 対応 1分足、5分足、15分足などの低い時間足で最も効果を発揮します。 主な特徴: Super Signal – Skyblade Edition は、トレンド取引に特化したスマートなシグナルシステムです。マルチレイヤーのフィルターロジックを用いて、明確な方向性と実際のモメンタムに支えられた強力なトレンドのみを検出します。 このシステムは 天井や底を予測するものではありません 。次の3つの条件がすべて満たされた場合にのみシグナルを発生させます: 明確なトレンド方向 モメンタムの増加 健全なボラティリティ構造 市場セッションに基づく流動性分析と組み合わせることで、シグナルの精度とタイミングがさらに向上します。 シグナルの特性: すべての矢印シグナルは 100% 非リペイント / 遅延なし 一度出現したシグナルは固定され、点滅・消失しません チャート上の矢印、情報パネル、ポップアップ通知、音声アラート、プッシュ通知
Trend indicator AI
Ramil Minniakhmetov
4.53 (83)
Trend Ai indicatorは、トレンドの識別と実用的なエントリポイントと反転アラートを組み合わせることで、トレーダーの市場分析を強化する優れたツールです。 この指標は、ユーザーが自信と正確さで外国為替市場の複雑さをナビゲートすることを可能にします トレンドAiインジケーターは、主要なシグナル以外にも、プルバックやリトレースメント中に発生するセカンダリエントリポイントを識別し、トレーダーが確立されたトレンド内の価格修正を活用できるようにします。 重要な利点: *MT4およびMT5の仕事 *明確な買いまたは売りシグナル *再描画しません ·すべての資産で動作します 私はeaやセットをtelegram it詐欺で販売しないように注意してください。 すべての設定はここでブログで無料です。  重要! 指示とボーナスを得るために購入後すぐに私に連絡してください! 私の他のプロダクトと同様、実質操作の監視はここに見つけることができます: https://www.mql5.com/en/users/mechanic/seller&nbsp ; 設定および入力: すべての
ON Trade Waves Patterns Harmonic Elliot Wolfeをご紹介します。これは手動および自動の方法を使用して市場のさまざまなパターンを検出するために設計された高度なインジケーターです。以下はその動作方法です: ハーモニックパターン: このインジケーターは、チャートに表示されるハーモニックパターンを識別できます。これらのパターンは、Scott Carneyの「Harmonic Trading vol 1および2」で説明されているように、ハーモニックトレーディング理論を実践するトレーダーにとって重要です。手動で描画するか、自動検出に頼るかにかかわらず、ON Trade Waves Patternsがお手伝いします。 コントロールパネル: このインジケーターはユーザーフレンドリーなコントロールパネルを備えています。チャートと時間枠の設定を保存し、異なる構成間をスムーズに切り替えることができます。チャートスペースを最大限に活用するために最小化することもできます。他の分析ツールで作業することを好む場合、閉じるボタンをクリックするだけで、すべてのインジケーターデ
「 Dynamic Scalper System 」インジケーターは、トレンド波の中でスキャルピング取引を行う手法のために設計されています。 主要通貨ペアと金でテスト済みで、他の取引商品との互換性があります。 トレンドに沿った短期的なポジションオープンのシグナルを提供し、追加の価格変動サポートも提供します。 インジケーターの原理 大きな矢印はトレンドの方向を決定します。 トレンド波の中では、小さな矢印の形でスキャルピングシグナルを生成するアルゴリズムが機能します。 赤い矢印は強気方向、青い矢印は弱気方向です。 トレンドの方向には敏感な価格変動ラインが描かれ、小さな矢印のシグナルと連動します。 シグナルは次のように機能します。適切なタイミングでラインが現れるとエントリーシグナルが形成され、ラインが開いている間はポジションが保持され、完了すると取引が終了します。 推奨される動作時間枠はM1~H4です。 矢印は現在のローソク足に形成され、次のローソク足が開いている場合は、前のローソク足の矢印は再描画されません。 入力パラメータ Trend Wave Period - トレンド方向
PRO Renko Systemは、特別にRENKOチャートを取引するために設計された高精度の取引システムです。 これは、様々な取引商品に適用することができる普遍的なシステムです。 システムは効果的に正確な逆転信号へのアクセスを与えるいわゆる市場の騒音を中和する。 表示器は非常に使いやすく、信号の生成に責任がある1つの変数だけがあります。 あなたは簡単にお好みの任意の取引ツールとレンコバーのサイズにツールを適応させることができます。 私はいつもあなたが私のソフトウェアで収益性の高い取引を支援するために余分なサポートを提供する準備ができています! 私はあなたに幸せで収益性の高い取引をしたいです! ご購入後にご連絡ください! 私はあなたに私のレンコチャートジェネレータを送信します。 私はまた、私の個人的な推奨事項やシステムの他のモジュールを無料で共有します!
説明書(ロシア語)  /  説明書 (英語)  /  バージョン MT5 主な機能: 売り手と買い手のアクティブなゾーンを表示します。 このインジケーターは、買いと売りの適切な最初のインパルスレベル/ゾーンをすべて表示します。これらのレベル/ゾーンがアクティブになると、エントリーポイントの探索が始まり、レベルの色が変わり、特定の色で塗りつぶされます。状況をより直感的に把握できるように、矢印も表示されます。 LOGIC AI - テンプレートをアクティブ化するときにエントリポイントを検索するためのゾーン(円)の表示 視認性を向上させるため、人工知能を用いて進入ポイントを探索したゾーンを表示する機能が追加されました。 より高い時間枠からのレベル/ゾーンの表示(MTFモード) より長い時間間隔でレベル/ゾーンを表示する機能を追加しました。また、インジケーターに自動トレンド検出機能(   TPSproTREND PRO   )を実装しました。 取引のための個別の専門的なステップバイステップのアルゴリズム このアルゴリズムは、トレンドの方向と逆方向の両方でデイトレードを行うために設計されていま
BTMM State Engine Pro is a MetaTrader 4 indicator for traders who use the Beat The Market Maker approach: Asian session context, kill zone timing, level progression, peak formation detection, and a multi-pair scanner from a single chart. It combines cycle state logic with a built-in scanner dashboard so you do not need the same tool on many charts at once. What it does Draws the Asian session range; session times can follow broker server offset or be set in inputs. Tracks level progression (L
Linear Trend Predictor ー - エントリ ポイントと方向サポート ラインを組み合わせたトレンド インジケーター。高値/安値チャネルを突破するという原理に基づいて機能します。 インジケーターのアルゴリズムは市場のノイズをフィルタリングし、ボラティリティと市場の動向を考慮します。 インジケーターの機能  平滑化手法を使用して、市場のトレンドと、買い注文または売り注文を開くためのエントリー ポイントを表示します。  任意の時間枠のチャートを分析して、短期および長期の市場の動きを判断するのに適しています。  あらゆる市場や時間枠に適応可能な入力パラメータにより、トレーダーはインジケーターを独自にカスタマイズできます。  設定されたインジケーター信号は消えず、再描画もされません。ローソク足の終値で決定されます。  いくつかの種類の通知が矢印と組み合わされています。  このインジケーターは、独立した取引システムとして使用することも、他の取引システムへの追加として使用することもできます。  あらゆるレベルの経験を持つトレーダーが使用できます。 主なパラメータ Vol
現在40%オフ 初心者やエキスパートトレーダーに最適なソリューション! このインジケーターは、独自の機能と新しい計算式を取り入れた、ユニークで高品質、かつ手頃な価格のトレーディングツールです。たった1枚のチャートで28の為替ペアの通貨強度を読み取ることができます。新しいトレンドやスキャルピングチャンスの引き金となるポイントを正確に特定することができるので、あなたのトレードがどのように改善されるか想像してみてください。 ユーザーマニュアルはこちら  https://www.mql5.com/en/blogs/post/697384 これが最初の1本、オリジナルだ! 価値のないクローンを買わないでください。 特別な サブウィンドウの矢印で強い通貨の勢いを表示 GAPがあなたのトレードを導く! 基準通貨や気配値が売られすぎ・買われすぎのゾーン(外相フィボナッチレベル)にあるとき、個別チャートのメインウィンドウに警告表示。 通貨がレンジの外側から反落した場合、プルバック/リバーサルのアラート。 クロスパターンの特別なアラート 複数の時間枠を選択可能で、トレンドを素早く確認できます
Easy Breakout
Mohamed Hassan
4.71 (14)
After your purchase, feel free to contact me for more details on how to receive a bonus indicator called VFI, which pairs perfectly with Easy Breakout for enhanced confluence!    Easy Breakout is a powerful price action trading system built on one of the most popular and widely trusted strategies among traders: the Breakout strategy ! This indicator delivers crystal-clear Buy and Sell signals based on breakouts from key support and resistance zones. Unlike typical breakout indicators, it levera
Volatility Trend System - a trading system that gives signals for entries. The volatility system gives linear and point signals in the direction of the trend, as well as signals to exit it, without redrawing and delays. The trend indicator monitors the direction of the medium-term trend, shows the direction and its change. The signal indicator is based on changes in volatility and shows market entries. The indicator is equipped with several types of alerts. Can be applied to various trading ins
トレンドラインプロ   市場の真の方向転換点を理解するのに役立ちます。この指標は、真のトレンド反転と主要プレーヤーが再び参入するポイントを示します。 分かりますか     BOSライン   複雑な設定や不要なノイズなしに、より長い時間足でのトレンドの変化と重要なレベルを把握できます。シグナルは再描画されず、バーが閉じた後もチャート上に残ります。 VERSION MT 5     -     RFI LEVELS PRO インジケーター と組み合わせることで、その潜在能力を最大限に発揮します。 インジケーターが示す内容: 本当の変化   トレンド(BOSライン) 一度シグナルが現れたら、それは有効です!これは、リペイント機能を持つインジケーターとの重要な違いです。リペイント機能を持つインジケーターは、シグナルを発した後、それを変更し、資金の損失につながる可能性があります。これにより、より高い確率と精度で市場に参入できます。また、矢印が現れた後、目標値(利益確定)に達するか、反転シグナルが現れるまで、ローソク足の色を変更する機能もあります。 繰り返しエントリ       主要プレーヤーの
GOLD Impulse with Alert
Bernhard Schweigert
4.67 (12)
このインディケータは、当社の2つの製品 Advanced Currency IMPULSE with ALERT  +   Currency Strength Exotics . のスーパーコンビネーションです。 このインジケーターは全ての時間枠で作動し、8つの主要通貨と1つのシンボルの強弱のインパルスをグラフで表示します。 このインジケータは、金、エキゾチックペア、商品、インデックス、先物など、あらゆるシンボルの通貨強度の加速度を表示することに特化されています。金、銀、原油、DAX、US30、MXN、TRY、CNHなどの通貨強度の加速度(インパルスまたは速度)を表示するために、任意のシンボルを9行目に追加できる、この種の最初のものです。 新しいアルゴリズムに基づいて構築され、潜在的な取引の特定と確認がさらに容易になりました。これは、通貨の強さや弱さが加速しているかどうかをグラフィカルに表示し、その加速の速度を測定するためです。加速すると物事は明らかに速く進みますが、これはFX市場でも同じです。つまり、反対方向に加速している通貨をペアリングすれば、潜在的に利益を生む取引を特定
Order Block Hunter
Noha Mohamed Fathy Younes Badr
5 (10)
Order block hunter indicator is the best indicator for  hunt the order blocks that area where there has been a large concentration of limit orders waiting to be executed Order blocks are identified on a chart by observing previous price action and looking for areas where the price experienced significant movement or sudden changes in direction .This indicator does that for you by using very complicated codes and helps you to take the best areas To buy and sell because it make marks at the best a
- Real price is 80$ - 40% Discount (It is 49$ now) Contact me for instruction, add group and any questions! - Non-repaint - I just sell my products in Elif Kaya profile, any other websites are stolen old versions, So no any new updates or support. - Lifetime update free Related product:   Bitcoin Expert Introduction The breakout and retest strategy is traded support and resistance levels. it involves price breaking through a previous level.  The break and retest strategy is designed to help tr
KT Gaussian Trend Filter は、ガウスフィルターと線形回帰スムージングを組み合わせることで、明確かつ正確なトレンド分析を実現します。わかりやすい買いと売りのシグナルを生成しながら、市場の長期的な方向性を効果的に示します。 機能 カスタマイズ可能なガウスフィルター: 期間やポール設定を調整してスムージング精度を高め、トレンドの明瞭さを向上。 線形回帰による強化: ガウススムージングをさらに最適化し、市場のノイズによる誤信号を最小限に抑えます。 マルチタイムフレームスキャナー: 複数の時間軸におけるガウストレンドの方向を自動検出し、わかりやすいダッシュボードに表示します。 トレーリングバンド機能: トレンド中の深い押し目でのエントリーポイントを簡単に把握可能。 カラーカスタマイズ対応: チャートの配色や取引スタイルに合わせて色を自由に設定できます。 内蔵アラート機能: ポップアップ、メール、プッシュ通知、サウンドアラートで即時通知を受け取れます。 使い方 このインジケーターは明確なシグナルを提供し、トレーダーがエントリーやエグジットのタイミングを判断しやすくします
Special offer : ALL TOOLS , just $35 each! New tools   will be   $30   for the   first week   or the   first 3 purchases !  Trading Tools Channel on MQL5 : Join my MQL5 channel to update the latest news from me ボリュメトリックオーダーブロック多時間枠 インジケーターは、主要な市場参加者が注文を蓄積する重要な価格エリアを特定することで、より深い市場の洞察を求めるトレーダー向けに設計された強力なツールです。これらのエリアはボリュメトリックオーダーブロックとして知られており、サポートやレジスタンスの潜在的ゾーンとして機能し、取引の意思決定において重要な優位性を提供します。 MT5バージョンを見る:   Volumetric Order Blocks MT5 Multi Timeframe See more products at:   https://www.mql5.com/en
Advanced Supply Demand
Bernhard Schweigert
4.91 (299)
現在40%オフ 初心者にもエキスパートトレーダーにも最適なソリューション このインジケーターは独自の機能と新しい公式を多数内蔵しており、ユニークで高品質かつ手頃な取引ツールです。このアップデートでは、2つの時間枠ゾーンを表示できるようになります。より長いTFだけでなく、チャートTFとより長いTF(ネストゾーンを表示)の両方を表示できます。すべてのSupply Demandトレーダーの皆さんのお気に召すはずです。:) 重要情報の公開 Advanced Supply Demandの可能性を最大化するには、 https://www.mql5.com/ja/blogs/post/720245 にアクセスしてください。   エントリーまたはターゲットの正確なトリガーポイントを正確に特定できれば取引がどのように改善されるか想像してみてください。新しい基盤となるアルゴリズムに基づいて構築されているため、買い手と売り手の間の潜在的な不均衡をさらに簡単に特定できます。これは、最も強い需要と供給のゾーンと、過去のパフォーマンス(古いゾーンを表示)がグラフィカルに表現されるためです。これらの機能は、最適な
Route Lines Prices -は、価格の方向性を予測するために設計されたインジケーターです。シンプルなインターフェースには、価格変動と将来の方向性を計算するための複数のアルゴリズムが搭載されています。これらのアルゴリズムには、使用する時間枠に基づいたボラティリティ計算と価格平滑化が含まれています。 このインジケーターには、「 Calculating price values 」値を変更するためのパラメーターが1つだけあります。デフォルト値の1は、バランスの取れた自動計算を提供し、インジケーターを手動で設定することなく使用できます。 値を2から500まで手動で変更することで、インジケーターを独自のトレーディングシステムに合わせてカスタマイズできます。 このインジケーターは、M1からH4の時間枠での使用を推奨します。あらゆる取引銘柄で使用できます。 シグナル矢印はローソク足の終値で生成され、過去の履歴には再描画されません。 メインチャートには、重複した矢印が表示されます。 複数のアラートタイプが利用可能です。内蔵のライン軌跡カウンターは、終値に基づいて動作します。これ
Stratos Pali
Michela Russo
4.43 (7)
Stratos Pali Indicator   is a revolutionary tool designed to enhance your trading strategy by accurately identifying market trends. This sophisticated indicator uses a unique algorithm to generate a complete histogram, which records when the trend is Long or Short. When a trend reversal occurs, an arrow appears, indicating the new direction of the trend. Important Information Revealed Leave a review and contact me via mql5 message to receive My Top 5 set files for Stratos Pali at no cost! Dow
現在40%OFF! 初心者やエキスパートトレーダーのためのベストソリューション! このダッシュボードソフトウェアは、28の通貨ペアで動作しています。それは私達の主要な指標(高度な通貨の強さ28と高度な通貨インパルス)の2に基づいています。それは全体の外国為替市場の大きい概観を与えます。それは、すべての(9)時間枠で28の外国為替ペアのための高度な通貨の強さの値、通貨の動きの速度と信号を示しています。チャート上で1つのインディケータを使用して市場全体を観察し、トレンドやスキャルピングの機会をピンポイントで見つけることができたら、あなたのトレードがどのように改善されるか想像してみてください。 このインディケータには、強い通貨と弱い通貨の識別、潜在的な取引の識別と確認がより簡単になるような機能が搭載されています。このインディケータは、通貨の強さや弱さが増加しているか減少しているか、また、すべての時間枠でどのように機能しているかをグラフィカルに表示します。 新機能として、現在の市場環境の変化に適応するダイナミックなマーケットフィボナッチレベルが追加され、すでに当社のAdvanced
これは、キャンドルの終値を予測する指標です。 このインジケータは、主にD1チャートでの使用を目的としていますが. この指標は、従来の外国為替取引とバイナリオプション取引の両方に適しています。 インジケーターは、スタンドアロンのトレーディングシステムとして使用することも、既存のトレーディングシステムへの追加として機能させることもできます。 このインジケーターは、現在のキャンドルを分析し、キャンドル自体の内部の特定の強度係数と、前のキャンドルのパラメーターを計算します。 したがって、この指標は、市場の動きのさらなる方向性と現在のキャンドルの終値を予測します。 この方法のおかげで、この指標は、短期の日中取引だけでなく、中期および長期の取引にも適しています。 インジケーターを使用すると、市場の状況の分析中にインジケーターが生成する潜在的な信号の数を設定できます。 インジケーターの設定には、このための特別なパラメーターがあります。 また、インジケーターは、チャート上のメッセージの形式で、電子メールで、およびPUSH通知の形式で、新しい信号について通知することができます。 購入後は必ず私に書いて
Volumatic Fair Value Gaps   is a precision-engineered indicator for identifying, analyzing, and visualizing   Fair Value Gaps (FVGs)   backed by volume intelligence. This tool goes beyond standard FVG plotting by dissecting volume dynamics inside each gap using   lower-timeframe sampling , offering clear insight into whether bulls or bears dominate the imbalance. Designed for technical traders, this indicator overlays high-probability gaps only, visualizes   bullish vs. bearish volume compositio
作者のその他のプロダクト
Простой, но полезный индикатор для контроля волатильности при внутридневной торговле. Индикатор наносит на текущий график уровни средней волатильности (ATR) за указанное количество дней. На текущем торговом дне уровни динамические и перемещаются в зависимости от минимума и максимума цены текущего дня в режиме "реального времени". Во входных параметрах мы задаем: - количество дней для расчета и отрисовки уровней среднего АТР - цвет линий уровней среднего АТР - толщину линий уровней среднего АТР
FREE
Informing the user about the size of the current spread. A simple and convenient informant. You can place it anywhere on the chart (configurable in the input parameters). Input parameters: - text color - text size - text style - binding to the corner of the graph - horizontal offset from the anchor point - vertical offset from the anchor point - enabling (disabling) the "Show as background" function Have a good trade to everyone!
FREE
Простая и полезная утилита для нанесения меток на открытые сделки. При запуске скрипта он ищет все открытые сделки и наносит метки на время и цену открытия сделки. Сделки в лонг обозначаются синим цветом, сделки в шорт обозначаются красным цветом. Есть два варианта нанесения меток: - с учетом текущего спрэда (по Ask) - без учета текущего спрэда (по Bid) Входных параметров нет. Всем профита!
FREE
Информирование пользователя о величине текущего спрэда цветом, в зависимости от тренда. Простой и удобный информатор. Расположить можно в любом месте графика (настраивается во входных параметрах). При активном индикаторе наносим на график горизонтальную линию цветом, указанным во входных параметрах. Эта линия будет (по Вашему мнению) точкой разворота тренда. Если цена будет ниже линии - цвет величины спрэда будет окрашен в цвет "медвежьего" тренда, если цена буде выше линии - цвет величины спрэ
FREE
SL InfoPanel is an information panel that displays operational trading information on the current instrument. The panel contains the following information: The first column: The fixed profit for the specified period of time and the percentage of this profit to the current deposit (the time period is configured in the "Account History"). The value is colored blue if there is a profit and red if there is a loss. Open Long orders (number of lots/number of orders). Open Short orders (number of l
フィルタ:
jiab
436
jiab 2023.11.10 06:43 
 

ユーザーは評価に対して何もコメントを残しませんでした

レビューに返信