YouTubeにあるマーケットチュートリアルビデオをご覧ください
ロボットや指標を購入する
仮想ホスティングで
EAを実行
EAを実行
ロボットや指標を購入前にテストする
マーケットで収入を得る
販売のためにプロダクトをプレゼンテーションする方法
MetaTrader 4のためのエキスパートアドバイザーとインディケータ - 72

This indicator is based on the Channel . Input Parameters channel_One- show trend line One on or off. timeFrame_One - time Frame of channel One . ColorChannel_One - color of trend line One. channel_Two- show trend line Two on or off. timeFrame_Two - time Frame of channel Two . ColorChannel_Two - color of trend line Two. channel_Three- show trend line Three on or off. timeFrame_Three - time Frame of channel Three . ColorChannel_Three - color of trend line three. channel_Four- show trend line F
FREE
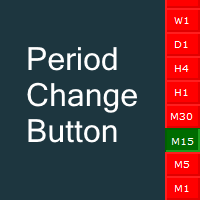
Fastest way to change the period. Suitable for traders who use many charts and timeframes. Size, shape and color can be customized.
Inputs Parameters Corner — Choose corner placement Standart is "Right lower chart corner" Color — Background color of the button ColorText — Text color of the button ColorOn — Background color of the button for the current period ColorOnText — Text color of the button for the current period Font — Arial, Verdana... FontSize — Size of the font in pixels DistanceX —
FREE

<LOGIC> EA will place order based on the original logic. This EA should work with take profit and stoploss. Default TP is 50pips and SL is 50pips.
If the order was closed with stoploss, EA will stop in that day. Next day, EA will restart and trade again with lot size increasing. Lot size and volume multiple is changeable in the parameters.
<Best Pair and TF> EURUSD and GBPUSD TF H1
<Default set> Already optimized
TP 50pips SL 50pips Martingale Volume muti X 2 Max martingale 5
FREE

This is an implementation of the market cycle indicator described by Raghee Horner in the book "Forex Trading for Maximum Profit" . The current state of the market can be determined by analyzing the inclination angle of the exponential moving average (EMA) running on a period of 34 bars. If the EMA inclination is defined as the direction of the hour hand on the dial from 12 to 2 hours, then an uptrend is considered to be present; from 2 to 4 hours, the market consolidates; from 4 to 6 hours, a d
FREE

Dynamic Price Volatility Indicator (DPVI)
The Dynamic Price Volatility Indicator (DPVI) is designed to provide traders with valuable insights into market volatility and potential price movements. It combines elements of volatility analysis and trend identification to assist traders in making informed trading decisions.
Features: Dynamic Volatility Bands: utilizes a proprietary algorithm to calculate dynamic volatility bands that adjust in real-time based on market conditions. These bands act a
FREE

it is hard to do full margin strategy in MT4, because you cannot close all orders easily. Unlock the power of full margin trading with confidence using FullMargin RiskGuard , a cutting-edge Expert Advisor (EA) designed specifically for beginner traders on the MetaTrader 5 platform. Inspired by the renowned trading style of Papip Celebes, this EA empowers users to execute full trade strategies while safeguarding their capital with advanced risk management features. Key Features: MaxFloatingLos
FREE

Do you need precision? Tick charts show each change in the ask or bid; The chart updates whenever either price changes. Study the markets more deeply, with surgical precision. Tick Chart Window saves all the received ticks and shows them into a seperate window. Get the best entry price in the Market. trade with precision trade good Spread Register In the comment section you will see the highest spread, the lowest spread and the average spread since the indicator was loaded.
FREE

This scanner shows the trend values based on crossovers of two moving averages for up to 30 instruments and 8 time frames. You can get alerts via MT4, Email and Push-Notification as soon as the direction of the trend changes. This is the FREE version of the indicator: https://www.mql5.com/en/market/product/29159
Important Information How you can maximize the potential of the scanner, please read here: www.mql5.com/en/blogs/post/718074
You have many possibilities to use the scanner. Here are tw
FREE

Note: This is a Limited Edition of Lion Grid . It works only on Mondays.
The trading strategy has been been created by using machine learning algorithms to build a model directly from the historical data. Machine learning is an application of artificial intelligence (AI) that provides the ability to automatically learn and improve from experience without being explicitly programmed. The strategic focus of this robot is to identify trend reversals by analyzing multiple technical indicators (
FREE

Welcome to the free Bull Vs Bear Professional Combiner Binary Options and Forex Indicator project. This is a free AI, the most powerful in its category for MT4, with 43 strategies, 30 filters, support for 10 external indicators and 10 external bots, developed to operate in the Forex and Binary Options markets.
↓ Bull vs Bear API Indicator ↓ Telegram4Mql.dll ↓ Bull vs Bear EA Forex
Download:
@bullvsbearcombine
Site:
bullvsbearcombiner
FREE

MTF Trader EA uses several Bollinger Bands indicators for filtering and MAs for trigger. Symbol: GBPCAD. Timeframe: 1H. Deposit: 300 and higher. All trades covered by fixed Stop Loss and Take Profit . No Grid. No Martingale. Works with high spread This EA operates only once per bar opening. Fast methods of strategy testing and optimization are valid. User can test / optimize by model: (control point) / (open prices only) developed, tested and optimized from 2010 to release d
FREE
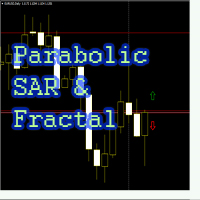
Советник "Parabolic SAR and Fractal" торгует по двум индикаторам: 1.Parabolic SAR, 2.Fractal
Сделка на покупку: если образовался нижний фрактал и цена находится выше точек индикатора Parabolic SAR
Сделка на прордажу: если образовался верхний фрактал и цена находится ниже точек индикатора Parabolic SAR
По желанию Пользователя применяется мартингейл (количество умножения лота при серии убытков ограничивается), пирамидинг, безубыток, трейлинг стоп, возможно настроить, как скальпирующий сове
FREE

This indicator helps you determine the evolution of the price depending on how these fly objects are shown in the chart. When the gliders opens their wings considerably warns us of a possible change in trend. On the contrary, when seems to get speed (looks thin because lines of wings are grouped) demonstrates safety and continuity in trend. Each wing of a glider is a directrix between the closing price and the high/low prices of the previous bar. The color (green/red) of each glider foresees bet
FREE

This indicator is the translated version of Anıl ÖZEKŞİ's MOST Indicator, developed on the Matriks Data Terminal, into the MQL4 language. It is a trend-following indicator and quite successful. Its usage will be free and unlimited for a lifetime. You can click on my profile to access the MQL5 version of this indicator. You can also get your programming requests for MQL4 and MQL5 languages done at İpek Bilgisayar with an invoiced service. You can reach İpek Bilgisayar at www.ipekbilgisayar.org .
FREE

The MAtrio indicator displays three moving averages on any timeframe at once with a period of 50-day, 100-day, 200-day. After attaching to the chart, it immediately displays three moving averages with the parameters of simple (SMA) moving average SmoothingType50 , simple (SMA) moving average SmoothingType100 , simple (SMA) moving average SmoothingType200 . Accordingly, with the price type ValuePrices50, ValuePrices100, ValuePrices200 , by default, the price is Close price everywhere. All parame
FREE

this tool draws horizontal lines starting from a price you specify in the Inputs. you can draw Horizontal lines above or below or (both sides) the starting price. Based on (The Quarters Theory by Ilian Yotov), this tool displays colored lines at fixed intervals which you can change from the inputs. you can use many sets of Horizontal lines each set of Horizontal lines has its own color and style.
FREE

I like a simple Robot and I will share with you. I can provide some information about using Simple Moving Average (SMA) as a trading strategy in Forex. SMA is a commonly used technical analysis tool in Forex trading. It calculates the average price of a currency pair over a specified period of time, and the resulting line can be used to identify trends in the market. Traders often use the crossover of different time period SMAs (e.g. 50-day and 200-day) to identify potential buy or sell signals.
FREE

Engulfing candlestick patterns are comprised of two bars on a price chart. They are used to indicate a market reversal. The second candlestick will be much larger than the first, so that it completely covers or 'engulfs' the length of the previous bar.
By combining this with the ability to look at trend direction this indicator eliminates a lot of false signals that are normally generated if no overall trend is taken into consideration
FREE
"Visual Range - Spread Indicator". This Indicator is an Essential Tool for Manual trading. it helps to avoid "off price" and "bad" entries caused by abnormally High spreads. ...................................................................................................................... At the Market Opening and News Reports - the Size of the Spread can go temporarily widely High. The Indicator shows the current Size of the Spread visually on the chart and its distance from the current pr
FREE
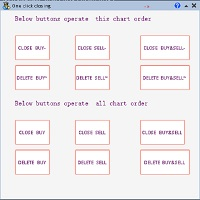
一键平仓小工具,可以针对买单、卖单和挂单进行批量操作,可以操作当前图表订单和所有订单,简单高效。 第一行第一个按钮是关闭当前图表 品种 所有买单,第二个按钮是关闭当前图表品种的所有卖单,第三个按钮是关闭当前图表 品种 的所有订单; 第二行 第一个按钮是删除当前图表 品种 所有买单挂单,第二个按钮是 删除 当前图表品种的所有卖单 挂单 ,第三个按钮是 删除 当前图表 品种 的所有 挂单 ; 第三行第一个按钮是关闭所有 品种的全部买单,第二个按钮是关闭所有 品种的全 卖单,第三个按钮是关闭所有 品种的全部订单; 第四行第一个按钮是删除所有 品种全部买单挂单 ,第二个按钮是 删除 全部品种 的全部卖单挂单 ,第三个按钮是删除 全部品种 的全部挂单 。 希望此程序能对您有用
FREE

Introduction This Indicator Is Based On Average Price/Maximum Price Moves, And Using Moving Bollinger Bands And Moving Averages.
The Advantage Of Using It With YOUR own Analysis Will Confirm Potential Supports And Resistances While it Compliments With Your Analysis
The Indicator Is Non-Repainting
AND Along With Our Special Trend METRE that Changes With The Conditions OF A Bullish Or Bearish Trend....
Recommend Time-Frames: H1 H4 M15
Usage: The Indicator Is Very Profitable If Use
FREE

Velvet RSI is intended for use with the Velvet advanced ordering layer. It is a modified version of the RSI indicator provided by Metaquotes and all of the data it displays is accurate and verified, when it is detected by the ordering layer. In order to place orders with the Velvet RSI indicator, the ordering layer must be installed and running. Ordering from the Velvet RSI indicator requires that "Velvet Ordering Layer" ( found here ), version 1.0 or higher, be installed and running. When de
FREE

Fast T3 MA Trend indicator derived from T3 moving averages. This indicator is part of the T3 Cloud MA indicator and is posted here on its own. Buying/Selling opportunities above/below line. The MA line can also be used as dynamic support/resistance for more aggressive entries. Use default values for best settings. The number of look back bars is user defined. This indicator can be used in combination with other strategies such as price action. Suitable for all time frames.
FREE

The panel displays the list of all orders (market and pending) along with their details, including magic numbers and commentaries. The panel can be moved around the chart. For market orders, the profit listed includes the associated commission and swaps. There aren't any important input parameters, but you can control the panel's initial location via them.
FREE

This script allows you to toggle the "Show Trade Levels" option, but for the current chart only. Normally, you can only change the setting using the Options -> Chart menu for ALL charts, but this script allows you to do it for a SINGLE chart. I'm using it when I take screenshots, because most of the time I'm not trying to show the trades, just some functionality of one of my other tools. Iif you need that functionality, then this script is very helpful!
If the script helps you, please let me k
FREE
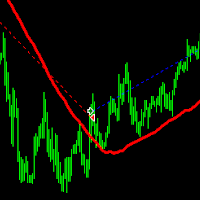
This expert advisor is very simple and easy to understand, it is based on the single Moving Average. The indicator settings is fully customized.
Recommended Pairs: - EURUSD - GBPUSD - AUDUSD - NZDUSD Expert Advisor Inputs: - Timeframe : Default value = current - Ma_Period : Default value = 50 - Ma_Method : Default value = MODE_SMA - Ma_Applied_Price : Default value = PRICE_CLOSE - Ma_Shift : Default value = 10 - Shift : Default value = 0 - Buffer_Candle : Default value = 1 - Auto_Lot : De
FREE

This reliable, professional trade copier system is without a doubt one of the best on the market, it is able to copy trades at very fast speeds from one master account (sender) to one or multiple slave accounts (receivers). The system works very fast and mimics the master account a full 100%. So changing stop losses, take profits, pending orders on the master account is executed on the slave accounts too, like each other action. It is a 100% full copy (unlike many other copiers who only copy mar
FREE

This expert advisor is very simple and easy to understand, it is based on the martingale strategy.
Recommended Pairs For Default Strategy: - GBPUSD - H1 Expert Advisor Inputs: - Strategy --> You have 4 options: Low Risk, Mid Risk, High Risk, Custom Strategy ( Custom Strategy is based on CrossOver Moving Average ); - Lot_Win --> Default value: (0.01) - Lot_Start --> Default value: (0.01) - Lot_Multiple --> Default value: (1), switch the value to (2 or above) if you want to use martingle stra
FREE

Supporting file (1 of 2) for T3 Cloud MA
Trend indicator derived from T3 moving averages. The cloud is bounded by a fast T3 and slow T3 lines. Buying/Selling opportunities above/below cloud. The fast and slow T3 MA lines can also be used as dynamic support/resistance for more aggressive entries. Use default values for best settings. The number of look back bars is user defined. This indicator can be used in combination with other strategies such as price action. Suitable for all time frames. Pr
FREE
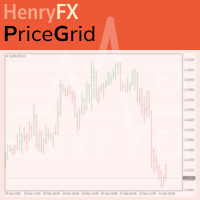
This indicator help you to easily calculate the price moving. You can change the gird size withing the input parameter for your trading style, such as hedge, swing trader, ect. It can let you easy to find your takeprofit and stoploss target price in chart.
For more about my tools and EA, you can join my channel below, thank you. Telegram channel: t.me/HenryEAChannel
FREE

SkyNet EMA is an indicator will assist you by suggesting when to go long or short based on price action and the crossings of Exponential Moving Averages such as 14 period and 50 period. Just attach it to your chart and it will monitor the asset for potential sell opportunities and if found will paint a red arrow in your chart. Also will try to find buy opportunities and if found will paint a green arrow in your chart. It could be used with any currency but majors are recommended since they will
FREE

HM(水平マークアップ)は、水平レベルの手動マーキング用に設計されています。 マークアップには、レベルとその価格値が含まれています。 線の太さと色、および価格の値は設定で設定されます。 レベルは、時間枠にローカルに配置することも、すべての時間枠に対して公に設定することもできます。
彼の仕事はとても簡単です:
1)-あなたがレベルをマークアップするために設定で設定したキーを押してください;
2)-行を目的の場所に持ってきます;
3)-マウスの右ボタンをクリックすると、レベルがリンクされています。
将来的には、これらのレベルを移動して調整することができます。
チャートから削除された後、インジケータはそれ自体のレベルをきれいにしません。 それらは手動で削除する必要があります。
最も効果的なアプリケーションは、選択した取引商品の異なる設定を持つ複数のHMSを一度に使用することです。
入力:
線のスタイル-線のスタイル
線幅-線の太さ
マークスタイル-値札のサイズ
Mark offset(ピクセル)-画面の左端に対するオフセットをマークします
線の色-線とラ
FREE
Информационная утилита, отображающая текущий ход цены за день и средний, взятый по данным индикатора ATR с указанным периодом и на указанном временном интервале. При превышении среднего значения текст перекрашивается на заданный в настройках ( Text color ( current more than average ) ). Для удобства восприятия формат цифровых значений регулируется параметром Point or pips , где при выборе пункта Point значения делятся на 10. Текстовую метку можно перемещать по графику в любое удобное место. Наст
FREE
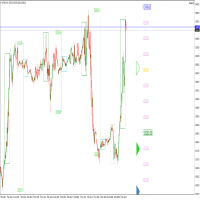
Perspect EA
This version of the EA focusses on indicating points of interest on the chart, features include : Sessions (Asia/Gap/London/Gap/NewYork/Gap) Previous Daily/Weekly/Monthly highs and lows Previous Daily/Weekly/Monthly open and close price
Round numbers (Ruler) Opening range Initial balance Multi time frame (Yearly view, monthly opening range) Customizable chart templates for low light users The indicator will assist in advanced technical analysis, providing the user with desired
FREE

This indicator determines minimum volumes needed during a candle formed so that it would be higher than current volume's average. Although you can place MAs on your volume indicator, this indicator has non-repaint characteristic so you may not to worry about sudden volume increase. This indiator also draw volume indicator for its own. Input Description: period: Period used for indicator. Must be higher than 1. Output Description: VolumeXover: This indicator's main feature. During the time the vo
FREE

The indicator plots an affine chart for the current instrument by subtracting the trend component from the price. When launched, creates a trend line in the main window. Position this line in the desired direction. The indicator plots an affine chart according to the specified trend.
Input parameters Maximum number of pictured bars - the maximum number of displayed bars. Trend line name - name of the trend line. Trend line color - color of the trend line. Black candle color - color of a bullish
FREE

Pairs Navigator is a simple and easy-to-use tool that allows you to view all of your charts in a single window. This eliminates the need to open multiple charts from the Market Watch window, saving you time and effort. Pairs Navigator is also very lightweight, so it will not put a strain on your RAM or cause your MT4/5 platform to hang. To use Pairs Navigator, simply drag and drop the currency pairs you want to view into the Pairs Navigator window. You can then easily switch between charts by c
FREE
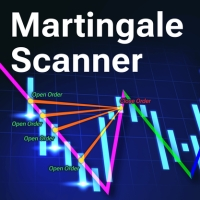
Martingale Scanner: Smart Trade Analysis for Martingale Strategies The Martingale strategy is a high-risk, high-reward approach that requires precise execution and careful risk management. Without the right tools, traders may struggle to analyze market conditions and adjust trade sizes effectively. Martingale Scanner is designed to simplify and optimize this process, providing traders with a structured way to apply the strategy efficiently across different currency pairs. Why Use Martingale Scan
FREE

7年の時を経て、私の独自のインディケーターとEA(エキスパートアドバイザー)を無料で公開することにしました。
役立つと感じたら、 5つ星の評価でサポートをお願いします!あなたのフィードバックが無料ツールを提供し続ける動機となります。 他の無料ツールも こちら からご覧ください
_________________________________ フォレックス市場のボラティリティ分析を強化するATRバンド付きインディケーター MQL5で開発されたATRバンド付きインディケーターをご紹介します。この革新的なツールは、平均真のレンジ(ATR)をカスタマイズ可能な上下のバンドと統合し、市場のボラティリティについて詳細な理解を提供します。 主な特徴: ボラティリティの測定 : 市場のボラティリティを正確に測定するためにATRを使用し、市場状況に関する重要な洞察を提供します。 カスタマイズ可能なバンド : ボラティリティの極値と市場のトレンドを視覚化するための調整可能な上下のバンドを特徴としています。 ブレイクアウトとコンソリデーションの検出 : 戦略的な取引決
FREE
An on‑chart, data‑driven pre‑trade planner that turns your broker’s live market properties into clear, actionable numbers. It consolidates spread, commission, swaps, ATR‑based stop/targets, pip/point value and 10 risk‑profile lot sizes into one compact panel that auto‑scales to any chart size. The display is direction‑agnostic (no LONG/SHORT duplication) and emphasizes total trade cost and true risk/reward before you click “Buy/Sell.” What it shows (at a glance) Time & price context (Local/Serv
FREE

The indicator calculates a combination of two moving averages and displays their trend in derivative units. Unlike traditional oscillators, the maximum and minimum values in this indicator always correspond to the number of bars you want to track. This allows you to use custom levels regardless of volatility and other factors. The maximum and minimum values are always static and depend only on the initial Bar review settings.
The indicator can be used as an independent trading systemtrading
FREE

USD INDEX
The Currency Index Project is ONE part of a thorough Forex study. Many people do not know the theoretical basis that drives currency exchange rates to move on the market. With this set of tools you will be able to have a more complete view of the entire market by analyzing not only the single currency of an exchange, but all the exchange rates that make up that currency by looking at a single window!
The indicator faithfully represents the real index of a single currency present in a
FREE

CoralDash is a simple symbol shortcut dashboard. The Symbol List has many presets to choose from: Market Watch Open Orders Current Chart Majors A custom list Clicking the symbol has two available actions Set the current chart symbol Filter the list of symbols shown in the dashboard based on one currency (e.g., see all EUR pairs) Click the "PAIR" cell in the header to toggle between the two available actions Click the symbol cell to apply the action For the filter, click the left side to selec
FREE

現在のTFで動作します。 MA2、14、30、120、480を考慮します。 秋の成長率、2-14、14-30、30-120と120-480の違い。
このEAでは最大の利益の計算を実施し、価格に応じて閉じ、200ポイントまでの最大の利益は、その後、何も考慮していない場合、価格は最大の利益より 1500から2500までの場合、価格が最大利益から20%低下し、2500以上の場合は10%以上低下した場合は終了します。 これにより、最初の20ポイントから250の利益で2500ポイントにドロップすることができます。 オープニングオーダー MA2、14、30、120のいずれかの下降または上昇の条件の下で、最初のバーのMA2とMA14の差は20未満であり、ゼロバーの終値はMA14の上また 平均値の低下の成長は、第一および第二のバーの間の速度によって考慮されます。
脳はEurodollar時間TFを調整しました。 月-April2019は30%の利益を示しています。 八月2018-四月2019 40%利益. 新しいバージョンでは、MAの移動平均のパラメータに応じて、注文を配置するための条件の指
FREE

指標は、ロットの最大数と最小数、およびシンボルのスプレッドのサイズを示します。
この情報は、迅速かつ大規模な利益を達成するために、最大入金額に基づいて市場に参入することを迅速に決定するために必要です。利用可能な資金と1ロットを開くための資金に基づいて計算されます。
このような状況は、さまざまなForexコンテストに参加したり、最大限の手段で市場を取引したり、ボラティリティが増減した期間に迅速かつ大きな利益を達成したりする場合によく発生します。
インジケーターは、ツールウィンドウに接続すると、すぐに必要な情報が表示されます。ツールウィンドウでフォントサイズを変更したり、情報を置き換えたりする必要がある場合は、インジケーターの設定で変更できます(スクリーンショットを参照)。
Fontsize-フォントサイズ。 Xdistance-アンカー角度を基準としたピクセル単位のX座標距離。 Ydistance-アンカー角度に対するピクセル単位のY座標の距離。
著者の製品に関する追加情報......
FREE
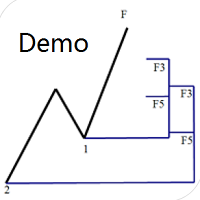
Dinapoli Levels Expansion and Retracement Demo An auxiliary tool written specifically for the DiNapoli point trading method. This is a trial version and there are no restrictions on the XAUUSD H4. Official version https://www.mql5.com/en/market/product/32213
The main function:
1. You can directly draw multiple sets of Fibonacci retracements, and the relationship between important return points is clear at a glance.
2. You can draw Fibonacci extensions, the ratio has three kinds of 0.618, 1, 1
FREE

Trend Exploit The logic behind Trend Exploit EA is very simple but effective , the EA uses breakouts of the Bollinger Bands for entry and exit signals, enter in the market in the direction of a strong trend, after a reasonable correction is detected. The exit logic is also based on the Bollinger Bands indicator and it will close the trade even on a loss when the price breaks Bollinger Bands line.
Trend Exploit was strictly developed, tested and optimized using the "Reversed Sampling" devel
FREE

Pivot Mean Oscillator (PMO) is a unbounded zero-centered oscillator that provides a quick and normalized measure of divergence between two spreads. Detailed description of the mathematical formulation along with some comments and experiments can be found in this article .
Trading aspects
This version of PMO is tuned on spreads relative to Close and Open price signals against their cumulative moving average (CMA). Positive PMO(m,n) values means that last (normalized) m Close prices are higher t
FREE

Close All BUY Orders for MT4 script - closes absolutely all orders, whether pending or market ones.
Orders are closed at the current profit/loss indicators at the time of closing.
The script is suitable for moments when you need to quickly close all orders at the current indicators.
The script is very easy to use, just drag the script onto the chart and it will do its job.
Add me as a friend, I have many other useful products.
FREE

The indicator displays signals on the chart of the classic RVI indicator with an alert.
The indicator signals after confirmation of the strategy at the opening of a new bar. I recommend watching my advisor - Night Zen EA In the settings, you can select the following strategies: The main line crosses the signal line The main line crosses the zero level In the settings, you can change the period of the classic RVI indicator.
I also recommend to look at my other developments in the market:
ht
FREE

Ultimate pattern builder indicator
Allows you to build any pattern with up to 3 candlesticks (+ special fourth). This indicator is special because you can create any pattern you want, by modifying body and both wicks separately to your needs. If you ever wanted to create your own patterns , or just adjust any known popular pattern, then this is perfect for you. With this indicator you can learn how to build candles, testing it in strategy tester and get marked new candles on realtime charts, ho
FREE

Master the Forex Market with Powerful Currency Analysis! LIVE MONITORING OF SIGNAL USING CCY POWER
Take your forex trading to the next level with a comprehensive and fully customizable tool designed to analyze currency trends, identify strong and weak currencies , and enhance your decision-making process. Key Features: Multi-Timeframe Analysis
Analyze currency strength from short-term (1-minute) scalping to long-term (1-month) trends—adaptable to any trading style. Customizable Ca
FREE

Exaado Capital care If you've been searching for ways to manage Drawdown control, Drawdown Control, Balance protection, or Daily Drawdown Limit related to trading with Prop Firms, FTMO, My Forex Fund, or Funded accounts, then you've come to the right place. Additionally, if you're looking to safeguard your trading account, we can help. Do you struggle with managing your drawdown while trading funded accounts? Our EA is designed specifically for those in your position. Many prop firms have a "Tra
FREE
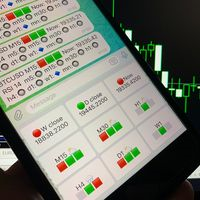
Telegram Candle Map Barometer. I wanted to create an informer that would show in the direction of the candle shadows where the price is moving. When I made the first timeframe, I realized that by combining several, I get an excellent breakout entry indicator. You need to create a Telegram bot for getting an API. Copy main ex4 file to Experts folder and use with settings. Download and enjoy, even receiving signals from MetaTrader, this is true when trading on any exchange. What we have inside: Mi
FREE
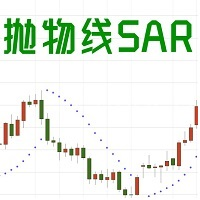
1. EA basic This EA is an EA that trades based on the SAR indicator. When the SAR appears at the top of the K line short or close a long order, and when the SAR appears at the bottom of the K line, long or close a short order. Sar is more useful when the trend is strong. It can clearly tell you when to enter or exit. Please see bottom pictures. EA does not have the ability to judge the trend, so you need to judge the trading direction by yourself. You should decide to choose long or short in
FREE

Account - hedge Depot - from 200 Optimized for any pair. The options are in the comments. Trial - month. Optimized for EURUSD. Convenient optimization of intervals for trading - just remove the unprofitable Day of the Week, Hour from the list. ! Enter the numbers on the Day of the Month to disable trading on these days. * Disabling trading means not entering the market. If there are open orders, accompany them. After optimization, reset HoursTST, DayOfWeekTST, DayOfMonthTST. An option for MT4 is
FREE
An indicator for analyzing different currency pairs simultaneously Forex is a complex market that requires several currency pairs to be analyzed simultaneously Determine the number of currency pairs yourself Determine the currency pair you want to analyze to analyze 4 of the most important and similar currency pairs at the same time. For direct and simple analysis, some currency pairs have changed (EURUSD>>>USDEUR) Do not doubt that to succeed in this market, you must analyze several currency pa
FREE

https://www.mql5.com/en/signals/2298866?source=Unknown
https://www.mql5.com/en/market/product/135278?source=Site+Market+Product+From+Author
[Your EA Name] – Smart Algorithm for Long-Term Profit Profit from Market Trends – Smart Portfolio Management [Your EA Name] is designed to help traders capitalize on Forex market movements by integrating three powerful strategies:
Trend Following – Capture momentum for maximum profit potential
Grid Trading – Place strategic orders to optimize ran
FREE

Highly configurable Demarker indicator.
Features: Highly customizable alert functions (at levels, crosses, direction changes via email, push, sound, popup) Multi timeframe ability Color customization (at levels, crosses, direction changes) Linear interpolation and histogram mode options Works on strategy tester in multi timeframe mode (at weekend without ticks also) Adjustable Levels Parameters:
Demarker Timeframe: You can set the lower/higher timeframes for Demarker. Demarker Bar Shift: Y ou
FREE

Shows on the chart a two moving averages histogram. It allows to send alerts to MetaTrader platform when the crossovers occurs. You can use it on any timeframe, moving averages settings can be adapted as well as the appearance and colors.
The parameters for the indicator are Fast moving average period Slow moving average period Moving Average Mode Moving Average Price Alert on crossovers Histogram Bar Width Bullish Color Bearish Color
FREE

This indicator will mirror the assets in use in another metatrader, being able to choose the timeframe and a template. This is the Metatrader 4 Client, it needs the Metatrader 4 or 5 Server versions: Metatrader 4 Mirror Chart Server: https://www.mql5.com/en/market/product/88644
Metatrader 5 Mirror Chart Server: https://www.mql5.com/en/market/product/88652 Details of how it works in the video.
FREE

An improved version of the standard Standard Deviation indicator.
It is now a responsive and smoothed line.
The setup is not straightforward - but I hope you can do it.
It is very easy to understand the readings of this indicator, the meaning is the same as that of the usual Standard Deviation.
//////////////////////////////////////////////// ///////////////////////////////////
I hope this indicator will be very useful to you in successful trading.
Good luck.
FREE

Mini Assistant is a small training tool in the strategy tester. A minimal set of buttons provides ease of use. There are no external parameters; they are simply not needed here. All you need is right on the screen. Before opening a position, in the special input windows, specify the required volume, as well as Stop Loss and Take Profit levels. To close a position, select it by ticket in the lower window. The program was written quickly, and also does not have a special uniqueness, so I post it i
FREE

This is an original trend indicator. The indicator draws three lines in a separate window. Its values vary from -1 to +1. The closer the indicator is to +1, the stronger is the ascending trend. The closer it is to -1, the stronger is the descending trend. The indicator can be also used as an oscillator for determining the overbought/oversold state of the market. The indicator has one input parameter Period for specifying the number of bars to be used for calculations.
FREE

Script for quickly determining the time offset of your broker's server relative to GMT. For correct operation in the strategy tester, many Expert Advisors require GMT time to be entered in the settings for the terminal where testing is being performed. Developers are forced to enter the GMT offset for testing separately, as such functions are not provided in the tester. This script can help quickly determine the time offset in your terminal relative to GMT.
Parameters Day light saving time for
FREE
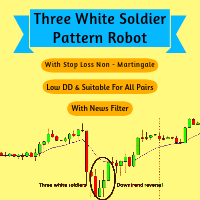
The three white soldiers candlestick pattern is a bullish reversal pattern typically observed in candlestick charting. It consists of three consecutive long-bodied candlesticks formed after a downtrend, signaling a potential shift in market sentiment from bearish to bullish. Here's a detailed description of the pattern:
1. **First Candlestick:** - The first candlestick in the pattern is usually formed during a downtrend and has a long white (or green) body. - The long body indicates stro
FREE

O Afastamento da Média Móvel, é uma poderosa ferramenta de análise técnica projetada para fornecer uma representação visual do afastamento entre o preço atual e uma média móvel específica. Este indicador, desenvolvido para o MetaTrader, oferece aos traders uma perspectiva clara das mudanças na dinâmica de preço em relação à tendência de médio prazo. Versão MT5: https://www.mql5.com/pt/market/product/111704
FREE

The indicator is a 15-minute signal indicator for all types of traders. Meaning, you could make lots of profits trading two different signals in one indicator.
NOTE: Both indicators are channels for achieving the same result. RED ARROW -- Sell Signal BLUE ARROW -- Buy Signal
Purchase now to be part of our community. We offer standard chart setups for both novice and intermediate traders. Trade with ease!
FREE
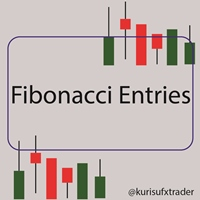
Objective: To automatically show the Fibonacci entries from last candle. Inputs: 1. Show/Hide the Fibonacci entries 2. Set where the Fibonacci will draw, 0 = current, 1 = last bar … (Default = 1) 3. Set the Fibonacci color 4. Set the line style 5. Set the minimum candle size automatically/manually in which the fib levels will appear 6. Set the candle size based on ADR/X Fibonacci levels: 23.6, 38.2, 50 Other Tools: https://www.mql5.com/en/market/product
FREE

LyfUD指标专门 为黄金设计的趋势指标 ,也可以用于任何金融工具。用于及时反映多空力量,由U线和D线组成, 波动以0为中轴偏离运行, U线为快线D线为慢线。 LyfUD指标可以和 绝大多数策略结合使用 ,能够更加有效的把握风控。 U线和D线采用价格行为市场追踪算法,能及时反映市场方向, 可用在任意货币。 特性: 1. U线、D线在0轴上方,买入信号参考。 2. U线、D线 在0轴下方 ,卖出信号参考。 3. U线、D 线极限背离转向,行情可能出现反转。 4. 滞后性低,能及时反映趋势。 致力于结合其他指标,LyfUD和 均线、Pinbar 等搭配使用能迅速找到一些合理的关键位。 LyfUD只作为参考依据,其风险与作者无关。未经作者同意,禁止他售。
FREE
MetaTraderマーケットは、履歴データを使ったテストと最適化のための無料のデモ自動売買ロボットをダウンロードできる唯一のストアです。
アプリ概要と他のカスタマーからのレビューをご覧になり、ターミナルにダウンロードし、購入する前に自動売買ロボットをテストしてください。完全に無料でアプリをテストできるのはMetaTraderマーケットだけです。
取引の機会を逃しています。
- 無料取引アプリ
- 8千を超えるシグナルをコピー
- 金融ニュースで金融マーケットを探索
新規登録
ログイン