YouTubeにあるマーケットチュートリアルビデオをご覧ください
ロボットや指標を購入する
仮想ホスティングで
EAを実行
EAを実行
ロボットや指標を購入前にテストする
マーケットで収入を得る
販売のためにプロダクトをプレゼンテーションする方法
MetaTrader 4のためのエキスパートアドバイザーとインディケータ - 60

This indicator plots a moving average in 2 colors: Green if the slope is bullish Red if the slope is bearish NB: if the last value of the moving average is equal to the previous one, the color will be red. You can obviously edit the Period of the moving average, the width, the MA mode (Simple, Exponential, Smoothed and Linear Weighted) and the MA price (Close, Open, High, Low, Median Price, Typical Price, Weighted Close).
FREE
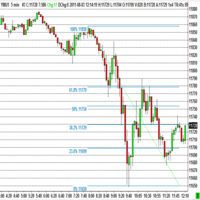
The program automatically draws fibonacci. This will save you a great deal of time in studying the chart. My intention is to facilitate those who carry out a study of the graph manually and use Fibonacci. In the screenshot you can see the result.The script applies to the chart of any currency pair or any stock. It will not open any purchase or sale operation because this program is limited only to drawing fibonacci.
FREE

The panel displays the list of all orders (market and pending) along with their details, including magic numbers and commentaries. The panel can be moved around the chart. For market orders, the profit listed includes the associated commission and swaps. There aren't any important input parameters, but you can control the panel's initial location via them.
FREE
Индикатор Trender определяет смену тренда. Для того чтобы её не пропустить, настройте его на отправку уведомлений в ваш мобильный терминал (Push), или в виде алерта ( Alert ), или по Email. Также индикатор предоставляет потенциальные точки входа и расчитывает и отображает уровни стоплосс и тейкпрофит.
Преимущества: - Не перерисовывается - Может помочь в фильтрации сигналов в вашей стратегии - Работает на всех парах и таймфреймах - Прост в настройке - Даёт уже готовые сигналы для открытия пози
FREE
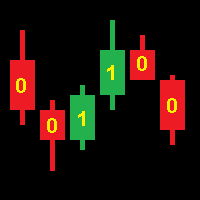
Operation of the CodEx 4 Expert Advisor is based on patterns composed of consecutive candles. Positions are closed when opposite signals appear. Sequences of candles are encoded into an integer according to the following rule. The code number must be converted to binary form and the highest bit must be discarded. The resulting sequence of bits encodes a continuous sequence of candles, where 1 is a bullish candle, 0 is a bearish candle. The higher bits encode the earlier candles. For example: 19[
FREE

Having to check constantly if your Stochastic has reached a specific level can be tedious and draining at times, especially if you have to monitor different asset classes at a time. The Alert Stochastics indicator will assist in this task, ensuring that you get the most with little effort. When the Stochastic values get to a specified level, the alerts will go off, on the chart, on the MT4 phone app or via email (You can receive text messages to your phone if you activate texts on your Gmail acc
FREE
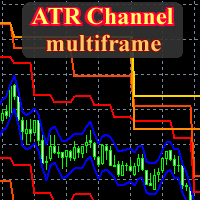
This is a fully multitimeframe version of the ATR Channel standard indicator, which works for any combination of timeframes. The indicator allows viewing price channels from different timeframes in one window, and they will always be displayed in a correct time scale. You can create and set of intervals and freely switch to a higher or lower one. Please note: in the " From Median Price " display mode, it is easy to identify reversal points at intersections of levels from higher timeframes by lev
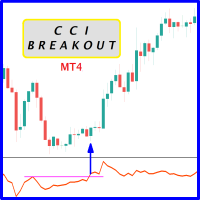
Probability emerges to record higher prices when CCi oscillator breaks out oscillator historical resistance level when exhibit overbought values. Since, oscillator breakout of support and resistance have similar effect as price breaks support and resistance levels, therefore, its highly advised to confirm price breakout with oscillator breakout; certainly, will have the same output in short trades. Concept is based on find swing levels which based on number of bars by each side of peak or trough
FREE

Индикатор вычисляет наиболее вероятные уровни возврата цены. Может быть использован для установки уровня тейк профит. Рекомендуемый таймфрейм - любой, при соответствующей настройке. Настройки.
Period - количество свечей для анализа. Accuracy - точность расчёта уровня в пунктах. Width - размер ценовой метки. Отработка уровней как правило не занимает много времени, уровни достаточно точны при касании и процент возврата цены к ним достаточно высок. Но следует учитывать риск продаж на локальных мин
FREE

At the very least, this indicator is able to entertain you. It builds a moving line based on interpolation by a polynomial of 1-4 powers and/or a function consisting of a sum of 1-5 sine curves. Various combinations are possible, for example, a sum of three sine curves about a second order parabola. The resulting line can be extrapolated by any of the specified functions and for various distances both as a single point at each indicator step (unchangeable line), and as a specified (re-painted) f

HEDGING AND TRAILING https://www.mql5.com/en/users/earobotkk/seller#products This Expert will hedge your trade position automatically. There are 2 buttons on chart for you to enter a trade. Blue button for buy entry and Red button for sell entry. It also can trail stop all hedged positions. It can also open its own trades with auto entry feature. How It Works : (1) By Clicking Button. When you found a setup, click the button (blue for buy and red for sell). Expert will immediately open a stop

The information panel shows market information about the selected symbol, which is hidden from the eyes of the trader. You can change the color of the panel panel, the color of the text on the panel. It can be moved around the screen. Available in two languages (Russian and English). Data: Symbol - symbol names; Point - Point size in quote currency; Spread - Spread in pips; Stop Level - The minimum acceptable stop loss / take profit level in pips; Lot Size - The contract size in the base curre
FREE

The Supertrend Trailing Stop will trail the Stop Loss price of your selected orders following the Supertrend Line, so you don't have to worry about having to change it manually. MQLTA Supertrend Trailing Stop requires you to install the FREE Indicator Supertrend Line https://www.mql5.com/en/market/product/25951
How does it work? The Expert Advisor sets and moves the Stop Loss price of the selected orders following the value of the Supertrend Line. You can filter the Orders by Symbol Comment Mag
FREE

With this copier you are able to transfer trades from one account to the other as long as both accounts are on the same server. To do this, open two Mt4 applications and insert the EA into a chart in each case. In the input parameters of the copier, select "Master" on one account and "Slave" on the other account. Later, the trades are then transfered from the master to the slave account For the slave account, use the lot multiplier to set the lot size for the slave account. For example, if you o
FREE

Alert TIME LINE indicator warns that the price has reached a specified time level.
Drag the indicator onto the chart, press the SET TIME LINE button, move the line that appears to the desired time, when the chart reaches the specified time, an alert will be triggered.
This indicator is used as an auxiliary tool when trading time zones, using the free TIME LINE Forex System , see the results and screenshots below.
You can get the system for free in the technical support chat https://t.me/Cycl
FREE

Drop & Volatility Shield Monitor – Volatility/Spread Status Bar (MT4) Overview Drop & Volatility Shield Monitor is an MT4 chart visualization indicator that turns current market conditions into a simple color status bar at the top of the chart. It does not generate entries and it does not place, modify, or close any orders.
Instead, it highlights when conditions are: NORMAL (green) – regular conditions COOL (red) – high volatility, sharp drops, or abnormal spread (cool-down zone) RECOV (orange)
FREE

It is a demo version of Advanced Arrow indicator It works only on GBPJPY but the full version works on all currency pairs.
Features Simply it gives you entry point ,SL line and 4 TP lines or less. Once SL-TP lines are shown with the arrow, they remains as they are until signal change. It is historical indicator. No Repaint.
Indicator parameters Indicator Version : choose V5 or V6. TP 1 Line color : TP1 color. TP 2 Line color : TP2 color. TP 3 Line color : TP3 color. TP 4 Line color : TP4 colo
FREE

Read Elliott wave principle automatically. With the Swing Reader, you can easily read the Elliott Wave Principle through an automatic system. With swing, we mean a ZigZag market that is created by a breakout of its standard deviation. You can set the deviation manually, or you can let the indicator do it automatically (setting the deviation to zero).
Advantages you get Never repaints. Points showing a horizontal line, in which statistically a long wave ends. Candles showing a vertical line in
Highly configurable Relative Vigor Index (RVI) indicator.
Features: Highly customizable alert functions (at levels, crosses, direction changes via email, push, sound, popup) Multi timeframe ability Color customization (at levels, crosses, direction changes) Linear interpolation and histogram mode options Works on strategy tester in multi timeframe mode (at weekend without ticks also) Adjustable Levels Parameters:
RVI Timeframe: You can set the lower/higher timeframes for RVI. RVI Bar Shift: yo
FREE

The EU_15_111517128_S_Op_CF_SQ3 is an algorithmic trading strategy for MetaTrader, tested on EURUSD using the M15 timeframe from April 1, 2004, to April 24, 2024. There is no need to set up parameters, all settings are already optimized and fine-tuned.
Recommended broker RoboForex because of EET timezone.
You can find the strategy source code for StrategyQuant at the link: https://quantmonitor.net/eurusd-bollinger-bands-breaker/
Key details are:
Main Chart: Current symbol and timeframe
FREE

* EA capable of Trading 29 pairs from Single Chart * This is Photocopy of Samartha Expert Advisor https://www.mql5.com/en/market/product/48629 * Samartha Paid is fully automatic trading system... Samartha Test EA does not take trades... But it gives same signals as Samartha paid version * Please contact me by message or on whatsapp +919890059592 if you want to test Demo version on Demo Account for few days in live market. * Test Version is Like Non Trading Indicator for Testing Samartha Perform
FREE

iMACD in iMA is indicator to change color in iMA if iMACD is upper of zero (up trend) or lower of zero (down trend). It is a useful tool to track when the upside and the downside iMACD on iMA.
You can to get source code from here .
Parameters MA_Periods — Period for iMA. MA_Method — Method for iMA. MACD_FastEMA — Fast EMA for MACD. MACD_SlowEMA — Slow EMA for MACD. MACD_SignalSMA — SMA signal for MACD. MACD_ApliedPrice — Price used for MACD. BarsCount — How many bars will show the line. Revers
FREE

製品名 Smart Accelerator (MT4) – SmartView シリーズ 短い説明 MetaTrader プラットフォームで独特なユーザー体験を提供する Accelerator インジケーター。以前は利用できなかった高度な機能を提供し、ダブルクリックで設定を開く、削除せずにインジケーターを非表示/表示する、インジケーターウィンドウをチャート全体のサイズで表示するなどの機能を備えています。SmartView Indicators シリーズの残りの部分とシームレスに連携するように設計されています。 概要 SmartView シリーズは、革新的な機能を通じて MetaTrader プラットフォーム上のインジケーターに独特で特徴的なユーザー体験を提供し、インジケーター管理をより速く、より簡単にします。各インジケーターには、チャート上のスマートコントロールパネルが装備されており、基本情報を表示し、すべての重要な機能への迅速なアクセスを提供します。 以前は利用できなかった独自の機能 SmartView シリーズは、インジケーターでの作業をより簡単で迅速にする高度な機能を提供します:
FREE

FREE EDITION! ~paid edition no longer available. may be updated and re-added in the future~ This expert advisor is used to automate one or more commonly used trading strategies. Currently available strategies: -Moving Average Crossover -MACD Cross over 0 line -MACD Cross over Signal - PAID EDITION ONLY -Moving Average Crossover with MACD Signal cross - PAID EDITION ONLY -Bollinger Band Cross - PAID EDITION ONLY
-CCI Filter for each of the above strategies. - PAID EDITION ONLY -StochasticFilter
FREE
LimitGridEA Pro – Smart & Clean Grid EA for Gold and Forex Trade confidently with a Buy/Sell Limit Grid System powered by technical filters, equity control, and a user-friendly interface. Key Features : Buy/Sell Limit Only – Structured order placement, no spamming, no chaos RSI + Bollinger Band Filters – Ensures entries happen only with clear technical signals Combined TP (per side) – Automatically closes all orders on each side when profit target is hit Average Price TP (opt
FREE

このエキスパートは、同じ指標と組み合わせて機能するように設計されています。 https://www.mql5.com/ru/market/product/34834
専門家は画面には何も表示せず、取引もしません。 それは指標の計算のみを実行します、これはあなたのコンピュータリソースを節約するために行われます。 エキスパートはMarket Watchのシンボルを扱うので、テスターでそれをテストする方法はありません。 使用のための指示: 0)インディケータに表示されるMarket Watchで必要なシンボルを選択してください。 (注:!!!設定で使用する前に、必ず自動チェック機能を無効にしてください!!!)
1)任意の時間枠で任意の商品のチャートを開き、その上にこのエキスパートを置きます。 画面上のコメントがマーケットウォッチからのすべての文字を表示しなくなるまで待ちます。その後、このウィンドウを閉じたり、このエキスパートを削除したりしないでください。 エラーが発生した場合、またはエキスパートが動けなくなった場合は、もう一度起動してください。
2)同じ名前の無料のインディケータをダウンロ
FREE
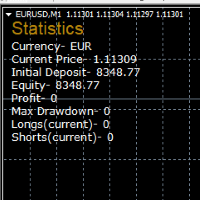
STATISTICS OSD
Statistics OSD (On Screen Display) Is very Helpful and easy to use. Download Today! ENJOY! :) On Screen Display -Currency -Current Price -Initial Deposit -Equity -Profit -Max Drawdown -Longs(Current) -Shorts(Current)
*Very useful in configuring EA's or Strategies, because you can visually see when its having a lot of shorts or longs. Then you can go back and tweak accordingly.
FREE

Version 4.0 100% free utility + 100% free signals. FREE SIGNALS VIA TELEGRAM https://t.me/joinchat/Jwa33g_jjsXwE4GrAAjihA Take the signal from the Mailbox and launch the adviser. Use the signal instruction and open a position. Use the lot as described below in the instructions. Close Take Profit. What's new. 4 levels for profit. 5/8/13/21 9 levels of Trail Stop. Manage your profit using a simple interface. DONATE PLEASE http://paypal.me/mql4Root // ---------------------------------------------
FREE

DESCRIPTION: Introducing "RobAI": the asset you've been waiting for to conquer the EUR/USD market. Thanks to a skilled combination of the Ichimoku indicator and an array of EMAs, RobAI captures trading opportunities with finesse, offering exceptional profit potential. The facts speak for themselves: over 5 years of experience with a maximum drawdown of 59%, ensuring prudent risk management. Additionally, a 92% win rate on trades confirms RobAI's precision in its decision-making. Confidently capi
FREE

The Stochastic RSI indicator (StochRSI) is essentially an indicator of an indicator. It is used in technical analysis to provide a stochastic calculation to the RSI indicator. This means that it is a measure of RSI relative to its own high/low range over a user defined period of time. The Stochastic RSI is an oscillator that calculates a value between 0 and 1 which is then plotted as a line. This indicator is primarily used for identifying overbought and oversold conditions.
FREE
The technical indicator is a more advanced version of the relative strength index (RSI) that applies moving average convergence-divergence (MACD) principles to a double-smoothed RSI (DS RSI) indicator. The indicator is derived by computing the difference between a double-smoothed RSI and a simple moving average (SMA) of the DS RSI. The indicator's intent is to provide more accurate buy and sell signals than the standard RSI calculation.
The MACD is derived by subtracting the 12-period exponen
FREE

An extended version of the indicator for visualizing the time ranges of key trading sessions: Asian, European and American. The main advantage of this indicator is the automatic construction of a price profile for a trading session. The indicator has the functionality to set the start and end time of each trading session, as well as automatically determine the time zone of the trading server. The indicators include the ability to work with minimal CPU usage and save RAM. In addition, the option
FREE

ADR 10 mostra l'intervallo medio di pips di una coppia Forex, misurato su un numero di 10 giorni . I traders possono utilizzarlo per visualizzare la potenziale azione dei prezzi al di fuori del movimento medio giornaliero.
Quando l'ADR è al di sopra della media, significa che la volatilità giornaliera è superiore al normale, il che implica che la coppia di valute potrebbe estendersi oltre la sua norma.
L'ADR è utile anche per il trading di inversioni intraday. Ad esempio, se una coppia di val
FREE

Forex trading support timer: - This is an indicator that supports a trader's trading process. - Before placing a BUY or SELL order, it is advisable to observe what the current time is like, to get the best position when trading. Function of indicator: - Display information about candle closing time of different timeframes (M1,M5,M15,H1), best used when Scalping. - Show market spreads. - Show TimeZone Trading. - Displays the remaining time of a session.
FREE
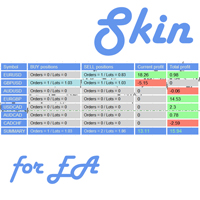
This utility is a graphical shell for other Expert Advisors that do not have their own graphical shell or whose graphical shell you do not like. Just run the utility on a free chart of any currency pair, specify in the input parameters the "Magic Number" of the advisor to which you want to connect the utility, and a graphical shell will appear on the graph, containing information about the traded currency pairs, current positions and trading results of your advisor.
If you like this utility, ta
FREE

Calendar File Converter
This script adapts the csv economic calendar file downloaded from the myfxbook.com portal for use by the Economic Calendar Viewer indicator. This indicator displays on the MT4 chart data about the upcoming current economic event and displays its data. It also notifies you with a sound before the upcoming event time. The read file should be named: - calendar_statement.csv The temporary intermediate file is named: - calendar_statement2.csv The output file is named: - Cale
FREE

EA Protrader Pivot is a automate and semi-automate Expert Advisor based on candlestick charts. Each order set stop loss with 200points and take profit 250 points. If one of two orders reach stop loss the new order open with new lot size (start lot is 0.01 and max lot is 0.08 ). This EA was backtested with XAUUSD in time frame M15 and spread 20 point. Automate - EA open buy and sell orders based on levels of candlestick chart with the first volume is 0.01 if this order touch stop loss EA cont
FREE

This EA just for fun, EA high risk, full margin. Just use this for fun not for getting money. Don't injecting just lets your money gone, enjoy wait the best moment to trade in your main account. The secret idea is manual setting only buy or sell following trend signal from ai or followed signal, this EA would only trade on low or high price momentum. Make cut loss decision is better to maintain drawdown. This EA bot using CCI, RSI, MACD Just use default parameter, optimizing your RSI for another
FREE

The indicator displays on the chart a map, on which markers show the current trading session, as well as shows a text. The indicator provides two types of background display: white and black. The indicator is displayed as the background and does not hinder tracking the current market situation.
Parameters: GMT - the time difference of the terminal and GMT. Background - selection of background - black or white.
FREE

The Swaps Indicator allows to monitor the swap rates of desired instruments in one place. There are several ways to choose the instruments list for the indicator: Select instruments from Market Watch Select all instruments Select instruments from the manually adjusted list All the setings color settings are adjustable in the indicator: you can set color for headers, for symbol names, for positive and negative swaps. There is also an ability to adjust the distance between the rows, columns and st
FREE
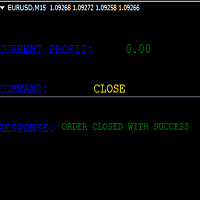
KEYBOARD CONTROL TRADING This script allows you to buy, sell or close positions using the keys on your keyboard. This allows you to create shortcuts to place buy or sell orders or to close an open position.
Setting:
LOT: To choose the lot size of your order.
TAKE PROFIT PIPS: To set your take profit in pips
STOP LOSS PIPS: To set the stop loss in pips
KEY FOR BUYING: To choose the keyboard touch to buy: -Up : To choose the UP direction key to place purchases -B : To choose the direction k
FREE

EA TradingPanel X advanced is a based on our free product TradingPanel X free version : Integrated News Feature Dynamic Take Profit (Trail Step) Multiple Trade handling Extended Ordermanagement Profit & Lot Informations Market Informations The EA has integrated dynamic Take Profit (Trail), this means, if you reach your defined TP it gives you the chance to follow on the Trend by dynamic TP & SL and extend your profits. Also a News Filter function is integrated. The EA working with real TP & SL n
FREE
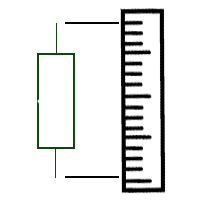
Индикатор отображает размер бара и его направление. ---------------------------------------- Цвета гистограммы: * Красный - Медвежий бар.
* Зелёный - Бычий бар.
* Серый - Цена открытия и цена закрытия равны. * Синяя линия - скользящая средняя.
---------------------------------------- Параметры: - Type of Calculation - Тип расчёта ( Low to High, Open to Close ) - Moving Avarage - Период скользящей средней
FREE

Summary This indicator is based on the MA applied to the Momentum indicator. It draws arrows at the confirmed crosses of the MA over the Momentum line. When the MA crosses upwards, then a buy arrow is displayed and vice versa. The arrows do not repaint since the indicator only uses confirmed values and waits for the candle to close before painting an arrow. The indicator is also able to alert when arrows appear. There are 3 types of alerts - Popup, Email and Mobile Push Notifications.
Inputs Al
FREE

Do you need precision? Tick charts show each change in the ask or bid; The chart updates whenever either price changes. Study the markets more deeply, with surgical precision. Tick Chart Window saves all the received ticks and shows them into a seperate window. Get the best entry price in the Market. trade with precision trade good Spread Register In the comment section you will see the highest spread, the lowest spread and the average spread since the indicator was loaded.
FREE

For all those traders interested or currently trading Ichimoku, you will not want to miss this article. Although I am heading out in a few hours with my girlfriend to Harbin Hot Springs, I wanted to write a brief introduction to Ichimoku Number Theory as there has been a lot of questions (and confusion) about Ichimoku settings, time frames, etc. The basis of Ichimoku as known to most is the 5 lines; Tenkan Line Kijun Line Senkou Span A (part of the Kumo) Senkou Span B (other part of the Kum
FREE

Indicator : Forex Reversal Trend The indicator helps investors to identify the earliest and perfect reversal point. Easy to make decision to trade with the trend Price action trading. support resistance and market trends. By technical analysis, the robot creates a short-term strategy to determine the most optimal entry position. Version PRO: https://www.mql5.com/en/market/product/70867 Telegram: https://t.me/tForexSniper
FREE
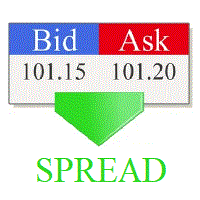
Real-time spread tracking and monitoring software
Displays spread values in form of histograms on current timeframe of chart Convenient for analyzing spread changes, as well as for comparing trading conditions of different brokers By placing on desired chart, the spread changes at different trading times are displayed
Additionally Fully customizable Works on any instrument Works with any broker
FREE

Robot CFO1.2EA is an innovative financial management system designed to optimize portfolio performance through the integration of contrarian, hedging, and grid techniques. Leveraging cutting-edge artificial intelligence algorithms, it provides sophisticated risk management and investment strategies tailored to meet the unique needs of your financial portfolio.
Robot CFO1.2EA employs a contrarian investment approach, capitalizing on market inefficiencies and deviations from the norm. It identifi
FREE

A reversed engineered and improved version of the extremely popular AFSID scalper ( afs-id.com ). Includes re-modeled versions of these 2 well received scalping programs: " AF-Fibo ", and " AF-TrendKiller". Take note that this is a high risk scalper Though improvements have been made to mitigate some of the risks, the risks inherent to martingale scalpers still exists, so use it at your own risk.
afsida Scalper (improved AFSID)
This is a simple martingale scalper which works on any pair (1
FREE

Price action Telegram is designed to follow the price while away from the trading terminal. There is no need to remember how the name of the currency is spelled correctly, those currencies on which expert is installed are available, because the trader does not jump aimlessly from currency to currency, he knows what he wants and what he is waiting for.
Through telegram, you can work with any timeframe and currency on which the expert is installed. You will always be aware of the market situatio
FREE
In the dynamic world of trading, visual acuity is paramount for making informed decisions. For traders who struggle with color blindness—a condition that affects approximately 5-10% of males and a much lower percentage of females—distinguishing between buy and sell signals can be particularly challenging. Recognizing this unique challenge, we are proud to introduce “Open Buy Sell Color”, a MetaTrader 4 script designed to enhance visual clarity for all traders. This tool offers customization o
FREE

Signals and Alerts for Accelerator/Decelerator indicator based on these MQL5 posts: Accelerator Oscillator and Signals of the Indicator Accelerator Oscillator . Note : this tool is based on the code of Accelerator indicator developed by MetaQuotes Software Corp.
Features The signals are triggered at closing of last bar/opening of a new bar; Any kind of alerts can be enabled: Dialog Box, Email message, SMS notifications for smartphones and tablets, and Sound alerts; Customizable arrows. By d
FREE

Price Predictor is an indicator that shows precise price reversals taking into account a higher time frame and a lower time frame candle patterns calculations it is great for scalping and swing trading . Buy and sell arrows are shown on the chart as for entry signals. BIG Arrows indicates the trend - SMALL Arrows signal a trade (BUY/SELL) - A Green BIG UP Arrow with a support green line indicates a Bull Market : wait for buy signal - A Green SMALL Up Arrow after a BIG green arrow is

Everything is very simple here. I have never understood indicators without external parameters. And the Awesome Oscillator is no exception. Now you can customize this indicator to suit your needs and strategies.
Reference: The Awesome Oscillator indicator shows the distance in points between two moving averages (fast and slow).
The AO_Robex indicator has in its parameters a change in the period of moving averages. The default parameters are the same as in the standard indicator.
FREE

VANEXIO USES THE TREND WAVE INDICATOR AND IT CAN IDENTIFY THE BEGINNING AND THE END OF A NEW WAVE TREND MOVEMENT.
AS AN OSCILLATOR, THE INDICATOR IDENTIFIES THE OVERBOUGHT AND OVERSOLD ZONES.
IT WORKS GREAT TO CATCH THE SHORT TERM PRICE REVERSALS AND USES A MARTINGALE STRATEGY TO CLOSE ALL TRADES IN PROFIT.
USE DEFAULT SETTINGS ON H1 OR HIGHER TIME FRAME ON ANY PAIR FOR MORE ACCURATE TRADES
WHY THIS EA :
Smart entries calculated by 5 great strategies The EA can be run on even a $20000 acco
FREE

Utility for order reversal. Closes orders on the chart on which it is launched and opens orders with the opposite direction instead of them. Has a simple and intuitive graphical interface. It is also possible to automatically reverse newly opened orders. MT5 version of the utility - https://www.mql5.com/en/market/product/74770 If you like this utility, take a look at my other products - https://www.mql5.com/en/users/nina_yermolenko/seller
FREE

This indicator calculates average speed of moving average indicator. Here is parameters: BarsToProcess - indicator calculating period; MaPeriod - period of Moving Average indicator; AveragingPeriod - period (MA values) of the basis of which the average value is calculated; MA_Method, MA_Apply_to - using to set MA indicator parameters; Thats all! Good luck.
FREE
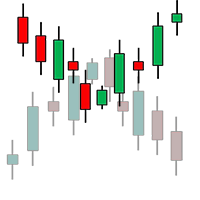
Th3Eng Chart shadow indicator is a tool helps you to display another symbol on the current symbol in candles style or line. You can type the second symbol name in the setting and select the drawing mode { candles or line }. Also, the indicator displays the spread and current price of both pairs on the left top side corner of the chart.
setting: 1- Symbol: Insert The second symbol name. 2- Drawing mode: Choose the draw mode from (Candles or line). 3- Show spreads: true\false to display the pric
FREE

This tool can delete any object drawn on MT4 platform charts. you can delete: Line_Objects (Vertical_Line, Horizontal_Line, Trend_Line, TrendLinebyAngle, Cycle_Line) Channel_Objects (Fibo_Channel, Equidistant, Linear_Regression, Standard_Deviation, Andrews_Pitchfork) Gann_Objects (Gann_Line, Gann_Fan, Gann_Grid) Fibonacci_Objects (Fibo_Retracement, Fibo_TimeZones, Fibo_Fan, Fibo_Arcs, Fibo_Expansion) Shapes_Objects (Rectangle, Triangle, Ellipse, Text, Label) Arrows_Objects or you can Delete_All_
FREE

RSI メーター: マルチ期間 RSI コントロール センター!
監視対象資産の相対力指数(RSI)の全体像を把握するために、チャートと時間枠を頻繁に切り替えるのにうんざりしていませんか?重要な買われすぎや売られすぎのシグナルが他のチャートに隠れているために見逃していませんか?
RSI メーターのご紹介: 直感的なダッシュボードで複数の銘柄と時間枠にわたる RSI 値の概要を即座に提供するように設計されたインジケーターです。
ボタンを何度も押すのをやめて、比類のない明瞭さと効率で操作を始めましょう。
RSIチャートがあなたの取引を変える理由:
RSI チャートは単なるインジケーターではありません。最も人気のあるモメンタム オシレーターの使用方法を変えることができる分析ダッシュボードです。
• 複数の市場の概要を即座に取得: * お気に入りの通貨ペア、指数、貴金属、暗号通貨をカスタマイズします。 * 利点: *自分の* ウォッチリストに集中して最新のデータをすばやく取得することで、多くの時間と労力を節約できます。
• かつてないマルチタイムフレーム機能(伝統を革新
FREE

Adaptive MA is a simple modification of the moving averages (MAs) that allows displaying an average value line based on multiple MAs on the chart. The parameters allow you to set any number of MA periods. The number of parameters is equal to the number of moving averages applied in calculation.
At first, it may seem that nothing new has been invented and there is no sense in this approach. However, this impression is deceptive. As we know, the trends have different duration. Have you ever tried
FREE
MetaTrader 4 (MT4)用のUZFX - Delete Only Pending Ordersスクリプトは、取引口座からすべての未決注文(買い指値、売り指値、買い逆指値、売り逆指値)を自動的に削除するシンプルで効果的なツールです。このスクリプトは、有効な市場ポジションに影響を与えることなく、保留中の注文を即座に消去したいトレーダーに最適です。
他のMT4/MT5インジケーターとEAをチェックする >> こちら
特徴 すべての未決注文(買い指値、売り指値、買い逆指値、売り逆指値)を削除します。 未決済のマーケットポジションには影響しません。 Expertsタブを介してリアルタイムの執行フィードバックを提供します。 トレーダーが手動で操作することなく、未決注文のストラテジーを素早くリセットできます。 使用方法 MT5チャートにスクリプトを添付します。 スクリプトは自動的にすべての未決注文をスキャンして削除します。 削除された各注文の確認メッセージが Experts タブに表示されます。 注: このスクリプトは有効な取引を決済するのではなく、未決注文を削除するだけです。 ス
FREE

The indicator sends a Screenshot of the chart to mail when a signal is received. It could be send from anyone timeframe and currency where installed the indicator. The indicator allows you to send messages to a mobile terminal and to mail. To send screenshots to the mail, you need the screensender.exe mail program. To create a signal, the following are used: horizontal lines / vertical lines / trend lines / Moving average.
The terminal does not allow sending screenshots to mail. Therefore, the
FREE

Risklimiter
Limit your risk with this dynamic stop loss indicator. It will show you exactly where to place your initial stop & subsequent stops as the price goes in your favour. Works on any time frame as well as any symbol. It is not restricted in any way nor does it need optimisation. Simply drag and drop on to a chart for it to display a stop loss. You may find at times, it shows a stop on the other side of your trade, this will change as soon as price closes above/below it.
DOES NOT REPA
FREE
This is a general purpose indicator that displays colored lines at fixed and customizable price intervals, entered as parameters. It offers universal, constant, and familiar price ranges that allow quick and precise price analysis of a currency pair. With default parameters, this indicator implements The Quarters Theory , as described originally by Ilian Yotov . [ Installation Guide | Update Guide | Troubleshooting | FAQ | All Products ] Easy to use No optimization needed Customizable price inte
FREE

This Expert Advisor works as a slave in a trade copier system. It reads trading instructions from a CSV file and replicates the orders in the MetaTrader 4 terminal. It is designed to work with a master EA that writes trades to the same file. The EA continuously monitors the file for updates and synchronizes the local terminal by opening, modifying, or closing trades accordingly. What it does: Reads trade data from a CSV file located in the Common Files directory Parses order ID, symbol, order ty
FREE

The EA automatically opens the orders when price crossing/touching lines, which were drawn by the user. Two scenarios are possible. When you expect the price to stay in the channel. When you expect that the price will not remain in the channel after the break off it. If you want use first scenario - you must set in settings Trade mode = “False_Breaking_Channel”. If you want use second scenario - you must set in settings Trade mode = “Breaking_Channel”. When you run EA, you must draw two trend li
FREE

Hi New Update Available At Non Free Version. Its more profitable and saver than older one. Just Grab it fast. Every month price goes up
This Free version Only use Lot 0.01 cannot modify the Lot Size. If You wanna unlock the lot size you can buy Pro Version at https://www.mql5.com/en/market/product/49608 See EA Performance on Backtesting with low balance = https://youtu.be/8Wok_CTzcsQ
Mata Elang EA is a trading robot for the trading on forex and trades Scalping Strategy. This is a Trend
FREE
The trade of this EA is based on The Commodity Channel Index (CCI)is a momentum-based oscillator used to help determine when an investment vehicle is reaching a condition of being uptrend or downtrend. with customizable lot size (use martingale or not), stop-loss, and take-profit levels. Easy to use and Simple Recommended Timeframe M30, H1 others timeframes with the appropriate settings. A low latency vps is always recommended. Works for ECN/Non-ECN brokers and 2-3-4-5 digit symbols Built-in
FREE
MetaTraderマーケットはMetaTraderプラットフォームのためのアプリを購入するための便利で安全な場所を提供します。エキスパートアドバイザーとインディケータをストラテジーテスターの中でテストするためにターミナルから無料のデモバージョンをダウンロードしてください。
パフォーマンスをモニターするためにいろいろなモードでアプリをテストし、MQL5.community支払いシステムを使ってお望みのプロダクトの支払いをしてください。
取引の機会を逃しています。
- 無料取引アプリ
- 8千を超えるシグナルをコピー
- 金融ニュースで金融マーケットを探索
新規登録
ログイン