 MetaTrader 5
 エキスパート
 インディケータ
 ライブラリ
ライブラリ
 ユーティリティ
 ウィジェット
 ルール
ルール
YouTubeにあるマーケットチュートリアルビデオをご覧ください
ロボットや指標を購入する
仮想ホスティングで
EAを実行
EAを実行
ロボットや指標を購入前にテストする
マーケットで収入を得る
販売のためにプロダクトをプレゼンテーションする方法
MetaTrader 4のためのエキスパートアドバイザーとインディケータ - 69
 自動売買ロボットは市場取引を自動的に実行しますが、インジケータを使用すると、相場をより適切に分析し、価格行動を予測できます。
これらのアプリケーションを使用すると、より多くの機会を獲得しながら、より多くの情報に基づいた方法でMetaTrader4で取引を実行できるようになります。
自動売買ロボットは市場取引を自動的に実行しますが、インジケータを使用すると、相場をより適切に分析し、価格行動を予測できます。
これらのアプリケーションを使用すると、より多くの機会を獲得しながら、より多くの情報に基づいた方法でMetaTrader4で取引を実行できるようになります。 
S imple arrow with alert on chart. This is NOT an entry indicator but a direction indicator. It uses MACD signal line to show you possible future direction of a trend. Please use it with other filters or confirmations to trade properly. Recommended for scalping and short term trades. Made for EURUSD M5 but it should work on every major pair on M5 timeframe. For MT5 version please go here! *If you need a fully automated trading system. Please check this EA here! FEATURES: Very simple directional
FREE

NZD INDEX
The Currency Index Project is ONE part of a thorough Forex study. Many people do not know the theoretical basis that drives currency exchange rates to move on the market. With this set of tools you will be able to have a more complete view of the entire market by analyzing not only the single currency of an exchange, but all the exchange rates that make up that currency by looking at a single window!
The indicator faithfully represents the real index of a single currency present in a
FREE

The panel allows you to place and open orders with one click of a button.
It is possible to quickly change the parameters of the lot, take profit, stop loss and expiration time.
The expiration parameter is valid only for pending orders. The trading panel works in the tester. To open a pending order, click on the buy or sell stop button, and then on a place on the chart.
(This function cannot work in the strategy tester for technical reasons) Expiration time is in minutes, everything else is
FREE

交易数据分析助手 : 这是一款交易数据统计分析工具,数据图表较多可供分析参考 . 语言: 支持语言的选择切换(目前支持中文和英文 主动识别不用人工选择) 主窗口显示: 余额显示 总盈亏显示 现在持仓盈亏金额显示 现在持仓盈亏比例显示 买单卖单总单量,总手数,以及盈亏情况显示. 仓位使用比例显示 按照目前持仓能够承受的亏损点数预计 (点击右下角可缩放)每日订单单量,手数,盈亏情况统计 (点击右下角可缩放) 当周盈亏数据
(点击右下角可缩放) 当月盈亏数据
(点击右下角可缩放) 当年盈亏数据
交易数据统计区: 详细订单统计,(可以选择按日,周,月,季度,年)(按品种,识别码)(现有持仓详细统计) 盈亏/手数/交易次数 柱状图 多/空持仓时间/获利水平情况 多货币盈利次数/盈利水平分布情况 余额净值曲线/余额曲线/盈利曲线等(注:加载余额净值曲线可能需要一定的数据处理时间,请耐心等待加载完成...) 每次订单盈亏利润柱状图 多货币对盈利曲线图 数据统计分析报告 关于版本更新 有任何问题,建议,欢迎交流.
FREE
What is so remarkable about the Nema general PRT indicator? It calculates all known derivatives of "EMA" (you know some: DEMA - or, more simply, EMA of the 2nd depth level, TEMA - EMA of the 3rd depth level...DecEMA ...and so you can dive into your research up to level 50...) If you set the depth = 1, then it will be an analogue of "EMA"; I repeat - depth 2 = "DEMA"; depth 3 = "TEMA"...Experiment - check the behavior of the created average at other depths. The indicator also has the abili
FREE

変化率
式に基づいて、 ROC = (Close[n] - Close[n-look if (roc > roc_lookback && roc > 0 ) trend= "UP" ; if (roc < roc_lookback && roc < 0 ) trend= "DOWN" ; back]) / Close[n-lookback] * 100 ルックバック期間にわたる通貨ペアの価格アクションの変化率をプロットし、2 つのグローバル変数 SYMBOL_ROC と SYMBOL_ROC_LOOKBACK を提供します。これらは、最新の変化率の値と前のルックバック期間での変化率を表します。 iCustom 関数を使用してインジケーターを呼び出し、 iCustom ( "Market/RedeeCash_Rate_of_Change.ex4" , Symbol (), 5 , 0 , 0 ); グローバル変数を取得し、 double roc = GlobalVariableGet ( StringConcatenate ( Symbol (), "_ROC" )); double
FREE

This tool is not only an Expert Advisor, it is used to optimize your indicators, to design your own Expert Advisor, to analyze the buffers of your indicators without having access to the source code. I searched for quite some time how I could optimize my indicators without having to program or modify an expert each time. With this tool, anyone can get started in strategy design or even have their own personalized Expert Advisor. It can optimize your indicators or your strategy with the days to
FREE
Patterns Wizardはローソク足のパターン作成ツールです。このツールを使用すると、さまざまなパターンを作成し、チャートに異なるパターンを持つインジケーターのインスタンスを複数追加できます。 作成の仕組みをより理解するために、 My Candle インジケーターの例を参照してください。これには70以上の異なるローソク足のパターンが含まれています。 このインジケーターの主な特徴は、 30のルールパラメータ を持っていることです。これは、最後の30本のローソク足それぞれに異なるルールを設定できることを意味します。 パターンが表示されると、このツールは以下の操作ができます: カスタムサウンドの再生 MetaTraderでのアラート 携帯電話に通知を送信 メールの送信 このインジケーターはリペイントや再描画をしません。キャンドルの終了時のみに実行され、非常に高速です。さらに、分析するキャンドルの最大数を最適化するパラメータも備えています。 テストで使用して自由にルールを作成し、取引の分析をサポートするプロのツールが必要になったら、このツールを購入してください。 ローソク足パターンの
FREE
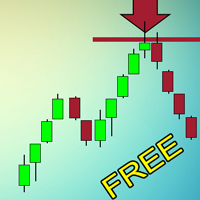
The indicator shows entry points with Risk-Reward-Ratio 1 to 5. Main timeframe H1. Works on every pair. The main logic - is to find a reversal level, and then track the price reaction to this level. Doesn't need any settings. As a standard, it paint 5 levels of the same take-profit (red / blue for sellers and buys) and 1 stop-loss level - orange. ATTENTION! Test version of the indicator. Works only on the USDCAD pair! The full version can be bought here https://www.mql5.com/en/market/product/61
FREE
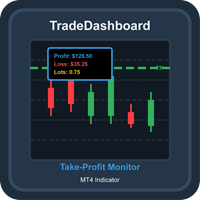
TradeDashboard Comprehensive MT4 Indicator for Trade Visualization and Analysis Overview TradeDashboard is a powerful MetaTrader 4 indicator designed to enhance your trading experience by providing real-time visualization of take-profit levels for all open positions. This advanced tool goes beyond basic TP indicators by displaying comprehensive metrics including potential profits, losses, and total lot sizes, all directly on your chart. Key Features Take-Profit Visualization : Clearly displays h
FREE

Shows on the chart a two moving averages histogram. It allows to send alerts to MetaTrader platform when the crossovers occurs. You can use it on any timeframe, moving averages settings can be adapted as well as the appearance and colors.
The parameters for the indicator are Fast moving average period Slow moving average period Moving Average Mode Moving Average Price Alert on crossovers Histogram Bar Width Bullish Color Bearish Color
FREE

Multi-Asset Forex Scanner
This indicator allows you to scan multiple assets at once, sending you configurable alerts when any asset touches daily pivot levels 1, 2 or 3.
The original code was just modified to send alerts to MT4 Desktop, MT4 Mobile or Email. (Credits for the original code go to Carlos Oliveira)
In order to receive mobile or Email alerts you must configure Notifications and Email sections in the MT4 platform.
In addition to pivots, this indicator also shows ATR, Volume, RSI,
FREE
Shows Kaufman Efficiency Ratio value and smoothed by MA. Calculation is based on movement divided by volatility on a specified period. Levels are adjustable as well as visualization. Parameters: KERPeriod - period for ratio calculation. EMAPeriod - period for moving average. Shift - indicator shift. HigherLevel - low value of the higher zone. LowerLevel - high value of the lower zone. ShowHigherZone - allow higher zone drawing. HigherZoneColor - higher zone color. ShowLowerZone - allow lower zon
FREE
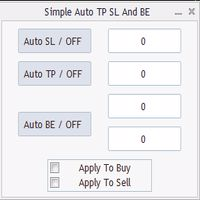
Program for automatic placement of stop loss and take profit orders. Values are calculated as points distance from open price. BreakEven option is also included. all options could be applied to BUY, SELL separately or together. Enter values in points in the fields on the right side of the menu and press dedicated button to aplly your settings.
If in doubt, The instruction is displayed in the tooltip.
FREE

OneClickClose-Pro EA allow users to easily close all positions at once with multiple options with simple UI.
Options Includes::
1. Close All Positions
2. Close All Buy Positions
3. Close All Sell Positions
4. Close All Position GreaterThan or Equal to Profit
5. Close All Position LessThan or Equal to Profit
6. Close All Position By Symbol
7. Option to Set Deviation
8. Option to Set Maximum Retry (If position close fails)
MT5 Versio
FREE

Rainbow MT4 is a technical indicator based on Moving average with period 34 and very easy to use. When price crosses above MA and MA changes color to green, it’s a signal to buy. When price crosses below MA and MA changes color to red, it’s a signal to sell. The Expert advisor ( Rainbow EA MT4) based on Rainbow MT4 indicator, as you can see in the short video below is now available here .
FREE

This classic "old school" MAGIC MACD indicator gives you the cross of the parameters you set. Standart setting is (12,26,9) . The arrows give you a possible change of trend. Be careful and do not use this indicator as a single signal source.
FREE version Please feel free to check out our other REX indicator series. We do have other free indicators.
"OLD BUT GOLD"
FREE
A simple Utility Trading Tool for calculating your profits automatically.
once your orders are active, it calculates your profit or loss in pips value and displays it at the bottom right corner of the screen.
ADVANTAGES - shows order movement graphically - Helps you calculate profit and loss percentages per trade in each asset. - Shows progress of each trade - Easy trading - Helps you meet daily profit targets - Professional trading
FREE

MultiTP Trade Manager EA — Advanced Trade Management Made Effortless (MT4)
Limited Offer – First 100 Downloads FREE!
Be among the first 100 traders to download Trade Anchor Manager (MT4/MT5) completely free of charge. Hurry – once the limit is reached, the offer closes instantly! After trying it out, we’d love if you could leave a review and share your thoughts – your feedback helps us improve and lets other traders know what to expect.
Need this Trade Anchor Manager for MT5? http
FREE

This creative simple indicator will provide a precise framework for market sentiment within technical analysis of different timeframes. For instance, for traders like me that uses "Mark Fisher" strategy regularly, this is a perfect indicator for having an insight to markets from short term to long term point of view, using Break points of candles' lows and highs and perfect to combine with "Price Action" . For more options and modifications you can also edit the low timeframe candles withi
FREE
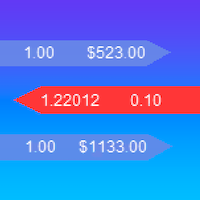
iExposure SYL displays information about opened trades considering commissions and swap, which affects the open price and the final outcome and and also allows drawing virtual transactions and calculating possible profits and losses in advance.
Differences from iExposure indicator of MT4: Separate profit column for BUY and SELL Trade open price considers commission and swap The indicator will come in handy for any hedging strategies that involve opening a large number of oppositely directed
FREE
The purpose of this new version of the MT4 standard indicator provided in your platform is to display in a sub-window multiple timeframes of the same indicator. See the example shown in the picture below. But the display isn’t like a simple MTF indicator. This is the real display of the indicator on its timeframe. Here's the options available in the FFx indicator: Select the timeframes to be displayed (M1 to Monthly) Define the width (number of bars) for each timeframe box Alert pop up/sound/ema
FREE

IceFX Heatmap is a special indicator that shows the places where the price has been staying and ranging over the past few days. These sites will be displayed in a "Heatmap style", with which you can clearly see the main formed bands. The main rates (where the price has "lingered/stayed" much) are indicated in bright colors (in case of black-and-white view) or red color (in case of color view).
Settings Days - the number of days the heat(map) is calculated for. Resolution - resolution rate. 10 =
FREE
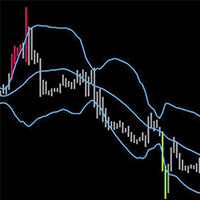
BB & RSI Candle Color: Technical Analysis Indicator on MetaTrader 4 The "BB & RSI Candle Color" indicator is a powerful technical analysis tool designed for MetaTrader 4 traders looking for an effective visual representation of market conditions. Created by 13 Crow Trading Club, this indicator combines the popular Bollinger Bands and the Relative Strength Indicator (RSI) to provide clear and accurate visual signals. This indicator offers three key aspects: Candle Color: Normal candles are displa
FREE

AD Trend line draws trend lines on the basis of A/D indicator (Accumulation/Distribution). When A/D indicator breaks a trend line, the probability of the trend reversal is very high. This is a multitimeframe indicator which can display values from higher timeframes. Parameters Time-frame — Select a timeframe; zero is the current timeframe of the chart; Trend Line — Display lines on the chart; Apply to — Apply lines to close the candle's highest/lowest value; Width line — Width of the line; Style
FREE
Introduction and Description
Colored candlesticks showing the trend based on two moving averages and the slope of the slow moving average. A trend is the overall direction of a market or an asset's price. In technical analysis, trends are identified by trendlines or price action that highlight when the price is making higher swing highs and higher swing lows for an uptrend, or lower swing lows and lower swing highs for a downtrend. Many traders opt to trade in the same direction as a trend, whil
FREE

Introduction and Description
The indicator displays an arrow whenever a " Bearish Engulfing " is detected. The latter usually indicates the beginning of a downward trend. A bearish engulfing pattern is a technical chart pattern that signals lower prices to come. The pattern consists of an up candlestick followed by a large down candlestick that eclipses or "engulfs" the smaller up candle. The pattern can be important because it shows sellers have overtaken the buyers and are pushing the price mo
FREE

Change All Timeframe – Instantly Sync Timeframes Across All MT4 Charts Effortlessly change the timeframe of all open charts in MT4 with a single action! The Change All Timeframes script saves time by ensuring all charts update simultaneously, streamlining multi-timeframe analysis. One-Click Timeframe Sync – Instantly change the timeframe on all open charts at once.
Save Time & Effort – No need to adjust each chart manually—boost your trading efficiency.
Seamless Multi-Timeframe Analysis –
FREE

Stop exporting CSV files by hand. TX Journal Sync keeps your TX Journal trading diary up to date automatically: it reads your account history and open positions and securely pushes them to your journal at the interval you choose. Security first 100% read-only: this utility never opens, modifies or closes trades. Every upload is signed with HMAC-SHA256. Your Secret never leaves your terminal. Only trade data is sent: symbol, direction, volume, prices, times, profit, commission and swap. Nothing e
FREE

GBP INDEX
The Currency Index Project is ONE part of a thorough Forex study. Many people do not know the theoretical basis that drives currency exchange rates to move on the market. With this set of tools you will be able to have a more complete view of the entire market by analyzing not only the single currency of an exchange, but all the exchange rates that make up that currency by looking at a single window!
The indicator faithfully represents the real index of a single currency present in a
FREE

Indicador de Fibonacci Semanal para MT4 Maximize suas operações no mercado financeiro com o Indicador de Fibonacci Semanal para MetaTrader 4 (MT4) , a ferramenta essencial para traders que buscam identificar pontos estratégicos de suporte e resistência com base na ação do preço da última semana. Principais Recursos: Atualização Automática : O indicador recalcula os níveis de Fibonacci automaticamente a cada novo candle semanal. Níveis Personalizados : Traça apenas os níveis essenciais de Fibonac
FREE

MT4 CCIダッシュボードスキャナーは、さまざまな時間枠と商品にわたるコモディティチャネル指数(CCI)レベルを追跡し、新しいシグナルが検出されるとリアルタイムでアラートを提供します。ユーザーフレンドリーで、コンピュータの処理能力に優しく、どのコンピュータでもスムーズに動作します。 主な機能: 自動インスツルメントグルーピング: スキャナーは、マーケットウォッチリストからすべてのインスツルメントを収集し、カテゴリ(メジャー、マイナー、エキゾチック、その他)に整理します。設定の簡単なチェックボックスインターフェースを使用して、スキャンするインスツルメントを簡単に選択できます。 カスタマイズ可能な時間枠選択: 設定ページから、9つの異なる時間枠のいずれかを選択してスキャンできます。選択されたすべての時間枠はダッシュボードに表示され、新しいシグナル通知が各時間枠ごとに送信されます。 簡単なCCI設定: CCIの設定(期間や適用価格)を調整し、買い/売りレベルを設定できます。現在のキャンドルまたは最近のクローズドキャンドルに基づいてスキャンするかを選択することも可能です。 色のカスタマイズ:
FREE

This indicator helps you to Scan symbols which are in the Market Watch Window and filter out trends with alerts. It works based on the effective indicator "SUPERTREND" which is used by many traders for trading: When box color changes to " Green " or " Red " color, it indicates you for trend change for long and short entry. And also you will get alerted on screen. When it changes to " Green ", it indicates you that trend is going upwards, and you can take the long entry. If the color changes to
FREE

O EA "Surprising" é um robô inteligente que abre ordens em momentos estratégicos, sempre buscando lucro e segurança da conta. Pode ser usado em vários ativos, mas provou ser mais lucrativo em Ouro. O timeframe M5 ou M30 é muito bom para este robô. Se houver uma única ordem aberta, ele a fechará usando o trailing stop, buscando o melhor lucro. Se o preço se mover na direção oposta à ordem aberta, ele abrirá uma nova ordem do mesmo tipo na próxima zona de suporte ou resistência para compensar a o
FREE

保有ポジション/指値注文の一括SL/TP設定とキャンセルクローズ機能と含み益でのトレインリグストップ機能を持ったEAです。 [ポジション操作] -SL入力ボックス :SL値を価格で入力して左横の「SL」ラベルをクリックすると一括でSL設定が適用されます。 - TP入力ボックス :TP値を価格で 入力して左横の「TP」ラベルをクリックすると 一括でTP設定が適用されます。 - Pending :右側のボタンがTrueの時に指値注文への一括SL/TP設定がされます。Falseの時は指値注文へは一括SL/TP設定はされません。 - Open :右側のボタンがTrueの時にオープンポジションへの一括SL/TP設定がされます。オープンポジションへは 一括SL/TP設定はされません。 - ClosePending :現在の指値注文を一括でキャンセルします。 - CloseOpen :現在のオープンポジションを一括で決済します。
-補足- 設定したSL/TPをキャンセルするには、キャンセルしたい方(SL or TP)の入力ボックスに0を入力して左横の「SL」or「TP」ラベルをクリックするとキャン
FREE

The indicator marks bars with a simple trend definition“ each subsequent high above/below the previous one and each subsequent low above/below the previous one ”. Charles Dow
Formula:
Max – The current maximum Min – The current minimum MaxK – Maximum per period MinK – Minimum per period Min>MinK & Max>=MaxK – Symbol on top Max<MaxK & Min<=MinK – The symbol on the bottom
Input parameter:
Number of bars in the calculated history Period for current timeframe The distance to the symbol Se
FREE

Trend indicator Trend Esay MTF is an indicator that draws arrows directly on the price chart. Like every trend indicator, it works well with good price movement and worse in a flat. A feature of this indicator is the ability to send alerts both in the terminal and on a smartphone. The indicator menu contains the number of bars in the history of the indicator and period value for determining the trend. The "trend" function has been added to the indicator menu, which filters the indicator signals
FREE

ATR-normalized slope oscillator designed to measure price acceleration relative to volatility. This zero-centered histogram clearly reflects trend strength, impulse changes, and divergence between price and momentum. The indicator does not repaint historical values and works on any symbol and timeframe. It can be used as a standalone analytical tool or as an external oscillator inside Dynamic_Divergence_Universal_PRT for professional divergence detection. https://www.mql5.com/ru/market/product/1
FREE

Overview Inspired by Tradingview’s falconCoin, The Market Cipher indicator is a momentum oscillator used to detect overbought/oversold conditions and potential trend reversals. Traders can also use it to spot divergences between price action and momentum for early entry or exit signals. Configuration Guide Core Indicator Settings The indicator calculates momentum using a short-term and a longer-term average. Momentum is plotted as a wave oscillating between overbought and oversold thresholds. Ov
FREE
「MultiSymbol & TF Chart Integrated」インジケーターは、迅速に包括的な市場ビューを提供するために設計されており、好みの時間枠で最大60の通貨ペアを単一のチャートで監視すること(複数モード)や、すべての時間枠で取引しているペアを表示すること(シンプルモード)を可能にします。 主な利点: 完全監視: 単一のチャートで希望するすべてのペアを一目でリアルタイムで監視できます。
時間節約: チャート間の切り替えを避け、各ペアの動きをリアルタイムで確認できます。
トレンド分析: トレンドフォローのトレーダーに最適で、意思決定前にトレンドを確認するために上位の時間枠を見ることができます。
極端なカスタマイズ: インジケーターのすべての側面を特定のニーズに合わせて調整します。 極端なカスタマイズ: 高度に設定可能なインジケーターパラメーター:
シンボルと時間枠: 最大60の異なるシンボルを設定できます。 各シンボルには独自の時間枠を持つことができます(例:M1、M5、M15、M30、H1、H4、D1、W1、MN1)。 表示モード: シンプルモード: 特定の時間枠で単一
FREE

PalmyTTS_For_IB – Trend-based Martingale EA Description: PalmyTTS_For_IB is a fully automated trading robot designed for cent accounts and high-lot generation systems, perfect for IB commission strategies. It uses a smart Martingale algorithm combined with trend-following logic from higher timeframes (M15 and H1), with no stop loss. The EA aims for small, consistent profits by closing all trades once a specified net profit is reached. Key Features: Trend-Based Entry: Uses EMA crossover on M15
FREE

Timezone Filter EA: Precision Trading with Session Control The Timezone Filter EA is an essential tool for traders looking to refine their trading strategy by restricting trade execution to specific trading sessions. Designed for precision and discipline, this EA allows traders to filter which trading sessions they want to engage in—such as Asian, London, or New York sessions —while ensuring that no trades occur outside the defined time periods. Key Features: Customizable Trading
FREE
Chart Time Indicator is very simple and easy, but it can be very important to control the time before opening any manual trade. This indicator shows the time on the chart between 3 different options.
Input parameters Show Time : Select all the time options that you want to see. Local Time (Personal Computer Time), Server Time (Broker Time) or GMT Time. Recommendations: Use only one Chart Time Indicator for each chart.
FREE

このロボットのロジックはシンプルです。しかしとても強力です。
長期ローソク足で現在のトレンドをモニターしています。複数のローソク足を使うことで信頼性を高めています。
最初にEAは、現在のトレンドをモニターします。その後、トレンドに沿ってオーダーを出します。
オーダーを出すタイミングは、内部のRCIインジケーターを参考にしています。 RCIのエントリーする値は自由に設定可能です。値を1に近づけると正確ですが、エントリー回数は減少します。
TP=50,SL=50でトレードしますが、もしストップロスになってしまった場合、トレンドとは逆の方向にロットサイズを上げてエントリーします。
設定で変更も可能です。
どうぞお楽しみください。
FREE

Mini Assistant is a small training tool in the strategy tester. A minimal set of buttons provides ease of use. There are no external parameters; they are simply not needed here. All you need is right on the screen. Before opening a position, in the special input windows, specify the required volume, as well as Stop Loss and Take Profit levels. To close a position, select it by ticket in the lower window. The program was written quickly, and also does not have a special uniqueness, so I post it i
FREE

CCI Trend Finder indicator with different colors at levels 0, 100 and -100. The cross is a signal for "123 Exit" as presented by MPlay and used in Woodies CCI system. This exit signal is effective especially in short-term breakout trades, because it prevents early exiting at small corrections. This indicator is great for having it as an extra tool for your analysis.
FREE

追加のクリックなしで2EMAの交差点に基づいてトレンドを見ることができるマルチ通貨、マルチタイムフレームインジケーターは、すべての時間枠で最後の交差点を一度に検索し、開いている通貨ペアのトレンドがどの方向に向けられているか、および最後の交差点がどれくらい前にあるかを左上隅に書き込みます。
この指標に基づいて、ほとんどの傾向が1方向に向けられている場合は注文を開始し、状況が変化したときに取引を終了することができます。
インジケータはチャート上にEMAを描画しません。これにより、空き領域を有利に使用することができます。rsiやMACDなどの追加の確認インジケータを追加できます。
この指標は、平均価格で計算された高速と低速の2つのEMAに基づいています。 速い-24の期間があり、遅い-60は、周波数を失うことなく、より多くの偽の信号を遮断することができます! 私は他に何を改善し、改善することができるかを知ることができるように、レビューの形でフィードバックを残してください!
FREE

As we know, МТ4 and МТ5 do not store tick history, which may be necessary to develop trading strategies and market analysis. I have developed a method allowing you to receive tick history very easily. The indicator gathers tick history in real time and writes it to XXXXXX2.hst file, where XXXXXX is a symbol name. This file can be used to create an offline chart or something else. If you use a trading robot, then launch the indicator and control your broker by examining the spread and quotes. All
FREE

This Dashboard is free to download but is dependent on you owning the Advanced Trend Breaker . Get the indicator here: https://www.mql5.com/en/market/product/66335
The Dashboard will show you on a single chart all the timeframes (M1 to Monthly) with their own status for the indicator: Advanced Trend Breaker
all time frame and all symbol: smart algorithm detects the trend,Support and resistance, filters out market noise and find breaker of entry signals!!!
!!!
How to understand th
FREE
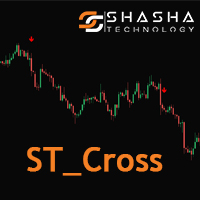
Introduction The ST Cross indicator is based on the traditional Moving Average (MA) Cross which uses a fast and slow moving average. Entry signals to buy and sell are given when both moving averages cross. However with the basic strategy there are a lot of false signals. In order to filter the trades we use the 200 (MA) to identify the overall direction of the trend. Input Settings Master Trend Period - 200 Period moving average used to get the trend direction. Fast
FREE
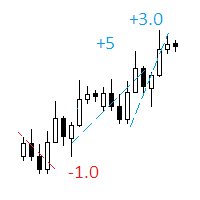
The indicator displays on a chart trading results. You can configure the color and font of displayed results, as well as filter trades based on the magic number. If multiple trades were closed within one bar of the current timeframe, the result is summed and output in one value.
Utility parameters Plot profit in - the format of output results: wither in deposit currency taking onto account commission and swap, or in points. Start from - start processing data at the specified time. Plot last dea
FREE
移動平均線を微調整するための究極のツール これは、移動平均線の設定を簡素化し、最適化するために設計された高度なツールです。MAチューナーを使用すると、ユーザーフレンドリーなパネルを通じて、主要なパラメーター(期間、シフト、メソッド、価格)を簡単に調整でき、キャンドルが移動平均線を交差する頻度や、それに対するオープンおよびクローズの位置に関する詳細な統計情報を即座に取得できます。 なぜ、標準の移動平均線インジケーターよりも優れているのでしょうか? 標準の移動平均線インジケーターと同じMAラインを描画しながら、MAチューナーでは、期間を1ずつ増やすたびにインジケーターウィンドウを開く必要がありません。さらに、シフトや他の調整もスムーズに行えるため、より効率的なトレーディングが可能です。
FREE

製品名 Smart Parabolic SAR (MT4) – SmartView シリーズ 短い説明 MetaTrader プラットフォームで独特なユーザー体験を提供する Parabolic SAR インジケーター。以前は利用できなかった高度な機能を提供し、ダブルクリックで設定を開く、削除せずにインジケーターを非表示/表示する、インジケーターウィンドウをチャート全体のサイズで表示するなどの機能を備えています。SmartView Indicators シリーズの残りの部分とシームレスに連携するように設計されています。 概要 SmartView シリーズは、革新的な機能を通じて MetaTrader プラットフォーム上のインジケーターに独特で特徴的なユーザー体験を提供し、インジケーター管理をより速く、より簡単にします。各インジケーターには、チャート上のスマートコントロールパネルが装備されており、基本情報を表示し、すべての重要な機能への迅速なアクセスを提供します。 以前は利用できなかった独自の機能 SmartView シリーズは、インジケーターでの作業をより簡単で迅速にする高度な機能を提供
FREE

製品名 Smart MACD (MT4) – SmartView シリーズ 短い説明 MetaTrader プラットフォームで独特なユーザー体験を提供する MACD インジケーター。以前は利用できなかった高度な機能を提供し、ダブルクリックで設定を開く、削除せずにインジケーターを非表示/表示する、インジケーターウィンドウをチャート全体のサイズで表示するなどの機能を備えています。SmartView Indicators シリーズの残りの部分とシームレスに連携するように設計されています。 概要 SmartView シリーズは、革新的な機能を通じて MetaTrader プラットフォーム上のインジケーターに独特で特徴的なユーザー体験を提供し、インジケーター管理をより速く、より簡単にします。各インジケーターには、チャート上のスマートコントロールパネルが装備されており、基本情報を表示し、すべての重要な機能への迅速なアクセスを提供します。 以前は利用できなかった独自の機能 SmartView シリーズは、インジケーターでの作業をより簡単で迅速にする高度な機能を提供します: ダブルクリックで設定を開く
FREE

Export Order History Free ! Meta Trader 4 script Please leave a review about this product to help other users benefit from it. Export trades history into a CSV file ( Excel sheet ) The summary is saved into a file in MQL4\Files folder. Choose / A ccount history / C ustom period from your MT4 Select period Click OK to Export file directory Open MT4 data folder CSV file ( Excel sheet ) Order > Open time > Close time > Type > Symbol > Size > Entry price > Exit price > T/P >
FREE

Higher Timeframe Chart Overlay will display higher timeframe candles, including the number of candles high/low you specify.
You no longer need to switch timeframes to check the candles. Everything can be shown in one chart. Get Full Version - https://www.mql5.com/en/market/product/115680 Please feel free Contact me if you have any questions regarding this tool.
FREE

Stop and Reverse Martingale EA is an expert advisor that integrates the following inputs within it: Start lot size Lot multiplier Take profit distance in points Take profit distance in points *this input is a stop loss, is misspelled within the code of the EA Magic number A and B Start cycle with round number The distance of round number Daily maximum orders per cycle and close all Daily loss (maximum orders per cycle when this last order hit the stop loss the EA close all orders in the same m
FREE

iCUSTOM INDICATOR TESTERはCODERS用のツールですが、それだけではありません。 これは、.mq4ファイルとしてのソースコードがなく、コンパイルされた.ex4ファイルのみの場合でも、特にカスタムインジケーターをテストおよびチェックするために設計されたプログラムです。
トレーダーはインジケーターをテストし、アイデアがインジケーターデータと関連付けられているかどうかを確認します。アイデアが実際に計算され、この特定のインジケーターに基づいてEAを作成できるかどうかを確認します。 開発者とトレーダーの両方の時間を節約できます。
インジケーターの名前をINDICATORのNAMEフィールドに入力し、.ex4インジケーターファイルをインジケーターフォルダーに入れてください。
プログラムは、最初の64個のバッファの現在の値を表示します。
BUFFER値が常にゼロに等しい場合、このBUFFERはアクティブではない可能性があります。
FREE

ボタン一つ。クリック一回。ネイキッドチャート。 MT5 version
全部描きました。トレンドライン、フィボナッチ、矩形、ゾーン、矢印… チャートはモダンアートのキャンバスのようです。美しい — でも価格がもう見えません。 NAKED CHART がワンクリックで解決します。 1回クリック → すべての描画が即座に消えます もう1回クリック → すべてそのままの状態で戻ります インジケーターは影響なし — 描画オブジェクトのみ非表示 ドラッグ可能なボタン — チャート上の好きな場所に配置 設定不要。複雑さゼロ。ただ、すべてを変えるボタンがあるだけ。------------------- --------------------- 「時に、最もシンプルなチャートが最も強力だ。」
— SPARTACUS2026
FREE

Marginhedged 情報インジケーター。 ロット-計算に必要なロットを設定し、入力フィールドを使用して設定します MARGININIT-指定されたロットの初期証拠金要件 MARGINHEDGED-セットロットごとの重複注文から請求されるマージン PERCENT- 重複した注文に請求されるマージン(パーセンテージで表される) インジケーター設定の説明: _color-色を設定します インジケーターの使用例:
ロット1の1つの買いポジションが市場で開かれています。この場合の証拠金要件は$ 10に対応します。
ロット1で売りポジションを開くと、必要な証拠金の合計は5ドルになります。
または50%。
インジケータは、特定のロットのこの情報を示します。
FREE

The advisor NewsCatcher Free opens trades when the price makes a reversal move from support and resistance levels. Market entries should be confirmed by the Relative Strength Index (RSI). The RSI is implemented as a tachometer.
It is recommended to use this advisor in a highly volatile market after a political event or a release of major economic data.
You can use this advisor in the semi-automated mode (the RSI performs an information role) or in the fully automated mode (the RSI decides when t
FREE
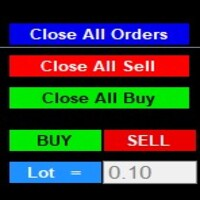
After purchase : - Please contact me at telegram https://t.me/SmartForex777 This Smart Dashboard Penal Very Easy , Fast And Accurate to Enter And Exit Trade Manually... Unique features Close All Orders... Close All Sell... Close All Buy... Buy / Sell... Lot Size Change Option... Works on any account type and broker... Works with all times frames and currency...
FREE
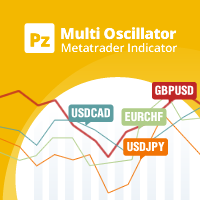
マルチオシレーター は、マルチ通貨およびマルチタイムフレーム取引のための究極のスイスアーミーナイフです。単一のチャートに多くの通貨ペアおよび/またはタイムフレームの目的のオシレーターをプロットします。市場のスクリーニングツールとして、または洗練されたマルチタイムフレームインジケーターとして、統計的裁定取引に使用できます。 [ インストールガイド | 更新ガイド | トラブルシューティング | よくある質問 | すべての製品 ] 簡単な解釈と構成 16個の既知のインジケータをサポート チャートには最大12通貨ペアを表示できます また、単一の機器の複数のタイムフレームを表示できます 入力でシンボルと時間枠をカスタマイズ可能 カスタマイズ可能なオシレーターインジケーター設定 カスタマイズ可能な色とサイズ 幅広い市場の見通しを提供するために、異なるオシレーターを使用して、干渉なしで同じチャートにインジケーターを何度もロードできます。このインジケーターは、次のオシレーターをサポートしています。 RSI CCI ADX ATR MACD オスマ デマーカー 確率的 勢い 強制インデックス マネー
FREE

Based on a combination of indicators, E13 Acid Fulx is an excellent indicator for knowing when to buy or sell on any asset and temporaryity. The indicator myself I have used it as a tool for my analysis when trading Forex. It is a useful and easy-to-understand trend indicator. If you combine it with your own analyses you will surely get a good result in your operation.
FREE

FusionAlert StochRSI Master is an indicator available for MT4/MT5 platforms, it is a combination of RSI & Stochastic indicator which provide "alerts" when the market is inside "overbought and oversold" regions combined for both indicators, results in more precise and accurate signals to be used as a wonderful tool, in the form of "buy or sell" signals. This indicator comes with many customization options mentioned in the parameter section below, user can customise these parameters as needful. Jo
FREE

Binary Options Assistant (BOA) ICE Signals Indicator provides signals based on gkNextLevel Binary Options Strategy. Indicators: 2 Bollinger Bands & Stochastic
Stop missing trades, stop jumping from chart to chart looking for trade set-ups and get all the signals on 1 chart! U se any of the BOA Signals Indicator with the Binary Options Assistant (BOA) Multi Currency Dashboard .
All BOA Signal Indicator settings are adjustable to give you more strategy combinations. The signals can be seen
FREE

This EA helps traders in the following benefits : - show the entry point for sell or buy orders that you makes. -show the TP & SL levels on chart - control the lot size - control the TP & SL level in points - works on all chart period - rising algo trading rank in your signal - closing all deals in one click - closing only profitable deals - closing only losable traders enjoy
FREE
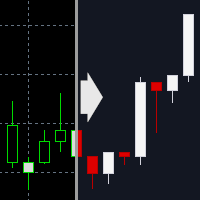
MetaTrader 4 のチャートをダークテーマに切り替えるインジケーターです。 視認性を重視しつつ、長時間のチャート監視でも目の負担を減らせるよう、落ち着いた配色を目指しました。 全チャートに一括適用する機能も選択でき、適用後は自動でインジケーターが削除されるため、余計な常駐インジケーターやオブジェクトは残りません。
【こんな方におすすめ】 MT4 の見た目を簡単に整えたい方 明るいチャートが眩しく感じる方 長時間のチャート監視で、目の負担を減らしたい方
【使い方】 対象のチャートを開き、「Ast ChartTheme Dark for MT4」を適用します。 必要に応じて [Settings] / [Colors] のパラメーターを変更します。 OK を押すと、チャートがダークテーマに切り替わります。
【パラメーター一覧】 Settings(設定) Apply to all open charts
現在のチャートのみ適用するか、開いている全チャートに同じテーマを適用するかを選びます。 Remove indicator after applying theme
テーマ適用
FREE
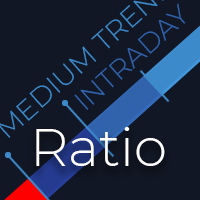
The indicator helps to determine the potential for price movement within the day and on a trend. For calculations, the average price movement on the instrument is used. If you have a problem setting TP, the indicator allows you not to overestimate your expectations. For volatile instruments, the SL position can also be taken into account. If the entry was in the right place, the risk / reward ratio will prompt a profitable level for profit taking. There is a reset button at the bottom of the sc
FREE

The indicator based on (Williams` Percent Range) analyzes the signal line touches along the channel walls and forms zones for deciding on the direction of the price movement. For convenience, an alert function is built in. You can also enable and disable the desired zones. Several indicators with different settings can be used on one chart. This will help you choose the best strategy.
FREE
MetaTraderマーケットはトレーダーのための自動売買ロボットやテクニカル指標を備えており、 ターミナルから直接利用することができます。
MQL5.community支払いシステムはMetaTraderサービス上のトランザクションのためにMQL5.comサイトに登録したすべてのユーザーに利用可能です。WebMoney、PayPal または銀行カードを使っての入金や出金が可能です。

取引の機会を逃しています。
- 無料取引アプリ
- 8千を超えるシグナルをコピー
- 金融ニュースで金融マーケットを探索