YouTubeにあるマーケットチュートリアルビデオをご覧ください
ロボットや指標を購入する
仮想ホスティングで
EAを実行
EAを実行
ロボットや指標を購入前にテストする
マーケットで収入を得る
販売のためにプロダクトをプレゼンテーションする方法
MetaTrader 4のためのエキスパートアドバイザーとインディケータ - 70

Основное удобство донного индикатора в том, что он не назойлив как большинство, он хорошо показывает среднюю цену на текущем графике. индикатор информирует о количестве открытых позиций по текущему инструменту, а так же по всем открытым инструментам в том числе. при расчете средней цены учитывает комиссию и свопы, показывает чистую цену. Отображается на графике внизу экрана, есть возможность менять цвет и размер шрифта.
FREE

Introducing Demarker Jurik—an innovative indicator poised to revolutionize your forex trading strategy. This indicator combines the precision of custom moving averages based on the Demarker indicator with the MetaTrader 4 indicator, Demarker.
Jurik moving averages are renowned for their accuracy and reliability in analyzing price movements in the forex market. They offer traders smoother representations of price action, filtering out noise and providing clearer signals for identifying trends a
FREE

#########################################################################################
WeekendGap EA opens pending orders in the first hour of the beginning of a new week. It trades the weekend gap. The pending orders are cancelled within 2 days if not caught. WeekendGap works on most currency pairs, but you may limit yourself to the majors. The lot size is increased automatically based on the MinimumLots, MaximumRisk and DecreaseFactor. #######################################################
FREE
Euro Momentum es un EA que opera en el par EURUSD,en temporalidad de 5 minutos. Usa el canal de Donchian y el indicador de Momentum para determinar los momentos de entrada y salidas en el mercado en base a la tendencia existente y al volumen. No se usan sistemas de GRID,ni martingala,así como estrategias de entrada en las aperturas de mercado,ni momentos donde los spreads son muy altos ,ni ninguna otra práctica dañina para la cuenta. El lotaje recomendado según el capital sería: Cuenta de 1000 =
FREE

MP Price Change Indicator is a tool to calculate the price movement by percentage. The Value of this indicator can be adjusted to look back of the percent of price change within certain timeframes. This is a powerful tool when used by other indicators as well, such as ATR and ADR, for understanding price fluctuations and tolerance in different strategies. ___________________________________________________________________________________ Disclaimer:
Do NOT trade or invest based upon the analysi
FREE

It's a simple but useful tool for creating a grid based on Envelopes.
Only 2 parameters can be set: 1) "Period" - the period of all visible Envelopes (i.e. 4) and 1 Moving Average (Envelopes axis), 2) "Deviations Distance" - the distance between Envelopes.
Naturally, the colors of all 9 lines can be changed as desired. It works with everything that is available in your Market Watch.
Good luck!
FREE

EWELDE PRICE LOP MT4 Test the EA first in a Demo Account. Unlimited default Settings to Change for other Indizes or Pairs.Recomment Broker "IC Market, FTMO”. This Settings only Indize DE40 and 1000$/€ Startcapital, 1-5 Lot in first Week Timeframe M1 or M5.This EA BUY and SELL in one EA, 09:00-18:00 Clock Robo- Worktime. The EA Buy and Sell over and under the 50 Level. For DE40 you must nothing Change, set the EA on your MT4 Desktop and Start.
FREE

Super Channels indicator is a channel indicator created by calculating support and resistance levels. It calculates by taking the average of support and resistance levels. After determining the number of candles, it takes the levels of the number of candles and creates an autonomous channel according to these levels. If you want to calculate how many candles, you must enter the number in the parameter section. Also, there are two types of modes in the indicator. The first is to calculate based o
FREE

THIS FREE INDICATOR ALLOWS YOU TO SET THE TIMEFRAME OF THE MA YOU WANT ON YOUR CHART For example, it's very useful if you want to trade the H4 200 SMA using a lower timeframe chart, to identify price reactions such as reversals, Wyckoff schematics, etc. ***Please comment, rate and share it to your friends if you like it*** ------------------------------------------------------------------------- Moving averages are popular technical indicators used to identify trends, support and resistance leve
FREE

Supertrend Moving Average A combination of Supertrend and Moving Average to create a converging trade setup Input parameters: signal mode: set it to true if you want to plug it into STAT (Signal Tester and Trader) arrow shift: distance between fast EMA line to arrow on chart turn on price line filter turn on moving average signal for converging setup k period d period s period averaging method Moving average period Averaging method upper level limit (Stochastic) lower level limit (Stochastic)
FREE
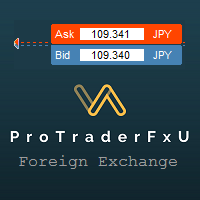
Description: - BidAskLine Indicator is very simple and easy, but each utility can be important in the probability that we will win in our trade. This utility Indicator shows lines and prices of the Bid, Ask and Spread. Input Parameters: - Visual Aspect Options : Select between 2 options with Box or Simple Style. - Parameters Bid Price : Select between show or hide line or box objects, change color, style or width line. - Parameters Ask Price : Select between show or hide line or
FREE
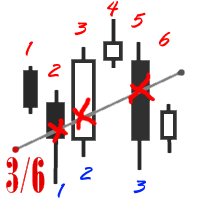
The utility simplifies the search for maximum bars accumulation levels. These levels can be used both for technical analysis and trading actions, like setting a stop loss or pending orders. Additional analytical methods are recommended for levels confirmation.
How it works Сounter mode (enabled by default). In the Сounter mode, draw a trend line on the chart and the utility will specify its length in bars as well as the number of bars the line crosses. When moving a trend line, the utility re-c
FREE

The Telegram EA can be used in conjunction with Abiroid Dashboard products. Detailed blog post with screenshots explained: https://www.mql5.com/en/blogs/post/758932
1. Abiroid Dashboards Setting: Within the Dashboard you have to set “File Alerts” to true. No need to give it a custom file name. It will use default file name and File will be created inside MQL4/Files folder. They will use “Prefix” setting as prefix by default. Unless you specify a Custom File Name. Then use this EA, and it will
FREE

Area 51 EA generates signals on different strategies. Has different money management strategies and dynamic lot size function. When a position is opened, it is equipped with a take profit and a stop loss. If the position becomes profitable, a dynamic stop loss based on the specified values (TrailingStep and DistanceStep) will be set for it and constantly trailed. This allows you to always close positions in profit. For using the EA we recommend to use an ICMarkets True ECN account. Parameters
FREE

Indicator of vertical lines on the timeframes М5 and М1. It draws the lines for the period of the current day and the previous day. This indicator visualizes visually shows the trader the beginning and end of the chart hour, as well as the past hourly periods, 30-minute and 5-minute chart intervals. The advantage provided by this indicator is that the trader using this indicator on a chart of a currency pair with the smaller timeframe will always be aware of when the new hour begins.
On the con
FREE
Copy Template to All Charts – Instantly Apply Your Chart Setup in MT4 Save time and ensure consistency with Copy Template to All Charts , a powerful MT4 script that instantly applies your selected chart template to all open charts with just one click. No more manual adjustments—this tool helps you maintain a uniform trading setup effortlessly. Key Features: One-Click Template Application – Instantly copy your preferred chart template to all open charts.
Save Time & Effort – Eliminate the
FREE

Mini Martinel is a Martingale EA. Its biggest feature is that it can run well for $100 , even $50, and it is not limited to one currency pair. Multiple currency pairs can be used . I personally think that Martin EA is a high-risk gambling behavior, so I hope to participate with the least amount of money, but everyone knows that Martin's theoretical basis is to have unlimited money, so this EA may lose money. Of course, I have limited the amount of loss to it. Under the low-risk mode, the $50 sto

PRO VERSION This free indicator change timeframe of charts(up to 3) at the same time,by clicking a label. If you click the label(shown below),timeframe of charts will change. If you click again,timeframe of charts restore.
You can change the position of the label.
You can change charts up to 3 charts(a paid version enables up to15 charts). You can add second,third timeframe changer label.
This indicator is very useful for speed trading.
There is a more powerful PRO VERSION . The paid versio
FREE

Free version of https://www.mql5.com/en/market/product/44606 Simple indicator to calculate profit on fibonacci retracement levels with fixed lot size, or calculate lot size on fibonacci levels with fixed profit. Add to chart and move trend line to set the fibonacci retracement levels. Works similar as default fibonacci retracement line study in Metatrader. Inputs Fixed - select what value will be fix, lot or profit (available in full version, lot is set on free version) Fixed value - value t
FREE

This indicator is Demo version of FiboRec and works only on EURUSD This indicator depends on Fibonacci lines but there are secret lines I used. By using FiboRec indicator you will be able to know a lot of important information in the market such as:
Features You can avoid entry during market turbulence. You can enter orders in general trend only. You will know if the trend is strong or weak.
Signal Types and Frame used You can use this indicator just on H1 frame. Enter buy order in case Candle
FREE
The utility is designed for placing pending orders Buy Stop, Sell Stop, Buy Limit, Sell Limit with predefined values for each type of orders, number 0 ... 15, distance from current price, Lot, Take Profit, Stop Loss, Magic. Expose and delete by pressing the hot key. How to place and delete orders by voice using the utilities of this type, see the video below the description. https://www.youtube.com/channel/UCTpVWJkEic6TzoXr0qc9RIw/featured Key "A" sends a request for placing orders Buy Stop. Ke
FREE

Non-proprietary study of Joe Dinapoli used for trend analysis. The indicator gives trend signals when the fast line penetrates the slow line. These signals remain intact until another penetration occurs. The signal is confirmed at the close of the period. It is applicable for all timeframes. Inputs lnpPeriod: Period of moving average. lnpSmoothK: %K period. lnpSmoothD: %D period. *****************************************************************************
FREE

Introducing Free Version Of Candle Strike EA , the groundbreaking MQL5 expert advisor that's transforming the way you trade your favorite pairs! Developed by a team of experienced traders with trading experience of over 10 years. What we Got in Free Version: In this version you cannot change the Lot size anda cannot use compound feature. The default lot size is 0.01 Real-time results can be viewed here . Presets for EA here *Promotional Price: $50. The price will increase $25 with every
FREE

Support/Resistance Percent Rank
SR Percent Rank helps to see how many times the current close price has been in the past price range. SR Percent makes a loop over x bars into the past and calculates the percentage of times the current closing price has been between the high and the low price in the x bars before that. So we can determine if the current price is moving at supports or resistance that was formed in the past. I use the indicator when creating strategies with the StrategyQuant X pr
FREE

The ' Average OHLC ZigZag ' indicator was designed for entry confirmations as well as scalping with a larger trend. A custom formula to average the last two bars to generate arrows following market trends with bar 1 confirmation.
Key Features An extreme scalper calculating the averages between the last two market periods to generate a buy or sell arrow. No settings are available due to it's simplicity of custom price action pattern and using repainting four OHLC prices.
Input Parameters ZigZa
FREE

It's an expert to use prices action and trade level to open each order. Expert can to trade up 12 pairs, uses the corresponding default setting for each pair.
Default settings are good for EURUSD pair and IC Markets broker.
Time Frame: H1
Parameters
PresetsParameters = Uses prosets parameters (12 pairs). Broker GMT Offset = Set broker different time from GMT time. Time Frame Use = Time frame of chart to run expert. Type Of Signals = Mode of signals. Time Set Levels = Time set levels to trade.
FREE

If you want to test the functionality of this tool, you can do it trough this DEMO version, that is restricted to work only on EURUSD and USDJPY currency pairs. Full version is available here: https://www.mql5.com/en/market/product/29243/ This EA was originally coded as a back up tool for my personal trades as all of us (Or at least the ones who have left an order open and went to sleep) have experienced the frustration that involves waking up, check the trades and see that in some of them the
FREE
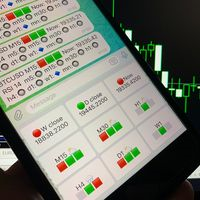
Telegram Candle Map Barometer. I wanted to create an informer that would show in the direction of the candle shadows where the price is moving. When I made the first timeframe, I realized that by combining several, I get an excellent breakout entry indicator. You need to create a Telegram bot for getting an API. Copy main ex4 file to Experts folder and use with settings. Download and enjoy, even receiving signals from MetaTrader, this is true when trading on any exchange. What we have inside: Mi
FREE

The most different product of the site: This tool is an auxiliary tool aimed at managing your trades and psychological discussions. As you probably know, more than 70% of the reason for the success of big traders is psychological issues. Only 30% is related to your strategy. So it is better to strengthen this big part with a tool. With a free tool, I allow you to become a better trader This tool consists of several rules. In version 1.0, we have 7 rules. In later versions, we will add more ru
FREE

この小さなスクリプトはあなたの人生を明るくします。 以下はそのコードです。任意のロボットのOnInitに挿入できます。 または、好みに合わせて色やスケールを変更してください #property copyright "V.Temchenko Skype:vasily.temchenko" #property link " Mailto:tvp.prog.96 @gmail.com" #property version "1.00" #property strict #property description "Have questions? Skype: vasily.temchenko Viber: +38098 800-6-800" ; #property description "If the voice - only Russian, Ukrainian or Belarusian" ; #property description "And you can write in English, Russian, Ukrainian" ; #p
FREE

Based on a combination of indicators, E13 Acid Fulx is an excellent indicator for knowing when to buy or sell on any asset and temporaryity. The indicator myself I have used it as a tool for my analysis when trading Forex. It is a useful and easy-to-understand trend indicator. If you combine it with your own analyses you will surely get a good result in your operation.
FREE

製品名 Smart Momentum (MT4) – SmartView シリーズ 短い説明 MetaTrader プラットフォームで独特なユーザー体験を提供する Momentum インジケーター。以前は利用できなかった高度な機能を提供し、ダブルクリックで設定を開く、削除せずにインジケーターを非表示/表示する、インジケーターウィンドウをチャート全体のサイズで表示するなどの機能を備えています。SmartView Indicators シリーズの残りの部分とシームレスに連携するように設計されています。 概要 SmartView シリーズは、革新的な機能を通じて MetaTrader プラットフォーム上のインジケーターに独特で特徴的なユーザー体験を提供し、インジケーター管理をより速く、より簡単にします。各インジケーターには、チャート上のスマートコントロールパネルが装備されており、基本情報を表示し、すべての重要な機能への迅速なアクセスを提供します。 以前は利用できなかった独自の機能 SmartView シリーズは、インジケーターでの作業をより簡単で迅速にする高度な機能を提供します: ダブルクリ
FREE

製品名 Smart CCI (MT4) – SmartView シリーズ 短い説明 MetaTrader プラットフォームで独特なユーザー体験を提供する CCI インジケーター。以前は利用できなかった高度な機能を提供し、ダブルクリックで設定を開く、削除せずにインジケーターを非表示/表示する、インジケーターウィンドウをチャート全体のサイズで表示するなどの機能を備えています。SmartView Indicators シリーズの残りの部分とシームレスに連携するように設計されています。 概要 SmartView シリーズは、革新的な機能を通じて MetaTrader プラットフォーム上のインジケーターに独特で特徴的なユーザー体験を提供し、インジケーター管理をより速く、より簡単にします。各インジケーターには、チャート上のスマートコントロールパネルが装備されており、基本情報を表示し、すべての重要な機能への迅速なアクセスを提供します。 以前は利用できなかった独自の機能 SmartView シリーズは、インジケーターでの作業をより簡単で迅速にする高度な機能を提供します: ダブルクリックで設定を開く:
FREE
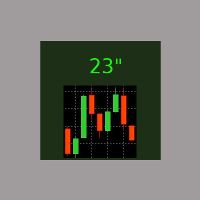
It is the simplest indicator in existence. It has only one function: report the seconds elapsed since the last minute end in a very convenient way, with a label that can be moved in the chart, so that the trader does not have to take his eye off the forming candle. It is used on M1, but also on larger intervals, for those interested in opening/closing positions at the best time. Sometimes an intense movement in the last 10" of the minute gives indications of future trend, and can be used for sc
FREE
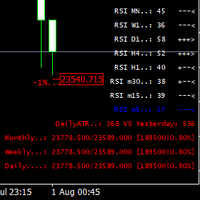
This indicator was created most for personal use. I decided to look up the last 3 bars of RSI, it is good for scalping or for weekly trading and looks as universal fx-toy. In menu you can turn on daily percentage gain info, it is good for crypto as for me, weekly and monthly gains also included as informers. Short ATR helps to determine when price was stopped and entry for pulse pump/dump. The filter of numbers of RSI can be tuned for overbought/oversold values with colors you needed. Exam
FREE

This indicator shows in a subwindow the trend in M1, M5, H1, D1 timeframes based on MA, MACD, Stochastic This way you could see in once in different timeframes what happening. This is my first free indicator. Please follow I will put here some more. Thank you for you attention. . . . . .
lfknglkslksnlgslgnsflgjrpoesv ,msv lkrjpfjésmdg sd.npo4wsmdglknsp4jwpkeégmfs.lkmp Thank you
FREE

Check out other great products from https://www.mql5.com/en/users/augustinekamatu/seller
This indicator is the best so far at determining the currency strength of each pair. It provides stable values and is highly adaptive to market changes. It is a great tool to add to your arsenal to make sure you are on the right side of the trend at all times. No inputs required, it is simple plug and play. A Winning Trading Strategy This article describes the components and logic needed to develop a tra
FREE

ONREX IV ONREX IV is a trading tool that be used to practise and enhance your manual trading skills. It's also Auto Trading Expert Advisor. Don't worry if your trades goes in the wrong direction, ONREX IV will take over and try to manage and control your risk management. ONREX IV offers a trading interface panel that allows traders to trade manually or opt FULL AUTO TRADING. It's also set to hide the Take Profit and Stop Loss. ONREX IV has its own Magic Number, please use trade button on the p
FREE

Classical Keltner Channel Indicator, Extended version. Works on any instruments. It shows Keltner Bands under these parameters: * periodMa - Period of Moving Average * periodAtr - Period of ATR (Average True Range) * atrMultiplier - ATR Multiplier, multiplies range, calculated by PeriodATR parameter * modeMA - modes of moving average (MA) calculations (Simple, Exponential, Smoothed, Linear Weighted) * modePrice - modes of Price calculations for MA (Close, Open, High, Low, Median, Weighted) T
FREE
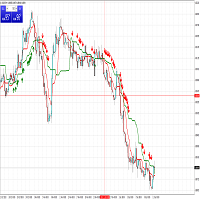
Two Advanced Moving Averages Are you looking for a indicator simple and effective? It will help you! Indicator use two MA to identify trends. User manual: If fast MA(red line) cross over slow MA (green line) and appear first signal buy arrow => you can long. If fast MA(red live) cross below slow MA (green line) and appear first signal sell arrow => you can short.
FREE

The purpose of this new version of the MT4 standard indicator provided in your platform is to display in a sub-window multiple timeframes of the same indicator. See the example shown in the picture below. But the display isn’t like a simple MTF indicator. This is the real display of the indicator on its timeframe. Here's the options available in the FFx indicator: Select the timeframes to be displayed (M1 to Monthly) Define the width (number of bars) for each timeframe box Alert pop up/sound/ema
FREE

The indicator draws lines the the price highs and lows. Break through the high or low usually indicates trend change (or continuation). Once the price moves through a line, and the candlestick closes, the indicator draws an appropriate arrow (also, you can enable alerts). A deal should be conducted in the breakthrough direction immediately or after a slight rollback. It is best to trade following the trend on a larger timeframe. This indicator is easy to use, but nevertheless, there are many tra
FREE

Orders Manager is a simple and indispensable assistant for managing all your orders. Inputs: Magic = 999; // Magic TakeProfit = 1000; // Take Profit. If = 0 the level is not setts. StopLoss = 0; // Stop Loss. If = 0 the level is not setts. Slippage = 10; // Slippage GeneralProfit = false; // Closing all orders based on total profit. If false the function is disabled and works according to TakePr
FREE

There is a very simple and surprisingly effective indicator called Pi Cycle, which starts to give the first warning. It is worth a look, so as not to miss the giant elephant in the living room!))
What is Pi Cycle?
Pi Cycle is a very simple indicator created by analyst Philip Swift . It takes into account two (DMA biased moving averages ): 350-day average x 2 111-day average Both can be considered long-term indicators. The second one is obviously more sensitive to current market changes, since
FREE
Simple indicator that shows your history in pips and profit. You can use it to follow your progress on the positions. It shows you the trade progress only for the symbol that the indicator is on and only for your trade history. Label text is updated when order is closed. The text can be displayed on each corner, it is in the parameters.
Basic input parameters: Label color Font size Conrner position Anchor position Note: corner and anchor have to be the same position.
FREE

RSI Scanner, Multiple Symbols and Timeframes, Graphical User Interface An indicator that scans multiple symbols added from the market watch and timeframes and displays result in a graphical panel. Features: Multi symbol Multi timeframe Alerts and Notifications Live Monitoring Sorting modes One click to change symbol and timeframe Inputs for RSI and scanner settings
FREE

MP Gradient Adaptive RSI oscillator uses AMA with the basic RSI to cover the retracements with minimum lag. Trigger line crossing the oscillator will provide an entry point for trader.
Settings: RSI period: period of the oscillator Sensitivity of the oscillator: controls the sensitivity of the oscillator to retracements, with higher values minimizing the sensitivity to retracements. RSI applied price: source input of the indicator Number of bars to draw: is used when the Fill Type option is no
FREE

Future WPR - or backward WPR - is a special modification of WPR: it uses standard formula, but applies it in reverse direction. The indicator calculates WPR from right to left, that is from the future to the past. It 'knows' and uses the future price movements at any bar where the right-side history provides sufficient number of "forthcoming" bars, that is period bars or more. Conventional WPR is also shown for reference. Both WPR and backward WPR are normalized to the range [0..1] as a more con
FREE

Risk Optimizer is the absolute solution for applying risk management on your account. Bad risk management is the main reason that causes traders to lose money. Risk Optimizer calculates and suggests the correct lot size for each position according to your personal, customized risk profile. You can give directly your preferred risk as percentage (%) for each position or you can trust our algorithms to calculate and optimize according to your risk category selection. But it is not only that! Selec
FREE

NostradamusMT4 - мощный индикатор из набора профессионального трейдера. В основе индикатора лежит авторский метод Андрея Спиридонова расчета цены (ESTIMATED PRICE) для текущей цены свечи. Данный индикатор является самостоятельной торговой системой. Индикатор подходит для работы на классическом рынке и рынке бинарных опционов.
Преимущества
Индикатор не перерисовывается; Работает на любых временных интервалах; Работает с любыми торговыми инструментами; Отлично подходит для скальпинга и торговли би
FREE

Investment Castle Volatility Index has the following features: 1. This indicator shows the volumes of the current symbol and the market volatility. 2. This indicator is built-in in the Investment Castle EA which works as volatility index for the EA dynamic distance and opposite start. 3. Parameters available for optimization for each pairs. 4. Works with any chart.
FREE

Features This EA uses MACD technical. This EA specializes in GBPJPY, so please run the backtest using the corresponding currency. Please apply this EA to the 15 minute chart. This EA divides the position into 3 positions for entry and exit, so it realizes high profit factor and low drawdown. The maximum profit is set at 0 pips(Unlimited). The maximum loss cut is set at 60pips. This EA is highly reliable because it is optimized using TICKDATA.
Parameters -----Basic parameter----- magicResistance
FREE

Channels indicator does not repaint as its based on projecting the falling and raising channels. As a trader you need a path to be able to place your buy and sell trades such as: Supply and Demand , Falling & raising channels. Falling and raising channels can be in any time frame and also can be in all time frames at the same time and the price always flows within these channels. Experienced trades will draw the key levels and channels around the timeframes. But, they will not be able to draw
FREE
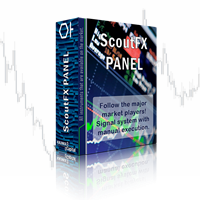
ScoutFX Panel is created to make manual trading and decision making process easier for the traders who prefer manual trading. This trading panel will help you to make a market entry decision by displaying the majority of trades statistics. Using this data, trader can easily determine the market entry direction or to make corrections for used trading strategy based on statistics.
ScoutFX Panel notifies the trader about reached percent of sell or buy overtake for each instrument, via voice noti
FREE

TUMA MT4 Light Indicator A simple and convenient indicator for tracking the crossing of two moving averages (EMA).
A lightweight interface right on the chart allows you to quickly change the periods of both MAs without opening the settings window. Main Features: Display of two EMAs on the chart. Easy parameter editing directly on the chart. Signal arrows when MAs cross: BUY (green arrow up) SELL (red arrow down) Information block with the latest signal and parameters. ️ Input Paramet
FREE

Close All SELL Orders for MT4 script - closes absolutely all orders, whether pending or market ones.
Orders are closed at the current profit/loss indicators at the time of closing.
The script is suitable for moments when you need to quickly close all orders at the current indicators.
The script is very easy to use, just drag the script onto the chart and it will do its job.
Add me as a friend, I have many other useful products.
FREE

Simple. Informative. Instantly Visible on Your Chart. Alwinson Active Trades Info (MT4 Version) is a lightweight custom indicator that displays a real-time summary of your currently open trades —right on your chart. No more switching tabs just to see what pairs are active and how much lot size is in play.
Alwinson Active Trades Info is also available for the MetaTrader 5 (MT5) version (please check on my other products).
Key Features: Displays a list of all symbols with open positions
FREE

The Night Lottery EA is a fully automated Expert Advisor that trades at night and relies on price reversion. The EA trades using market orders and uses time averaging to improve performance. This EA works best on EURUSD, AUDNZD and USDCHF using the M5 timeframe, defaults are for EURUSD. A VPS is advisable when trading this system. Check the comments for back test results and optimized settings. Any questions message me - https://www.mql5.com/en/users/robots4forex View More Products - https://www
FREE

Non-proprietary study of Joe Dinapoli used for overbought/oversold evaluation. Uses of Detrended Oscillator indicator Profit taking. Filter for market entry technics. Stop placement. Part of volatility breakout pattern. Determining major trend changes. Part of Dinapoli Stretch pattern. Inputs lnpPeriod: Perid of moving average Method: Calculation method ********************************************************************************* If you want to know market Overb
FREE

Profit30 Lite Free
The Profit30 Lite Free Expert Adviser, uses 7 different 'price action style' system on the EURUSD pair, on the M5, M15, M30, H1 timeframes.Best optimized perform in H1 chart
The EURUSD pair offers in general the best performance in the major part of the Profit30 EAs. In this EA, a selection of Profit30 systems has been rewritten and configured explicitly for get the best performance in the EURUSD pair. The EURUSD pair offers in general the best broker execution conditions, wi
FREE
What is a tool ? This indicator use for forecast direction of the 28 pairs, Calculates from multiple pairs and timeframes and present by percentage as 70-79% , 80-89% , 90-100% is a little, medium and strong trend. How to use Place the indicator on any pair and any timeframe. Pair : Any Timeframe : Any Input Parameter No Visit my products Target Profit Magic Target Profit All The Profit Tracker Currency Scoring Pair Direction
FREE

The Unreal Engine Official MQL5 Channel
https://www.mql5.com/en/channels/theunrealengine contribution of profitable patterns by you are welcome ,You will find the discussion group in the channel. Please Read The Robot description carefully. It's not the usual yada yada!
What is The Unreal Engine? The Unreal Engine is a revolutionary EA designed to trade static patterns. The difference between other neural networks robots and the Unreal Engine is that the user can set his own p
FREE

The EA places orders at the specified terminal time with an accuracy of 1 minute.
Types of orders are selected, the default is pending.
Set stop loss, take profit, the time after which pending orders are deleted, if until that moment they were not opened(time can not be less than 11 minutes from the time of opening, the EA will not work). Check for magic number is at the beginning. If there are orders with the same magic and on the same instrument (the same symbols), the orders will not be op
FREE
Saint Volume Trader EA consist of two sets of strategy. When "read volume" parameter is on, the EA trades with special build-in software to extract volume data from the data provider. Data provider updates real time data for every two minutes. When "read volume" is set to false, the EA trades with the standard MetaTrader 4 volume indicator. Both strategies have the same concept to read aggregated volume figures from the standard MetaTrader 4 volume indicator or data provider on a certain timefra
FREE
Telegram BrealOut Ichimoku Lite The Expert Advisor will help you forward all alert from MetaTrader 4 to Telegram channel
Parameters Channel Name - Name of your channel Token - create bot on Telegram and get token. AlertonTelegram - true to activate AlertonMobile - true to activate AlertonEmail - true to activate Customize moku Setting (Pro Version) Customize Comment (Pro Version) Add Customizable Signal Name(Pro Version)
Important Note
- You must allow WebRequest and add the https://a
FREE

This EA does not place pending orders, but forms a virtual grid according to the settings. The EA showed maximum efficiency on a pair of EURJPY. The work of the adviser can be seen on the information panel. For stable work on a cent account you need at least $ 600. With such a deposit, the EA withstands recoilless movement of the price of 4000 pips and does not lose the starting depositю
FREE

Aggressive trading robot, be careful over the long term but for a fun account to try to make gains quickly without fear of losing your investment, it can make a profit in a good period. This expert always takes at least two positions in buying and selling. It uses the so-called hedging system to compensate for losses on one side or the other. It can be used with or without indicators for the opening of a trade, it is however more judicious to enter the purchase or the sale with good signals. Tw
FREE

SmartStochasticMt4 is a universal indicator for making trading decisions. An indispensable tool for novice traders, as it has no settings and is ready to work after installation.
Advantages of the indicator:
1. Works with any trading symbol
2. Works on any time period
3. Has no configurable parameters
4. Provides a complete picture of the trading situation from different time periods
5. Not late
Working with the indicator
1. To set the indicator
2. To exclude from the time of the release of im
FREE

Всем привет. И снова, я, Вадим Сергеевич Лепехо, трейдер(частный) опыт 20 лет около. Forex в основном. Предлагаю Вам оценить, протестировать, опробовать индикатор. И дать свою оценку, заключение, РЕЗЮМЕ....)))). Итак, как он работает. Очень прост в понимании. Алгоритм такой. Индикатор на графике(chart) рисует кружки снизу сверху, разных цветов. Ждем когда появится на фоне одних красных кружков 1, 2, ну на крайняк 3 кружка зеленого цвета и + обязательно должен появится следом опять кружок красног
FREE

Velvet RVI is intended for use with the Velvet advanced ordering layer. It is based on the algorithm for the Relative Vigor Index, provided by Investopedia here . All of the data it displays is accurate and verified against the internal API function iRVI, when it is detected by the ordering layer. In order to place orders with the Velvet RVI indicator, the ordering layer must be installed and running. Ordering from the Velvet RVI indicator requires that "Velvet Ordering Layer" ( found here ),
FREE
MetaTraderマーケットはMetaTraderプラットフォームのためのアプリを購入するための便利で安全な場所を提供します。エキスパートアドバイザーとインディケータをストラテジーテスターの中でテストするためにターミナルから無料のデモバージョンをダウンロードしてください。
パフォーマンスをモニターするためにいろいろなモードでアプリをテストし、MQL5.community支払いシステムを使ってお望みのプロダクトの支払いをしてください。
取引の機会を逃しています。
- 無料取引アプリ
- 8千を超えるシグナルをコピー
- 金融ニュースで金融マーケットを探索
新規登録
ログイン