YouTubeにあるマーケットチュートリアルビデオをご覧ください
ロボットや指標を購入する
仮想ホスティングで
EAを実行
EAを実行
ロボットや指標を購入前にテストする
マーケットで収入を得る
販売のためにプロダクトをプレゼンテーションする方法
MetaTrader 4のためのエキスパートアドバイザーとインディケータ - 65

Master the Forex Market with Powerful Currency Analysis! LIVE MONITORING OF SIGNAL USING CCY POWER
Take your forex trading to the next level with a comprehensive and fully customizable tool designed to analyze currency trends, identify strong and weak currencies , and enhance your decision-making process. Key Features: Multi-Timeframe Analysis
Analyze currency strength from short-term (1-minute) scalping to long-term (1-month) trends—adaptable to any trading style. Customizable Ca
FREE
SmartDataExportEaMT4 – データエクスポートEA
EA説明 SmartDataExportEaMT4は、MetaTrader 4専用のデータエクスポートツールです。このEAは売買を行わず、マーケットデータと主要インジケーター値をCSV形式でエクスポートすることに特化しています。データ分析や戦略開発を効率化したいトレーダーや開発者に最適なツールです。
リアルタイム分析との両立 リアルタイムでCSVに出力すると、CSVファイル自体がロックされてしまい、EAを稼働させながら同時に分析するのが難しくなります。そこで本ツールでは、 あえて 「過去のデータをリアルタイムに近い形で取得する」 仕組みを採用しており、CSVファイルにロックがかかりません。その結果、疑似リアルタイムでの分析が可能になっています。
主な特徴 項目 詳細 機能 過去データや主要インジケーター値をCSVにエクスポート可能。 対応通貨ペア MetaTrader 4で使用可能なすべての通貨ペアやシンボルに対応。 対応時間足 任意の時間足を選択可能(M1、H1など)。 エクスポート内容 OHLC価格、R
FREE

MAs COMBO - シンプルながらもパワフルなMT4用移動平均線インジケーター!
このカスタムインジケーターは、単純移動平均線を巧みに組み合わせて構築されており、最小限の労力で高確率の取引セットアップを特定するのに最適です。
取引初心者でも、このインジケーターの分かりやすいロジックのおかげで、明確で収益性の高い取引シグナルをすぐに見つけることができます。パターン認識は非常に直感的なので、初心者からベテラントレーダーまで、すぐに利益を得ることができます。
このインジケーターが気に入る理由: 1. 入力設定があらかじめ設定されているため、複雑な設定は不要ですぐに使い始めることができます。 2. カスタマイズ可能なカラーで、自分のスタイルに合わせてチャートをパーソナライズできます。 3. 組み込みのパラメーターが移動平均線設定の面倒な作業をすべて処理するため、時間と推測の手間が省けます。
あらゆる取引スタイルに最適: 1. 長期取引ですか?より長い時間枠で使用して、より強いトレンド確認とより大きな利益を得ましょう。 2. 短期スキャルピングですか?より短い時間枠(H1未満)に適
FREE

If you can not create a background image for yourself (photo size and format must be changed), let me know. I make your photo for free. Otherwise, you can read the help file . A tool for chart management You can change the background image You can change the background color Change the color of the candles Volume colors, line charts and everything else You can also enable and disable some items Read the help file for more information
Settings:
Save Changes After Remove Tool
Back Ground Photo
FREE

4 buttons for managing your trades.
Close All : will close all open positions on the current chart Delete All : will delete any pending orders on the current chart SL + 1 : will move the stop loss 1 pip closer to the breakeven point on all open trades on the current chart Delete SL : will remove the stop loss for all open positions on the current chart
Useful for everyone who opens multiple positions on the same asset, where fast execution is essential.
FREE

The utility opens an order in the opposite direction from already open positions on the currency pair on which it is launched, creating a lock of orders. The utility has a simple interface and is easy to use. MT5 version of the utility - https://www.mql5.com/en/market/product/78126 If you like this utility, take a look at my other products - https://www.mql5.com/en/users/nina_yermolenko/seller
FREE

Utility for know all informations and settings of all symbols available on your broker The informations that you can know are for example:
- Spread
- Digits
- Tick value
- Size step
- Size minimum
- Size maximum
- Swap buy and sell
- Margin required (for 1 standard lot)
- Rollover day
- Execution mode
and many other informations You can filter the symbols by group or you can also choose to see the informations only of symbols available on market watch.
FREE
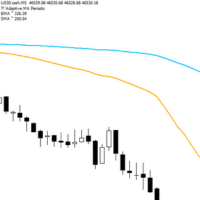
Adaptive Flow MAs is a moving average indicator designed to naturally adjust to market movements. Unlike traditional averages, it dynamically adapts its periods based on recent volatility and the current trend. The EMA closely follows rapid price swings to capture every impulse, while the SMA remains smoother, providing a stable and reliable reference. With a clean display showing the current adaptive periods, this tool helps traders feel the “flow” of the market without visual clutter. It’s cr
FREE

The selective pin bar is designed to identify reversals. To use the selective pin bar effectively, traders typically look for Strong Rejection: The tail of the pin bar should extend significantly beyond the surrounding price action. It indicates that there was a sharp rejection of higher or lower prices during the trading period. A strong rejection suggests that the market sentiment may be changing.
FREE

This indicator applies the biquad high pass filter to the price-chart data, and displays the filter output for the OHLC as candlesticks. The candlesticks corresponds to the actual calculations of the filter value during the formation of each price bar (not from all historical highs lows or closes). The shape of the bars therefore corresponds directly to the shape of each price bar. High pass filters are an underappreciated type of oscillator that are seldom used in technical analysis in the st
FREE

This script TEST and show the REAL commissions applied. It will open minimal (0.01) size orders, so your account WILL BE charged. Wait the orders to reach the TakeProfit, then in the Account History, check the Commission, Profit and Comment of each position. MUST run on REAL account. Example:
+ Take Profit 70
- Spread 25
- Commission 18
= Profit 0
I made this script because tired of brokers lying on spread and commissions.
FREE
Check out other great products from https://www.mql5.com/en/users/augustinekamatu/seller
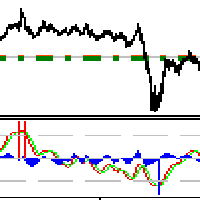
This indicator is the best so far at estimating reversal points especially on high time frames. It does not repaint and is based on a combination of moving averages computed using custom functions. No inputs required, it is simple plug and play. The principles used ensure that it can be used on CFDs, Commodities and Stock with incredibly great results. With proper money management and portfolio balancing
FREE
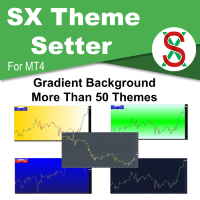
SX Theme Setter is intended for changing chart appearance in 2 modes: - Gradient background mode:
In this mode, the indicator creates a gradient background for your chart. Colors, steps and gradient type can be selected by user. - Color theme:
Color theme mode provides more than 50 built-in different color themes which can be selected from a list. Most of these themes are converted from official color themes of real trading platforms of the past and present. Try them out and see if they suit
FREE
RSI PHONE ALERT RSI Alert is an amazing tool to get alerted on your mobile phone when Overbought/Oversell levels reached on RSI indicator. So that traders who doing manual trading can execute their trades from mobile phone while following their RSI strategy, as most of the traders use RSI for entering their trades. New suggessions are welcome INPUTS RSI levels RSI period Start/End time of the tool Custom text message to get on mobile phone Enable/Disable mobile alert function available Do not fo
FREE

About Waddah Multimeter (free):
This product is based on the WAExplosion Indicator. It helps identify explosive market trends and potential trading opportunities. Check out the detailed product post here for scanner and multimeter both: https://www.mql5.com/en/blogs/post/758020
Please note that scanner is paid and multimeter is free.
Features: Waddah Trend Direction Trend Strength (above/below explosion line or deadzone) Trend Explosion Alert Alignment alerts Multi-timeframe Custom currency Mu
FREE
This indicator allows to hide OBV (on all MT4 timeframes) from a date define by the user with a vertical line (Alone) or a panel (with "Hidden Candles"). Indicator Inputs: Apply To Information on "On Balance Volume" indicator is available here: https://www.metatrader4.com/en/trading-platform/help/analytics/tech_indicators/on_balance_volume ************************************************************* Hey traders!! Give me your feeds! We are a community here and we have the same objective....
FREE

Features This EA is a fully automated EA for Forex trading. This EA will be entered when the volatility of the market increased. The target currency is GBPJPY. This EA takes up to two positions. The input parameters are optimized for H4,H1,M30. The maximum profit is set at 300pips. The maximum loss cut is set at 100pips.
Parameters FUNDA - If you only want to buy, please set 1. If you only want to sell, please set -1. if you wish both, please set both 0 . magic - Please set a magic number whic
FREE

The Commitments of Traders Ratio Indicator is one of these things you never thought about it before you really see the magic behind it. The indicator shows the Ratio of long/short positions released by the CFTC once a week.
If you have a look on the Sreenshot you can see two (three) zones of interest. Zone 1: The Switches (Red -> Green, Green -> Red) Zone 2: MA cross Zone 3: If you combine this with the COX indicator an additional zone will appear. You also can experiment with Ratio crossing MA
FREE

The VR Object Delete All script solves the problem of garbage on the chart. it is often necessary to completely clear the chart of everything that is put on it, comments, lines, objects. The script completely deletes everything, even those objects that are not visible. When working, VR Object Delete All writes everything it does in the terminal log, as well as the names of objects to delete. Displays the number of deleted objects as a separate line. in case of any errors, it will display an erro
FREE

The GU_H1_120114111_S_Pi_CF_0712_SQ3 is an algorithmic trading strategy for MetaTrader, tested on GBPUSD using the H1 timeframe from April 1, 2004, to April 24, 2024. There is no need to set up parameters, all settings are already optimized and fine-tuned.
Recommended broker RoboForex because of EET timezone.
You can find the strategy source code for StrategyQuant at the link: https://quantmonitor.net/gbpusd-pivots-trend-master/
Key details are:
Parameters
Main Chart: Current symbol and
FREE

Triple Brain EA is Your Smart, Safe, Profitable, Martingale, Hedging MT4 Auto Trading Forex Expert Advisor The Triple Brains Expert Advisor (EA), brought to you by GoStart.Biz, is an avant-garde trading tool meticulously crafted to augment your trading arsenal. Featuring a potent mix of sophisticated strategies including martingale recovery, hedging, and multi-dimensional trade management, this EA is tailored to empower the MetaTrader 4 platform users. System Compatibility and Requirements: Des
FREE

Kusama is an automated trading system that uses and candlestick patterns in combination with Standard Deviation calculations to open and close trades. This Expert Advisor is designed specifically for the USDJPY H1 Foreign Exchange(FX) market to open, monitor, modify and adjust orders automatically.
Entry signals utilize Shooting Star Candlestick patterns and Hammer Candlestick patterns . Long Exit Signals work on the Bearish Engulfing Candlestick patterns in combination with Standard Deviati
FREE
Perfected MA (Moving Average) HTF (Higher Time Frame) is perhaps the most advanced and reliable HTF indicator. Highly optimized in terms of execution, the indicator comes with standard settings of the MA indicator which is supplied with the MT4 platform. Place the indicator on the chart, any timeframe. You may select a higher time frame in indicator inputs. The same indicator can be used on a chart multiple times to draw MA from multiple timeframes or for different MA values. A must-have tool t
FREE

MT4 VERSION:
Este robô foi desenvolvido especificamente para EURUSD , um dos pares mais líquidos do mercado, e opera em timeframes maiores (H4, D1) . Sua estratégia é baseada na tendência do mercado , utilizando indicadores como Médias Móveis, ATR e Momentum para determinar os momentos certos de entrada e saída. O Robot Factory EURUSD H4 evita operações desnecessárias e ruído do mercado , focando apenas em trades de alta probabilidade . Ele combina análise técnica com volatilidade controlada ,
FREE
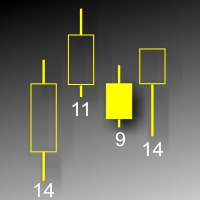
This indicator displays each bar's volume (visible range) in points. The display parameters are customizable. The indicator was developed for personal use (chart analysis). Parameters: ColorL - color of text labels. Position - label position: 0 - below, 1 - above. FontSize - font size. ANGLE - text slope angle.
FREE

This is a free version of the Dmytriyx Impulse Expert Advisor. The Expert Advisor analyzes the current price dynamics when it deviates from the average value. Uses pending orders in the impulse direction, at a fixed distance, then moves the pending order in the direction of correction. You can configure the number of pending orders to be placed in the signal direction - the distance between the pending orders is LevelDist , the lot value of each new order is equal to a half of the previous one (
FREE
如果产品有任何问题或者您需要在此产品上添加功能,请联系我 Contact/message me if you encounter any issue using the product or need extra feature to add on the base version.
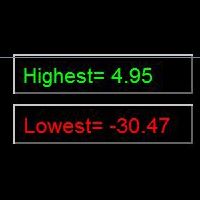
Indicator Floating Highest Lowest provides you an intuitive, and user-friendly method to monitor the floating highest (profit) and lowest (loss) that all your trades together ever arrive. For example, I opened 3 orders, which arrived at $4.71 floating profit when trade following trend. Later when the trend is against me, these 3 orders arrive $30 in loss
FREE

Trading robot “OsloAlligator” (Version #3)
Description:
Trading robot “OsloAlligator” is an automated assistant for trading using Alligator, Fractals and ATR indicators to execute trades on the MetaTrader 4 platform. This version implements dynamic lot size calculation.
Functionality:
Strategy based on SMMA and ATR:
The robot uses SMMA and ATR to determine entry and exit points.
Alligator periods can be adjusted depending on market conditions.
ATR is used to determine volatility and sele
FREE

Индикатор "INFO Spread Swaзp Info Panel" для MT4, вспомогательный инструмент для торговли.
- Индикатор показывает текущий спред и свопы валютной пары, к которой он прикреплен. Также идикатор показывает: 1. Дату и время сервера 2. Название сервера 3. Название влютной пары. 4. Спред 5. Своп 6. Открытые позиции 7. Отложенные ордера 8. Максимальная просадка после открытия индикатора 9. 30% от депозита. (можно менять) Можно менять положение, размер, цвет шрифта, расстояние между строками.
FREE

I decided to list it for free. Combined Informer of DeMarker with RSI MTF. Each parameter can be change values in menu. it is good for scalping or for weekly trading and looks as universal fx-toy. Now I use it for BTC, ETH, BNB. In menu you can turn on daily percentage gain info, weekly and monthly gains also included as informers. Short ATR helps to determine when price was slow/stopped and entry for pulse pump/dump. The filter of numbers of RSI can be tuned for overbought/oversold values w
FREE

Indicator overview Trend indicator usage Moving averages. Highest quality alerts that need no introduction. It is completely loyal to the original algorithm and uses other useful features.
Easy to trade Carry out all kinds of notifications It's not a new paint and it's not a back paint. Setting Indicator SSMA50 in Time frame H1 for any pair currency and Gold Spot. EMA200 in Time frame H1 for any pair currency and more than EMA250 for Gold spot. Using it for maximum benefit Set up notificatio
FREE
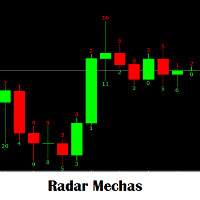
手動入力を行うためのアラートを生成するサイズに応じて、ろうそくから出る芯のサイズを確認するのに役立つインジケーター。 戦略が前のろうそくの芯のサイズまたは同じ現在のろうそくの芯のサイズをもたらすことを最大限に活用してください. 売買に入る。 これは、新しいエントリに対して行われる分析に必要な指標です。 お気に入りのツールになります。 Shudō nyūryoku o okonau tame no arāto o seisei suru saizu ni ōjite, rōsoku kara deru shin no saizu o kakunin suru no ni yakudatsu injikētā. Senryaku ga mae no rōsoku no shin no saizu matawa onaji genzai no rōsoku no shin no saizu o motarasu koto o saidaigen ni katsuyō shite kudasai. Baibai ni hairu. Kore wa, atarashī entori ni ta
FREE

White Crow Indicator
by VArmadA A simple yet powerful candle analysis based indicator using the White Soldiers & Crow patterns.
Works with timeframes 1H and higher and tested on all major pairs. Pay attention to the signal: An arrow indicating a long or short entry.
How It Works:
Arrows indicate a ongoing trend. After multiple bullish or bearish candles in a row the chances for another candle towards that trend is higher.
Instructions: - Crow Count: Set the number of candles that need to s
FREE

Diversify the risk in your trading account by combining our Expert Advisors. Build your own custom trading system here: Simple Forex Trading Strategies
The expert advisor opens trades when the SMA and RSI are aligned in the same direction and when the Stochastic has left overbought/oversold areas. The 5 and 10 SMA are also programmed to close the trades if the trend changes. The Stop Loss, Take Profit, and Trailing Stop are calculated based on the ATR indicator. The recommended currency pair
FREE
Vertical Lines for Hour - Time-Based Trading Indicator The Vertical Lines for Hour indicator allows you to mark up to 4 vertical lines at specific times on your chart. Simply enter the hour without considering the minutes, and you can also choose the color for each line. This indicator is useful for identifying session ranges or implementing custom trading strategies. It provides a straightforward solution for your trading needs. Key Features: Mark up to 4 vertical lines at specified times. Sele
FREE
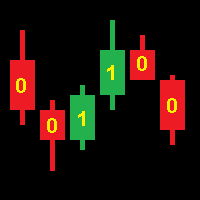
Operation of the CodEx 4 Expert Advisor is based on patterns composed of consecutive candles. Positions are closed when opposite signals appear. Sequences of candles are encoded into an integer according to the following rule. The code number must be converted to binary form and the highest bit must be discarded. The resulting sequence of bits encodes a continuous sequence of candles, where 1 is a bullish candle, 0 is a bearish candle. The higher bits encode the earlier candles. For example: 19[
FREE
The Ergodic is an oscillator based on William Blau's True Strength Index, which is based on Momentum to which double smoothing has been applied. 100* EMA(EMA(Momentum) / EMA(EMA( |Momentum|)) The Ergodic adds a moving average to the TSI which will act as a Signal Line. This oscillator can be used to identify trend reversal zones, or trend continuation phases.
VERY USEFUL WHEN USED IN CONJUNCTION WITH THE CURRENCY INDEX.
L' Ergodic è un oscillatore basato sul True Strenght Index di William Bla
FREE

MP Relative Bandwidth Filter (RBF) is created to be used to identify your trading zones based on volatility. This easy to use technical indicator attempts to compare between Bandwidth of higher length and ATR of lower length to identify the areas of low and high volatility: Relative Bandwidth = Bandwidth / ATR The Bandwidth is based on Bollinger Band which its length ideally needs to be higher and ATR length needs to be ideally lower. After calculating Relative Bandwidth, the Bollinger Band is
FREE

Supreme Direction is an indicator based on market volatility , the indicator draws a a two lined channel with 2 colors above and below price , this indicator does not repaint or back-paint and signal is not delayed. how to use : long above purple line , short below golden line. Parameters : channel period ========================================================
FREE

Индикатор сглаженного Stochastic Oscillator (xStoh)
Входные параметры: xK Period - K период xD Period - D период xSlowing - замедление xMethod - метод усреднения (0-SMA | 1-EMA | 2-SMMA | 3 - LWMA) xPrice field - тип цены (0 - Low/High | 1 - Close/Close) Принцип работы
Индикатор перерассчитывает стандартный технический индикатор Stochastic Oscillator (дважды усредняет получаемые значения iStochastic).
FREE
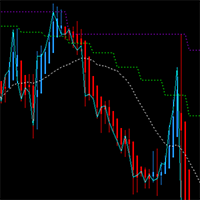
This MT4 chart trend checker cuts through the noise of market volatility to provide a clearer picture of trends and price movements. It includes the following features that can provide more clarity during market assessments: 1 customizable multi-period moving average Optional Heikin-Ashi candles 3 switchable focus modes Distinct colors for easy analysis
Link to MT5 version: https://www.mql5.com/en/market/product/106707/
This indicator shows your preferred moving average from multiple time fram
FREE

This indicator helps you to find overbought and oversold prices based on William %R. Input Description: Wperiod: Period for %R indicator. OverBoughtLevel: Define the overbought level for %R. Must in between 0 and -50. OverSoldLevel: Define the oversold level for %R. Must in between -50 and -100. middle_value: When true, indicator also draw the middle points between upper and lower line. shift: Set an additional offset to the indicator.
Several Notes: Set 0 and -100 as Overbought and Oversold lev
FREE

R Wavy Dash インディケータは、価格データを、トレードのエントリーとエグジットで機能する優れたトレンド フォロー シグナル インディケータに変換します。 メイン チャートに色付きのシグナル ラインとして表示され、スタンドアロンの取引ツールとして使用できます。
R Wavy Dash インジケーターは非常に信頼性が高く、軽量であり、取引プラットフォームの速度を低下させることはありません。
キーポイント トレンドシグナルインジケーター 初心者に優しい ノンリペイント 指標コレクションに追加する価値があります この指標は、可能なトレンド反転確認ツールとして、既存の取引戦略またはシステムと連携できます。
基本的な取引シグナル R Wavy Dash インジケーターからのシグナルは解釈が簡単で、次のようになります。
買う
緑色のシグナル線がチャート上でペイントを開始すると、新しい買いシグナルが与えられます。 サポートの下にストップロスを置きます。 所定の利益目標のために買い取引を終了するか、売りシグナルを待ちます。 売る
赤色のシグナル線がチャート上でペイントを開始すると
FREE

Trend Rising is a custom MT4 ( Metatrader 4 ) indicator, use best for scalping on TF M30 and below that analyzes the trend and momentum pattern using Bill William Indicators on multiple timeframes. As the result, It identifies the beginning and the end of the trend that works for most currency pairs. The Trend Rising indicator is developed based on Accelerator Oscillator and Awesome Indicator. Key Features Identify the beginning and the end of the trend as display with colors. Identify eas
FREE

Channel Builder(CB) または Ivanov Bands 指標は、 Bollinger Bands 指標を広く一般化したものです。これらの一般化は以下の通りです。まず、CBにおいて、平均線<X>が様々な平均化アルゴリズムを用いて計算される。次に、CBでは、平均偏差の計算に異なるコルモゴロフ平均化が使用されます。 標準のSMA、EMA、SMMA、およびLWMAの平均化アルゴリズムに加えて、中央の線<X>は、中央値=(最大+最小)/ 2スライディング中央値(既定値)になります。さらに、著者が開発した特別な<XF>(高速)および<XS>(低速)のスライディング平均アルゴリズムを使用して<X>を計算します。これらのアルゴリズムは、変動の激しい通貨市場に存在する貿易集約的な大きなノイズをフィルタリングします。つまり、フィルタリングアルゴリズム<XF>を使用すると、トレンドの始まりをすばやく判断できます。また、フィルタリングアルゴリズム<XS>を使用すると、フラット状態への出力をより適切に決定できます。最後に、CBでは、取引
FREE
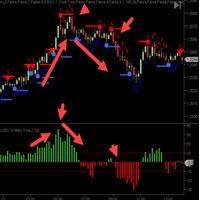
CycleTraderProクローズ強度値インジケーターは 、新しいバーのOPENからそのバーのCLOSEまでの距離を測定します。 入力 - 長さ= 10デフォルト これらの値を合計して長さ設定に戻します。 最初の小節がプラス10ティックで、その次の小節がマイナス7ティックだった場合、これは+3を登録します。 Close Strength Valueを交換するには2つの方法があります。 買い、より高い最高値、より高い最低値を得るために、最低高値と最低安値の方向、およびその逆の取引。 2.指標が色の方向で中央のゼロ点を横切ったときに取引します。赤=売り/緑=買い。 Close Strengthは過去の動きを表示するヒストグラムチャートも表示し、市場が停止または後退するまでにどれだけの距離に到達できるかを確認します。
FREE

Automatically sends real-time notifications about trade opening, closing, and partial closing from MT4 to Slack. The utility supports 16 languages : English, French, German, Indian (Hindi), Indonesian, Italian, Kazakh, Korean, Dutch, Polish, Portuguese, Russian, Spanish, Turkish, Ukrainian, and Vietnamese. The product is designed for traders who need to receive Slack notifications without constantly monitoring the terminal. It is suitable for Expert Advisor users who want to monitor their activi
FREE

The GTAS BSI is an indicator designed to provide the trend direction and buy/sell signals, using combination of momentum indicators. This indicator was created by Bernard Prats Desclaux, proprietary trader and ex-hedge fund manager, founder of E-Winvest.
Description The BSI indicator is represented as a histogram under the price chart. +100 (green) value indicates a bullish trend. -100 (red) value indicates a bearish trend. When the BSI turns to +100 (green), it gives a potential buy signal. Wh
FREE
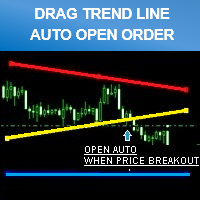
Smart tool system for opening orders by Trend Line automatic.
Just drag a Trend line to define your breakout point then click "Confirm Order" button. The EA will automatically opening order when price breakout Trend line that defined by you. Work on live and back test (Strategy Tester) Can modify trend line on real-time. Note : This demo version is for testing on CADCHF pair only. The full version can be found here: https://www.mql5.com/en/market/product/11202 Features
Drag trend line for open
FREE

DG Equity Monitor is a useful tool that keeps track of the daily transactions made on the account. The EA automatically and instantly closes all the trades running based on two conditions: 1. If the daily profit target is hit. 2. If the maximum drawdown is reached. An alert is sent immediately one of the above conditions are met.
Parameters: Show Account Info -Choose whether or not to display the Account Info on the chart.
Show Pop Up Alert -Show alert on chart when either condition 1 or 2 are
FREE

Using multiple timeframes for analysis with Mtf MACD Standard can provide several significant benefits for traders: Comprehensive Market View: By applying Mtf MACD Standard across different timeframes, traders gain a broader perspective on market dynamics. This allows them to identify trends, patterns, and potential reversal points that might be more apparent or consistent across various scales. Enhanced Pattern Recognition: Multiple timeframes help in identifying repeating patterns or structure
FREE

Introduction This Indicator Is Based On Average Price/Maximum Price Moves, And Using Moving Bollinger Bands And Moving Averages.
The Advantage Of Using It With YOUR own Analysis Will Confirm Potential Supports And Resistances While it Compliments With Your Analysis
The Indicator Is Non-Repainting
AND Along With Our Special Trend METRE that Changes With The Conditions OF A Bullish Or Bearish Trend....
Recommend Time-Frames: H1 H4 M15
Usage: The Indicator Is Very Profitable If Use
FREE

Here are several indicators that work together. It basically works with moving averages and various levels of ATR creating a dynamic channel through which the price is drained. As I always recommend, you should try it before using it in live so that you understand how it works. The market entry signal is similar to other MA indicators, but with this one you also have a graphical analysis of the moment when the trend is found and dynamic levels to adjust your stop loss and take profit depending
FREE

Note: This is a Limited Edition of Lion Grid . It works only on Mondays.
The trading strategy has been been created by using machine learning algorithms to build a model directly from the historical data. Machine learning is an application of artificial intelligence (AI) that provides the ability to automatically learn and improve from experience without being explicitly programmed. The strategic focus of this robot is to identify trend reversals by analyzing multiple technical indicators (
FREE

A simple risk management tool that closes all open orders if equity drops by a specified percentage. This tool is useful if you are running multiple EAs and multiple charts and pairs in order to control your risk. All orders will close accordingly. Once it hits specified percentage drawdown the closing of all orders cannot be stopped. The EA will reset once all orders are closed, until account equity drops again relative to account balance. Use at your own risk. This is only for MT4. There is o
FREE

The purpose of this new version of the MT4 standard indicator provided in your platform is to display in a sub-window multiple timeframes of the same indicator. See the example shown in the picture below. But the display isn’t like a simple MTF indicator. This is the real display of the indicator on its timeframe. Here's the options available in the FFx indicator: Select the timeframes to be displayed (M1 to Monthly) Define the width (number of bars) for each timeframe box Alert pop up/sound/ema
FREE

RaysFX StepMA+Stoch Caratteristiche Principali Adattabilità: Il nostro indicatore RaysFX StepMA+Stoch è progettato per adattarsi alle mutevoli condizioni di mercato. Utilizza l’Average True Range (ATR) per misurare la volatilità del mercato e regolare di conseguenza le sue strategie di trading. Precisione: L’indicatore genera segnali di trading quando la linea minima incrocia la linea media. Questi segnali sono rappresentati come frecce sul grafico, fornendo punti di ingresso e di uscita chiari
FREE
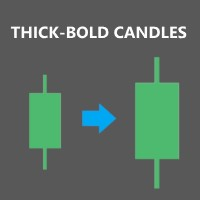
Description: Expand the width of your candles horizontally in MT4 to improve visibility when zooming in or out of the chart. Once attached to the chart, the indicator will automatically double the size of the candles compared to their normal value. Main indicator inputs: Body: size of the candle body Wick: size of the candle wick Additionally, you have the option to change the color of the candle body. We hope you find this free and useful indicator enjoyable!
FREE

This indicator shows the strength of each currency compared to the US dollar by calculating the rate of change in price over a specified time period. When you open the indicator, you'll see a list of different currencies on the price chart. Each currency will have a numerical value indicating its strength level compared to the US dollar, where: If the value is higher than the US dollar, it will be displayed in green, meaning that currency is stronger than the dollar. If the value is lower than
FREE

Indicador "Trade Zones: Supply and Demand Opportunities" para MetaTrader: Eleva tu Trading con Precisión Estratégica El indicador "Trade Zones: Supply and Demand Opportunities" es una herramienta revolucionaria diseñada para potenciar la toma de decisiones de los traders al identificar claramente las zonas de oportunidad basadas en los principios fundamentales de oferta y demanda. Este indicador, compatible con MetaTrader, proporciona una visión intuitiva de las áreas críticas del mercado donde
FREE

The Moving Average Slope (MAS) subtracts the moving average level n-periods ago from the current moving average level. This way, the trend of the moving average can be drawn on the moving average line.
Features Observe uptrends and downtrends at a glance. The indicator is non-repainting. Returns buffer values for the trend of the moving average to be used as part of an EA. (see below)
Inputs Moving Average Period : The period of the moving average (MA). Slope Period : Number of periods between
FREE
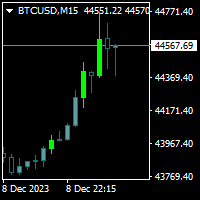
Trendfinder MA Pro are based on Colored candlesticks showing the trend based on two Moving Averages as Signal and two Moving Averages as a Buy and Sell Zone, the slope of the slow Signal moving average and ATR and Volume increasing. This indicator will give you the color change on the next bar on the confirmation candle and will provide alert on Buy and sell signal, when it enters the buy and sell zone and when the market test the buy or sell zones as support or resistance and will never repain
FREE

EXTREME PRICE ACTION DASHBOARD
Make your trades professionally using advanced statistics and price action. Manages 29 pairs simultaneously. It has Buy and Sell buttons, close buy and close sell separately for each pair. Stop Gain and Stop Gain programmable in Pips automatically. Dynamically calculates 5 regions where statistically the most assertive sales and 5 more assertive shopping regions are found. Indicates the total lots, buy balance and sell balance for each pair. Change the graph's t
FREE
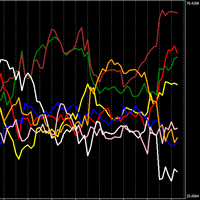
個々の通貨の強さを示す強力なインジケーター。
高ければ通貨は強くなり、逆に低ければ通貨は弱くなります。
トレーディング戦略 N1: ラインクロスでポジションをオープンします。一方が上にクロスし、もう一方が下にクロスした場合、上昇している通貨でポジションをオープンします。
取引戦略 N2: 最も強い通貨を買い、最も弱い通貨を売ることでポジションをオープンします。
設定で時間枠を変更できます。私はデフォルトのもの(TIMEFRAME 1 HOUR)と期間 24 を使用します。また、TIMEFRAME 1 MINUTE と期間 1440 も使用します。
個々の通貨の強さを示す強力なインジケーター。 高ければ通貨は強くなり、逆に低ければ通貨は弱くなります。 トレーディング戦略 N1: ラインクロスでポジションをオープンします。一方が上にクロスし、もう一方が下にクロスした場合、上昇している通貨でポジションをオープンします。 取引戦略 N2: 最も強い通貨を買い、最も弱い通貨を売ることでポジションをオープンします。 設定で時間枠を変更できます。私はデフォルトのもの(TIMEFRAM
FREE

OpenCharts for OpenOrders – スマートなチャート管理ツール このスマートスクリプトを 任意のチャート にドロップするだけで、ターミナル内の すべての保有ポジションの銘柄 に対応するチャートが自動的に開かれます。 ️ 主な機能 : 保有ポジションごとにチャートを1つだけ開く 同一銘柄に複数ポジションがあっても 1つのチャートのみ 開く 実行前にタイムフレームを選択可能 軽量で効率的 – 複数ポジションを管理するトレーダーに最適 作業スペースを整理し、時間を節約 このスクリプトは 完全無料 です – 隠れた費用も制限も一切ありません。 キーワード :チャート管理、自動チャート表示、MQL4スクリプト、保有ポジションチャート、MT4ツール、無料スクリプト、MT4自動化、トレードアシスタント、マルチポジション、チャート自動化
FREE

Dexter EA is a 100% automatic robot that executes random orders of simultaneous buys and sells. For each losing operation, a management with an increase in the lot will begin, better known as “martingale” that will cause the price to fall back to the area where it was established. the profit the robot closes in profit or breakeven, depends on its configuration. I catalog it as a utility even though it works totally automatic because EVERY TRADER'S WORK IS NEEDED to be able to make it work corre
FREE

ExportRange は、指定した時間足のローソク足データから、高値、安値、値幅を取得し、CSV 形式で保存するスクリプトです。値幅統計の作成や、分析用データの基礎収集に利用できます。 スクリプトを実行すると、指定した本数のバーから必要な情報を取得し、ターミナルの Files フォルダに CSV ファイルとして出力します。時間足とバー数はパラメータで自由に設定できます。 主な機能 過去 N 本のローソク足データを自動取得 高値、安値、値幅(Range)をセットで保存 チャートの時間足を使用するモードに対応 CSV 形式で出力され、外部ツールで扱いやすい 出力される項目 CSV ファイルには次のデータが保存されます。 Timeframe Index Datetime High Low Range Range は高値と安値の差で、後処理で pips 換算が可能です。 活用例 時間足ごとの値幅比較、通貨ペアのボラティリティ解析、値幅ベースの戦略作成などに利用できます。バックテストの前に相場の基本特性を把握したい場合にも適しています。 使用方法 マーケットから本スクリプトをダウンロードしてイ
FREE

Property of Vertical Capital Edition: Gugol_Quants About USA INDEXES QUANT_INDICATOR: This is a indicator created by math modulation to be used as a trading tool, which was developed in MQL. (MT4) This indicator is for use only with US500(S&P500), NAS100(Nasdaq Composite) and US30(Dow Jones). Signals are activated on "Open" Candle. It’s based on Intraday/Swing Trades whose main timeframe is H1, H2, H3 and H4. However you can use it with other assets by testing with the appropriate settings. *
FREE

Candle Pattern Alert indicator alerts when the last price closed candle matches the set input parameters. You can choose to scan through all the symbols in Market Watch or enter your favorite symbols and also you can enter time frames you need to scan. --------- Main settings- ------- Select all symbols from Market Watch? - if Yes the program scans through all the symbols displayed in Market Watch, if No - only selected in next input symbols are scanned
Enter symbols separated by commas - enter
FREE
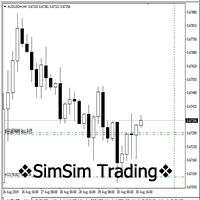
"SimSim Expert Assistant" утилита для сопровождению сделок трейдера в терминале МТ4. Утилита бесплатная, пользуйтесь. Кроме того, утилита открывает сделки по сигналам индикаторов SimSim Trading (через глобальные). Параметр индикатора "Signal shaping for SimSim Expert Assistan" указывает на это.
Как работать с утилитой. Expert Assistant работает в терминале МТ4 и устанавливается в папку Expert, в утилите нет ни одного параметра при старте. Все параметры находятся в списке глобальных переменных
FREE
MetaTraderマーケットは、開発者がトレーディングアプリを販売するシンプルで便利なサイトです。
プロダクトを投稿するのをお手伝いし、マーケットのためにプロダクト記載を準備する方法を説明します。マーケットのすべてのアプリは暗号化によって守られ、購入者のコンピュータでしか動作しません。違法なコピーは不可能です。
取引の機会を逃しています。
- 無料取引アプリ
- 8千を超えるシグナルをコピー
- 金融ニュースで金融マーケットを探索
新規登録
ログイン