YouTubeにあるマーケットチュートリアルビデオをご覧ください
ロボットや指標を購入する
仮想ホスティングで
EAを実行
EAを実行
ロボットや指標を購入前にテストする
マーケットで収入を得る
販売のためにプロダクトをプレゼンテーションする方法
MetaTrader 4のためのエキスパートアドバイザーとインディケータ - 63

The indicator marks the points on the chart where the standard ZigZag indicator has drawn its top or bottom. With this indicator, you can easily understand where the top or bottom was formed, and where it was redrawn. The indicator gives an alert when a new point appears. Warning! Parameter Applied Price - expands the possibilities of building the indicator. It is possible to build at OPEN, CLOSE and standard HIGH/LOW prices. Input parameters ----------- Depth - period of the ZigZag ind
FREE
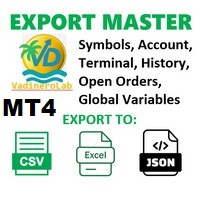
VadineroLab MT4 Export Master to CSV EXEL JSON - Expert Advisor for exporting and analyzing symbols, account, terminal parameters, active trades, current account state, trading history, global variables. Generates the following report types: * Symbols Parameters — spread, tick size, min/max lot, swap, … * Account Parameters — balance, equity, leverage, currency, margin info, … * Terminal Parameters — server, version, language, date, environment, … * Trade History — orders, deals, positions, se
FREE

A utility for automatically detecting the GMT offset of your broker To use the utility, place it in the Scripts folder of the terminal data directory, enable WebRequest in the terminal settings and add the address https://www.worldtimeserver.com/ to the list of allowed ones. Run the Check GMT script on the chart with any currency pair There is only one setting in the script: site = https://www.worldtimeserver.com/ just for your convenience. Copy this address from the script setti
FREE
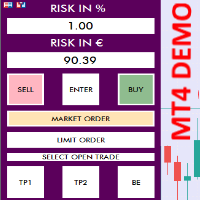
TRADING PANEL - CHART OVERLAY with: PARTIAL TAKE PROFIT ("virtual TP") % RISK LOT SIZE TRAILING STOP LOSS Fast and simple control of your trades this is DEM0 VERISON (for DEM0 acc.) of TRADING OVERLAY with PARTIAL take profit ("virtual TP") and % risk lot size
--- full version available on my 'seller page' as well as version for MT5
Easy lot size calculation with easy SL/TP setting. Your trading will be much more comfortable with this tool !
Works like any EA, add it
FREE

This adviser trades by volume, analyzing candles. It is a free version of Volume candlex master . Differences from the paid ones are that there are not some functions here: working on 2 timeframes, using Moving average, dynamic stop-loss and take-profit, and also the maximum lot is limited (no more than 0.10). Recommended timeframes: M5, M15, M30. Before trading, optimize the parameters of the advisor for your account. Input parameters Lots - lot size; MaxSpread - the maximum spread for the op
FREE

この Expert Advisor (EA) は、オーバーナイトの利息を支払う (獲得する) 通貨ペアで取引が行われるため、高利回りの普通預金口座のようなものです。エントリーポジションとエグジットポジションは、それぞれ買い注文と売り注文のルックバック期間の最低/最高価格と最高/最低価格に基づいています。
共通入力、
SINGLE_CURRENCY = true、単一通貨での操作を許可します。無効 (FALSE) の場合、メタトレーダーのマーケット ウォッチ ウィンドウで選択された通貨を取引します。
CONCURRENT_ORDERS=0、同時に開かれる複数の注文の数を制限します。
PIPS=100、利益PIPS
MAX_PIPS=1000、Ask と Bid 価格の最高値と最低値の間の最大 PIPS 距離。
MAX_LOTS=100、取引口座で許可される最大LOTS。
DODDFRANK_COMPLIANCE=false、米国ベースのアカウントで取引する場合、FIFO 違反の受信を防ぐために FIFO を有効にする必要がありますか?
LOTS=-1、LOTs パラメー
FREE

With Easy News, you can trade breakouts from a range at specific times.
This is particularly lucrative for news and economic announcements because high risk/reward ratios are often present in these situations. This tool is suitable for all currencies and timeframes. It includes profit pyramiding. This means that when the first order is in profit by xx points (adjustable), another order is opened (depending on the set quantity).
How does it work? At a specific time, the tool creates 2 stop orde
FREE

Индикатор показывает максимальное отклонение от скользящей средней за заданный период. Границы канала могут послужить своего рода зонами перекупленности/перепроданности, от которых может произойти откат цены к центру канала. За этими уровнями и стоит искать дополнительные сигналы для входа в сделку. В настройках индикатора всего 2 параметра - период, за который будет расчитываться индикатор и метод усреднения скользящей средней.
FREE
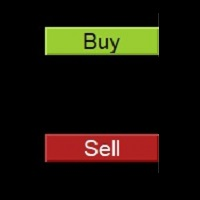
Simple buy and sell buttons to execute orders instant with automatically stop loss and take profit levels.
Stop loss and Take profit- levels can be changed in settings. Free version, only for US30- market.
Feel free to send direct message for improvements or other ideas..
---------------------- Payed version comming soon (for all markets/ timeframes).
FREE
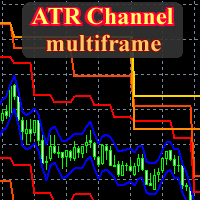
This is a fully multitimeframe version of the ATR Channel standard indicator, which works for any combination of timeframes. The indicator allows viewing price channels from different timeframes in one window, and they will always be displayed in a correct time scale. You can create and set of intervals and freely switch to a higher or lower one. Please note: in the " From Median Price " display mode, it is easy to identify reversal points at intersections of levels from higher timeframes by lev
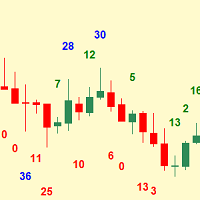
Simplest indicator for bar shadows. Very useful for Kangaroo Tail strategy.
"Shadows" - this is the distance from high and close of the bull bar and low and close of the bear bar. The purpose of the shadow is to show you if the bar is strong or not. Whether it is internal to the trend or is external. It even helps determine if a trend is starting. Input arguments: How many prevoius bars to calculate Value that should be passed to trigger the alarm How many times to repeat the alarm (Put 0 if yo
FREE
Fastest way to change the period. Suitable for traders who use many charts and timeframes. Size, shape and color can be customized.
Inputs Parameters Corner — Choose corner placement Standart is "Right lower chart corner" Color — Background color of the button ColorText — Text color of the button ColorOn — Background color of the button for the current period ColorOnText — Text color of the button for the current period Font — Arial, Verdana... FontSize — Size of the font in pixels DistanceX —
FREE

Keyboard Trading Open and Close orders with your keyboard. This tool allows you to open and close orders with your keyboard. As opening and closing orders with your keyboard is faster than with your mouse, this tool is very useful for Scalpers. How does it work? If you press the key "b", it will open a buy order with lot size, SL and TP as specified in the settings. If you press the key "s", it will open a sell order with lot size, SL and TP as specified in the settings. If you press the key "c
FREE

HEDGING AND TRAILING https://www.mql5.com/en/users/earobotkk/seller#products This Expert will hedge your trade position automatically. There are 2 buttons on chart for you to enter a trade. Blue button for buy entry and Red button for sell entry. It also can trail stop all hedged positions. It can also open its own trades with auto entry feature. How It Works : (1) By Clicking Button. When you found a setup, click the button (blue for buy and red for sell). Expert will immediately open a stop

RSI indicator with signal lines, at the intersection of which a corresponding notification will be issued, which can be in the form of a normal alert, or in the form of a user sound file.
The indicator also has the function of sending push-notifications and email notifications at the intersection of these levels.
The values of the levels can be set independently in the indicator settings, and, if desired, they can be changed and configured directly in the indicator window. To check the oper

EA Lion Cub – The Smart Cub That Hunts the Market EA Lion Cub is a real-account-proven Expert Advisor designed for precision and performance. Inspired by the agility and instinct of a young lion, this bot combines intelligent trade entries with advanced volume-based logic and adaptive trend recognition. Whether the market roars or whispers, Lion Cub moves strategically—ready to strike when opportunity arises. Key Features : Real Account Verified: Backed by real trading results—no demo illus
FREE

This is a free version of our Great tool with limited functions. The ChartChanger is a great utility tool to reduce the number of open charts on your terminal. There is three section to it: Symbols, Time frames and Templates. You need only one chart to be open and still you can scroll up to multiple ones. Symbols: With the push of a button you can change from one symbol to another, and your applied indicators will stay on the next chart. For the symbols there is an auto detection mode, or you ca
FREE

Description:
This Free Indicator will allow you to monitor the Max/Min spread in a bar/candle. By running it 24h/24h will allow you to recognize which period of time having maximum spread, based on that you will understand the market more, and could develop/improve to have better trading strategy.
Parameters: limit: <specify the limit of spread, above which the indicator will mark the price, at which high spread occurs>
Note: Beside the price marked due to high spread above, the indicator al
FREE

Dynamic Price Volatility Indicator (DPVI)
The Dynamic Price Volatility Indicator (DPVI) is designed to provide traders with valuable insights into market volatility and potential price movements. It combines elements of volatility analysis and trend identification to assist traders in making informed trading decisions.
Features: Dynamic Volatility Bands: utilizes a proprietary algorithm to calculate dynamic volatility bands that adjust in real-time based on market conditions. These bands act a
FREE

Fractals ST Patterns is a modification of Bill Williams' Fractals indicator. Unlike a standard Fractals indicator, Fractals ST Patterns allows setting any number of bars to find a fractal. This simple indicator corresponds to the parameters specified in the ST Patterns Strategy ( https://stpatterns.com/ ) . Structural Target patterns are the market itself, which is consistently divided into components. For the formation of ST Patterns , no trend lines, geometric proportions of the model itself,
FREE

This indicator uses two moving averages, a slower and faster moving average. A crossover occurs when a faster moving average (i.e., a shorter period moving average) crosses a slower moving average (i.e. a longer period moving average). Signal show alert pop-up and push notification. Variable setup for each Moving Average, 3 types of signal arrow, pop-up alert and push notifications.
Settings Fast_MA_Setup Period - period of Faster Moving Average (value 0 - xxx). Mode - type of Moving Average (S

Laboratory.Money EUR/CAD M30 Автоматическая Торговая Система из серии Energy Drive EUR/CAD M30 Вся активность эксперта проявляется только на реальной торговле. Его нет толку проверять в тестере стратегий. Запрещается бонус от брокера к вашему депозиту. Эксперт торгует с теми деньгами которые могут уйти в просадок, бонус в просадке не участвует, это приведёт к потере всего вашего депозита. Данный эксперт очень подходит для программы "Rebate" от вашего брокера. Все изменения в на
FREE
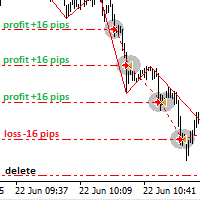
Hunter on the channel breakout Bot
The Expert Advisor places the necessary amount of BuyStop and SellStop pending orders with predefined StopLoss and TakeProfit levels at the specified time daily. The EA calculates the channel width using the ZigZag indicator and sets a grid of BuyStop and SellStop pending orders according to the specified settings. The first pair of BuyStop and SellStop pending orders is placed at a predetermined distance from the channel borders. The distance is set in the per

The VR Object Delete All script solves the problem of garbage on the chart. it is often necessary to completely clear the chart of everything that is put on it, comments, lines, objects. The script completely deletes everything, even those objects that are not visible. When working, VR Object Delete All writes everything it does in the terminal log, as well as the names of objects to delete. Displays the number of deleted objects as a separate line. in case of any errors, it will display an erro
FREE
Stop and Reverse Martingale EA is an expert advisor that integrates the following inputs within it: Start lot size Lot multiplier Take profit distance in points Take profit distance in points *this input is a stop loss, is misspelled within the code of the EA Magic number A and B Start cycle with round number The distance of round number Daily maximum orders per cycle and close all Daily loss (maximum orders per cycle when this last order hit the stop loss the EA close all orders in the same m
FREE
This is an adviser that often trades and opens trades almost every day (with normal optimization). In this case, the adviser opens no more than one transaction in each direction. When there are a lot of deals in optimization, more often it will give more profit in real life than advisers who, during optimization, make fewer deals, but show high profitability. This Expert Advisor is a free version of Trading every day and has some limitations: - currency pair only EURUSD - lot limit to 0.1 Input
FREE
The product helps to find the highest peak and the lowest low. Help investors optimize profits. With a win rate of up to 80%. You do not need to adjust any parameters. We have optimized the best product. Your job just need to see and trade. Products with technological breakthroughs. Contact other products: https://www.mql5.com/en/users/hncnguyen/news.
FREE
Free Utility Tool by BlueDigitsFx
Quick symbol switching for improved trading workflow
MetaTrader 4 version only
Optional access to updated & support via the official BlueDigitsFx Telegram Bot Assistant BlueDigitsFx Symbol Changer MT4 BlueDigitsFx Symbol Changer is a lightweight utility that allows traders to quickly change the symbol of an existing chart while keeping all indicators, objects, and chart settings intact. It is designed to improve workflow efficiency when analyzing or trading
FREE

Read Elliott wave principle automatically. With the Swing Reader, you can easily read the Elliott Wave Principle through an automatic system. With swing, we mean a ZigZag market that is created by a breakout of its standard deviation. You can set the deviation manually, or you can let the indicator do it automatically (setting the deviation to zero).
Advantages you get Never repaints. Points showing a horizontal line, in which statistically a long wave ends. Candles showing a vertical line in

This indicator includes various types of moving averages. The indicator contains the following set of moving averages: CA (Cumulative Moving Average) MIN (Minimum for the period) MAX (Maximum for the period) SMA (Simple Moving Average) EMA (Exponential Moving Average) DMA (Double exponential moving average) TMA (Triple exponential moving average) LWMA (Linear Weighted Moving Average) SMM (Simple Moving Median) SMMA (Smoothed Moving Average) HMA (Hull Moving Average) NoLagMa The list of moving av
FREE

AIS MT4 INDICATOR 5 ALL INCLLUSIVE SET
!!!!!!!!!!!!!!!!!!!!!!!!!!!!!!!!!!!!!!!!!!!!!!!!!!!!!!!!!!!
!
! ATTENTION ! LIMITATION OF FREE OFFER PERIOD IS IMPLICIT !
!
! CONFIRMATION 2024-08-20 20:00 !
!
!!!!!!!!!!!!!!!!!!!!!!!!!!!!!!!!!!!!!!!!!!!!!!!!!!!!!!!!!!!
GUIDE
CHAPTER 1 IMPORTANT INFORMATION <1> THIS INDICATOR IS ONE OF THE SERIES OF NEW AIS INDICATORS AIS MT4 INDICATOR 1 =ADVANCED CLASSIC= AIS MT4 INDICATOR 2 =MULTIFRAMES= AIS MT4 INDICATOR 3 =LINES= AIS M
FREE

Binary options tester Trading panel to test your strategies according to the rules of binary options. Scope: Set the percentage of profit from the transaction. Set the expiration time in seconds. Set the bet size Set the Deposit amount. Make several deals in a row. Keep track of the time before expiration. The tick chart with trade levels is duplicated to an additional window for accuracy. It allows you to work both in the testing mode and in the real quotes mode. The program gives an idea of bi
FREE

速度の抵抗ラインは傾向および抵抗ラインを定めるための強力な用具である。 この指標は、チャートの極値と特別な数式を使用して線を構築します。 指標は、トレンドの方向とピボットポイントを決定するために使用することができます。
<---------------------------->
指標パラメータ:
"Depth of search" -チャートの極端な検索の深さ(バー単位) "Back step of search" -極端な間の最小距離(バー単位) "Deviation of price" -同じタイプの両極端間の許容価格差 "Line color" -対応するインデックスを持つ線の色 "Line style"-対応するインデックスを持つラインスタイル "Line width"-対応するインデックスを持つ線幅 <---------------------------->
あなたは本の中でより多くの情報を見つけることができます"エドソン*グールドによる希少な著作のコレクション"またはプライベートメッセージで私
<-----------------------
FREE

このツールは、2つの大きなメリットを提供します。MT5の経済指標の使いやすさを向上させ、データをMT4とシームレスに共有できるようにします。例えば、10年以上前の経済指標データを効果的に利用して、トレーニングやバックテストを行うことができます。また、MT4の PracticeSimulator と互換性があり、歴史的データを用いたトレード練習からMT4でのリアルトレードまで幅広く活用できる価値のあるツールです。 重要な注意事項
このツールはMT5から経済指標データを取得する必要があるため、MT4版単体では動作しません。MT5版も必ずインストールしてください。 => MT5版
MT5経済指標の向上 歴史データへのアクセス : 10年以上前のイベントを含む経済指標データを分析することで、詳細なバックテストや履歴レビューが可能です。 カスタマイズ可能な表示 : 経済指標はチャート上に目立たないように表示され、データを背景に溶け込ませるオプションも選択可能です。 自動時間調整 : 時間帯やサマータイムを自動的に調整し、過去のイベントを正確に表示します。 MT4の互換性とメリット シームレスな
FREE

Draws Daily, Weekly and Monthly pivots and the respective supports and resistances levels (S1, S2, S3, R1, R2, R3). Ideal for placing stop losses and/or using as a break-out strategy. Features Unlike other pivot indicators in market you get very clean charts. Pivot levels are plotted irrespective of timeframe, on which you trade, i.e. M1, M5, M15, M30, H1,H4 or Daily timeframes. Pivot levels do not change when you change timeframe. Fully customizable options. If you are looking at Fibonacci
FREE

This is a free version of the Dmytriyx Impulse Expert Advisor. The Expert Advisor analyzes the current price dynamics when it deviates from the average value. Uses pending orders in the impulse direction, at a fixed distance, then moves the pending order in the direction of correction. You can configure the number of pending orders to be placed in the signal direction - the distance between the pending orders is LevelDist , the lot value of each new order is equal to a half of the previous one (
FREE

This is an extension of the previous published DollarIndex with the addition of the function for calculating EURO Index under ICE Formula. Note that the broker should provide the following data:
For Dollar Index formula, EURUSD, USDJPY, GBPUSD, USDCAD, USDSEK and USDCHF are needed. For Euro Index formula, EURUSD, EURGBP, EURSEK and EURCHF are needed. Now in this version if the SEK (the most uncommon) is not provided, the formula still works, since it adds 0.0001 to its value, but the index will
FREE

如果产品有任何问题或者您需要在此产品上添加功能,请联系我 Contact/message me if you encounter any issue using the product or need extra feature to add on the base version.
PA Touching Alert is a tool to free you from watching price to touch certain critical price level all day alone. With this tool, you can set two price levels: upper price and lower price, which should be greater than/ less than the current price respectively. Then once price touches the upper price or lower price, alert and/or notification would be sent
FREE

Tester Periods is the useful indicator for visual strategy tester which extend chart periods. Its designed for the trading utility Trade Shell (included Trade Shell SMC ).
Run the Trade Shell on the visual tester. Then put the Tester Periods indicator on the chart. If you wanna see timeframes M1, M5, M10, M15 , for example, then you have to run visual tester on M1 and to define multipliers like that: TimeFrame_Periods_Multiplier = 1,5,10,15 If you wanna see timeframes M5, M20, M30, H1, for
FREE

Introducing the Professional Indicator ARKA – Candle Close Time
Do you want to always know the exact remaining time for the current candle to close? Or do you want to instantly see the real-time broker spread right on your chart without any extra calculations?
The ARKA – Candle Close Time indicator is designed exactly for this purpose: a simple yet extremely powerful tool for traders who value clarity, precision, and speed in their trading.
Key Features:
Displays the exact time re
FREE

This indicator works by plotting fractals on the chart as arrows that can be used as buy or sell signals. It is a great tool for both new and experienced traders as it provides a clear visual representation of the market and helps traders identify fractals. Although it repaints, it can be used quite effectively in conjunction with other tools to filter trading strategies.
We use this indicator in this way in our RoyalFractals II Expert Advisor, which you can purchase on the MQL5 Market: https:
FREE
Всем привет. И снова, я, Вадим Сергеевич Лепехо, трейдер(частный) опыт 20 лет около. Forex в основном. Предлагаю Вам оценить, протестировать, опробовать индикатор. И дать свою оценку, заключение, РЕЗЮМЕ....)))). Итак, как он работает. Очень прост в понимании. Алгоритм такой. Индикатор на графике(chart) рисует кружки снизу сверху, разных цветов. Ждем когда появится на фоне одних красных кружков 1, 2, ну на крайняк 3 кружка зеленого цвета и + обязательно должен появится следом опять кружок красног
FREE

Trend easy простой трендовый индикатор в виде гистограмы. окно индикатора разделено на две части верхняя гистограма движение в бай, нижняя гистограма движениие в сел. Кроме гистограмы, сигнал индикатора дублируется на графике стрелками. В меню индикатора имеется количество баров в истории индикатора
значения периода для определения тренда разрешение рисования стрелок на графике код и цвета стрелок алерты и отступ стрелок
FREE

This script allows you to toggle the "Show Trade Levels" option, but for the current chart only. Normally, you can only change the setting using the Options -> Chart menu for ALL charts, but this script allows you to do it for a SINGLE chart. I'm using it when I take screenshots, because most of the time I'm not trying to show the trades, just some functionality of one of my other tools. Iif you need that functionality, then this script is very helpful!
If the script helps you, please let me k
FREE
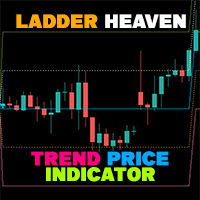
If you have difficulty determining the trend as well as entry points, stop loss points, and take profit points, "Ladder Heaven" will help you with that. The "Ladder Heaven" algorithm is operated on price depending on the parameters you input and will provide you with signals, trends, entry points, stop loss points, take profit points, support and resistance in the trend That direction.
Helps you easily identify trends, stop losses and take profits in your strategy!
MT5 Version: Click here
FREE
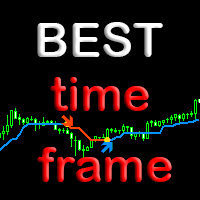
Индикатор BestTF поможет быстро выбрать самый лучший для торговли таймфрейм валютной пары или криптовалюты. Индикатор BestTF рассчитает и покажет в таблице крутизну графика (волатильность) для всех существующих таймфреймов текущего торгового инструмента. Почему важно правильно выбрать таймфрейм
Выбор таймфрейма является ключевым аспектом при торговле на валютном рынке по нескольким причинам:
Торговые стратегии: Различные торговые стратегии эффективны на разных таймфреймах. Например, краткосроч
FREE
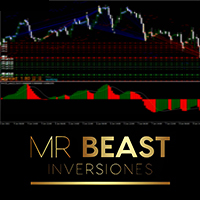
Indicador Gratuito desarrollado por Mr Beast Inversiones Mr Beast : Gestión de riesgo profesional. Brindo a la comunidad la entrada a productos de M Beast. Echar un vistazo a mis señales y expert advisors. Descuentos de hasta 70% Diclaimer: La negociación en Forex, CFD y Opciones conlleva un riesgo de pérdida sustancial y no es adecuada para todos los inversores. El alto grado de apalancamiento puede actuar en su contra y también en su favor, Antes de decidirse a operar en productos tan apalanca
FREE
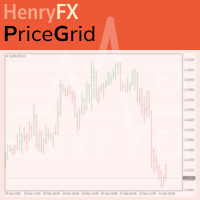
This indicator help you to easily calculate the price moving. You can change the gird size withing the input parameter for your trading style, such as hedge, swing trader, ect. It can let you easy to find your takeprofit and stoploss target price in chart.
For more about my tools and EA, you can join my channel below, thank you. Telegram channel: t.me/HenryEAChannel
FREE

Скрипт для быстрого закрытия рыночных и отложенных ордеров. Этот зацикленный скрипт гарантированно закроет все выбранные ордера. Он будет работать, пока не закроет все выбранные позиции и удалится когда сделает свою работу. Если у Вас много открытых позиций этот скрипт поможет вам. Интуитивно понятный интерфейс 1) Просто бросьте его на график. 2) Выберите ордера, которые надо закрыть. По умолчанию выбраны все! 3) нажмите кнопку "Close". Версия для MT5 https://www.mql5.com/ru/market/product/1297
FREE
Recommended Broker and Utility Capabilities For optimal use of this utility, it is advisable to choose a broker like RoboForex or a similar one that offers fast order execution and low spreads. Utility Description: The purpose of this utility is to manage market orders, including opening new trades and optimizing losing positions using an internal algorithm. The utility incorporates trend filtering and various types of trailing stops and take profits, making it versatile for trading any instrum
FREE
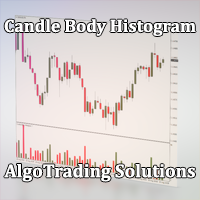
Индикатор Candle Body Histogram отображается в отдельном окне и показывает размер тела каждой свечи в виде гистограммы. В зависимости от того растёт свеча на графике или снижается, гистограмма меняет свой цвет. Свечи "доджи", у которых совпадают цены открытия и закрытия, так же отображаются на гистограмме отдельным цветом. Поскольку индикатор строится от нулевого значения, он позволяет визуально сравнить тела свечей относительно друг друга. На гистограмме можно разместить уровни, чтобы отслежив
FREE

Indicator SR levels true in small time frames is very useful for scalping while in bigger ones it is good for day or position trading.
SR levels true can draw 4 support/resistance levels based on defined maximum rebouds from price level. Indicator scans defined number of bars in time axis and defined number of pips in price axis (both sides - up and down) and calculates how much times price was rejected from scanned price levels. At the price levels where maximum rebounds are counted, support
FREE

Designed to mark a specific price and time point on an MT4 chart based on a single mouse click, synchronizing this data across all timeframes for the same symbol. Its primary purpose is to help traders pinpoint and track critical levels or events (e.g., support/resistance or entry points) with persistent visual markers. The indicator uses dashed lines for price and time crosshairs, accompanied by labels that dynamically adjust to stay within chart boundaries, ensuring clarity regardless of win
FREE

MAS Indicator can be used in all currency pairs and at any timeframe, it is suitable for any trading speed. In addition, it's relatively easy to trade with the MAS Indicator. This indicator produces two signals: BUY Signal: arrow deep sky blue SELL Signal: arrow red
Indicator parameters MA Method – type of moving average MA Shift – shift moving average Fast - fast period moving average Slow – slow period moving average RSI – value rsi Confirm – value confirm Flat – value flat Colors - colors of
FREE

MTF Heiken Ashi MA is a multiple timeframe Heiken Ashi & Moving Average indicator. Fully customizable for advanced & unique Heiken Ashi & Moving Average calculations.
Key Features Modified appearance and appeal from the traditional using only H eiken Ashi MA bodies. MTF Higher or lower timeframes available making this it great for trends and scalping. There are many settings that can be non-repaint for signals at a new bar and at bar 0.
Inputs Timeframe = PERIOD_CURRENT - timeframe of Moving
FREE

Aroon Classic インジケーターの概要 Aroon Classic は、チャート上でトレンドの発生と持続性を定量的に把握できるテクニカル指標です。トレンドの強さや転換タイミングを「Aroon Up」と「Aroon Down」という2本のラインで示し、0~100 の範囲で表示されます。Aroon Up が高値圏にあるほど上昇トレンドが強く、Aroon Down が高値圏にあるほど下降トレンドが強いことを意味します。 主な特徴 トレンドの発生から転換までを視覚的に判別可能 カスタマイズ可能な計算期間(デフォルト14期間) 線の色・太さ・スタイルを自由に設定可能 インジケーターのパラメーター パラメーター名 説明 デフォルト値 Period Aroon の計算に使用するバー数 14 Aroon Up Color Aroon Up ラインの色 DodgerBlue Aroon Down Color Aroon Down ラインの色 Tomato Line Width ラインの太さ(ピクセル) 2 インジケーターの計算方法 Aroon Up は、直近期間内の最高値が発生してからのバー数
FREE

Delete All Pending Orders for MT4 script - closes absolutely all orders, whether pending or market ones.
Orders are closed at the current profit/loss indicators at the time of closing.
The script is suitable for moments when you need to quickly close all orders at the current indicators.
The script is very easy to use, just drag the script onto the chart and it will do its job.
Add me as a friend, I have many other useful products.
FREE
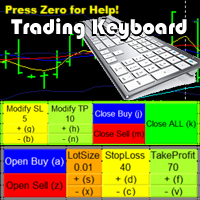
Trading Keyboard Tool will enable you to: Easily OPEN/CLOSE/MODIFY orders with Keyboard and with Buttons on Screen. Modify Order parameters with shorcuts.
Export different Prices into a file for analysing outside MT4. Save Chartscreen into an image. Show Fibonacci on screen with shorcut.
You can export these Prices into files:
COHL : history of Close,Open,High,Low in one file.
Close - history of Close in one file. Open - history of Open in one file. High - history of High in one file.
FREE

Note: This is a Limited Edition of Lion Grid . It works only on Mondays.
The trading strategy has been been created by using machine learning algorithms to build a model directly from the historical data. Machine learning is an application of artificial intelligence (AI) that provides the ability to automatically learn and improve from experience without being explicitly programmed. The strategic focus of this robot is to identify trend reversals by analyzing multiple technical indicators (
FREE

Price Predictor is an indicator that shows precise price reversals taking into account a higher time frame and a lower time frame candle patterns calculations it is great for scalping and swing trading . Buy and sell arrows are shown on the chart as for entry signals. BIG Arrows indicates the trend - SMALL Arrows signal a trade (BUY/SELL) - A Green BIG UP Arrow with a support green line indicates a Bull Market : wait for buy signal - A Green SMALL Up Arrow after a BIG green arrow is

This indicator is designed to find the difference in MOMENTUM price and indicator. This indicator shows the price and indicator difference on the screen. The user is alerted with the alert sending feature. Our Popular Products Super Oscillator HC Cross Signal Super Cross Trend Strong Trend Super Signal Parameters divergenceDepth - Depth of 2nd ref. point search Momentum_Period - Second calculation period indAppliedPrice - Applied price of indicator indMAMethod - MA calculation method findEx
FREE
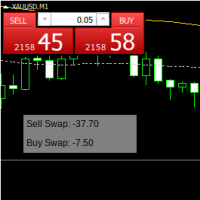
showSwap is a simple indicator. shows SWAP on the instrument chart for this instrument. You can specify the magic of the instrument, if 0, then that’s it. as well as the coordinates of the indicator panel on the chart. In forex trading, SWAPs can be either positive or negative depending on the interest rate differential between the two currencies involved in the trade. Traders may either receive or pay SWAPs depending on whether they are holding a position past a certain time (usually at the end
FREE
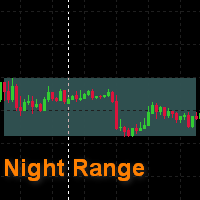
This is a simple indicator that draws a night range. The start and the end of a working day are specified in hours, color rectangles are adjusted as well. It helps to view the history in search for regularities , excluding unpredictable night time. It can be used to search for a breakthrough of the night range. It is drawn as a background , and does not cover a chart and other indicators .
FREE

If you are boring in repeatedly changing of trading symbol in every charts when use multiple charts to analyzing prices or trading. This indicator can help you. It will change the symbol of any other charts in the terminal to the same as in the chart you have attached this indicator to it whenever you add new symbol to the chart or click on the button. After finished the job it will sleep quietly waiting for new occasion in order to minimize resource usage of the computor.
FREE

ADR 10 mostra l'intervallo medio di pips di una coppia Forex, misurato su un numero di 10 giorni . I traders possono utilizzarlo per visualizzare la potenziale azione dei prezzi al di fuori del movimento medio giornaliero.
Quando l'ADR è al di sopra della media, significa che la volatilità giornaliera è superiore al normale, il che implica che la coppia di valute potrebbe estendersi oltre la sua norma.
L'ADR è utile anche per il trading di inversioni intraday. Ad esempio, se una coppia di val
FREE

SkyNet EMA is an indicator will assist you by suggesting when to go long or short based on price action and the crossings of Exponential Moving Averages such as 14 period and 50 period. Just attach it to your chart and it will monitor the asset for potential sell opportunities and if found will paint a red arrow in your chart. Also will try to find buy opportunities and if found will paint a green arrow in your chart. It could be used with any currency but majors are recommended since they will
FREE

The indicator displays on the chart a map, on which markers show the current trading session, as well as shows a text. The indicator provides two types of background display: white and black. The indicator is displayed as the background and does not hinder tracking the current market situation.
Parameters: GMT - the time difference of the terminal and GMT. Background - selection of background - black or white.
FREE

Trading panel for manual trading. Has a fairly wide functionality. Allows you to automatically calculate the order size, open both market and pending orders. It has a wide range of options for closing orders, it is possible to partially close orders, close orders after reaching a certain profit or loss, separately close profitable and unprofitable, buy and sell, as well as pending orders. The panel also contains a simple implementation of a grid of pending orders, reverse and lock functions, tr
FREE

iSTOCH in iMA is an indicator which applies the stochastic changes to the iMA. Changes are reflected by altering the moving average colors. It is a useful tool to see easily the upsides or downsides of the stochastic.
You can to get source code from here .
Parameters MA_Periods - iMA period. MA_Method - iMA method. K_Period - K line period. D_Period - D line period. Slowind - slowing. STOCH_MA_METHOD - averaging method for MA. PriceField - price (Low/High or Close/Close). STOCH_LevelUp - uptre
FREE

Volume Levels is a very important indicator for exchange trading. Most of the trades were performed on those levels. This indicator displays the price level that had the most trade volumes over a certain period of time. Often, the price bounces from those levels in the future, and it can be successfully used in trading. This is a demo version that works only on the USD/JPY currency pair. To work on all currency pairs, install the full version: https://www.mql5.com/en/market/product/15888
Parame
FREE
MetaTraderマーケットは、履歴データを使ったテストと最適化のための無料のデモ自動売買ロボットをダウンロードできる唯一のストアです。
アプリ概要と他のカスタマーからのレビューをご覧になり、ターミナルにダウンロードし、購入する前に自動売買ロボットをテストしてください。完全に無料でアプリをテストできるのはMetaTraderマーケットだけです。
取引の機会を逃しています。
- 無料取引アプリ
- 8千を超えるシグナルをコピー
- 金融ニュースで金融マーケットを探索
新規登録
ログイン