YouTubeにあるマーケットチュートリアルビデオをご覧ください
ロボットや指標を購入する
仮想ホスティングで
EAを実行
EAを実行
ロボットや指標を購入前にテストする
マーケットで収入を得る
販売のためにプロダクトをプレゼンテーションする方法
MetaTrader 4のための新しいテクニカル指標 - 30

Unlock the Power of Precision with the Storm Peak Indicator! The Visual Storm Peak Indicator is a sophisticated, signal-driven tool designed for traders who seek clear and actionable market insights. It's built on a robust logic foundation, leveraging the Commodity Channel Index (CCI) to identify market peaks and reversals effectively. While the indicator comes with a pre-set structure, it has been specifically created for you to optimize and adapt to your unique trading style. Why Choose the S

Wind Shift Indicator Are you ready to harness market shifts with precision? The Wind Shift Indicator is your tool for identifying potential reversals and trend continuations. Designed for traders who prefer to fine-tune their tools, this indicator is not optimized, giving you the freedom to tailor it to your unique trading style. Logic Behind the Strategy: The Wind Shift Indicator employs a combination of Commodity Channel Index (CCI) logic and visual signal plotting to detect shifts in market

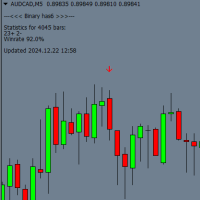
Binary SS はバイナリーオプション取引のためのツールで、以下の特徴があります: どの時間枠でも使用可能。 任意の通貨ペアに対応。 トレンドに基づいた高精度のシグナル を生成。 使い方: 次のローソク足のシグナル は、現在のローソク足が閉じる前にチャート上の矢印として表示されます: 青い矢印 — 買いシグナル。 赤い矢印 — 売りシグナル。 デフォルトの有効期間は 1本のローソク足 ですが、設定で 1~4本 に調整可能です。 インストール方法: "MQL5"フォルダをダウンロード :
こちら からダウンロード 。 ターミナルのディレクトリに配置 してください。 動画チュートリアルをご覧ください:
インストールガイド 。 追加機能: 通知ポップアップを受け取るには、この追加インジケーターを使用してください:
追加インジケーター を ダウンロード 。

FIFTYインジケーターは、手動でレベルを描画する必要がない自動バージョンを提供するようになりました。このバージョンでは、日次、週次、月次、年次のレベルが自動的にチャート上に描画され、精度を確保しながら時間を節約できます。さらに、これらのレベルの表示を切り替えるボタンが用意されており、完全なカスタマイズが可能です。手動操作を好む方のために、無料版のインジケーターも引き続き利用可能で、完全な機能を備えています。トレーダーは、自分の取引スタイルに応じて手動ツールと自動ツールを選択できます。 最も論理的なインジケーターの一つ。 高い信頼性。 FIFTYインジケーターは、手動でレベルを描画する必要がない自動バージョンを提供するようになりました。このバージョンでは、日次、週次、月次、年次のレベルが自動的にチャート上に描画され、精度を確保しながら時間を節約できます。さらに、これらのレベルの表示を切り替えるボタンが用意されており、完全なカスタマイズが可能です。手動操作を好む方のために、無料版のインジケーターも引き続き利用可能で、完全な機能を備えています。トレーダーは、自分の取引スタイルに応じて手動ツ
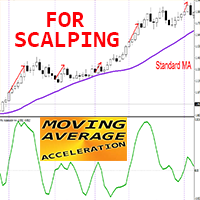
Crypto_Forex インジケーター MT4 用移動平均加速、リペイントなし。
MA 加速 - スキャルピング インジケーターで、「MA スピード」インジケーターの補助ツールとして設計されています。
- このインジケーターの計算は、物理学の方程式に基づいています。移動平均線の加速が表示されます。 - MA 加速を使用すると、標準戦略でもアップグレードする機会がたくさんあります。SMA、EMA、LWMA に使用できます。 - MA 加速は、対応する移動平均の 2 次導関数です。 - インジケーターは、MA スピード インジケーターが値を変更する速度を示します。 - MA 加速インジケーターの値が < 0 の場合: MA スピードは弱気方向に増加しています。MA 加速インジケーターの値が > 0 の場合: MA スピードは強気方向に増加しています。 - MA 加速インジケーターは、MA スピード インジケーターとともに、メイン トレンドの方向の高速スキャルピング戦略で使用することをお勧めします。MA スピード インジケーターの値が < 0 の場合: トレンドが下降します。 MA
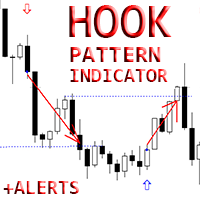
Crypto_Forex MT4 用インジケーター「フックパターン」
- インジケーター「フックパターン」は、プライスアクション取引に非常に強力なインジケーターです。再描画なし、遅延なし。 - インジケーターは、チャート上の強気および弱気フックパターンを検出します。 - 強気フック - チャート上の青い矢印信号 (画像を参照)。 - 弱気フック - チャート上の赤い矢印信号 (画像を参照)。 - PC、モバイル、および電子メールアラート付き。 - インジケーター「フックパターン」は、サポート/レジスタンスレベルと組み合わせるのに適しています。
高品質のトレーディングロボットとインジケーターをご覧になるにはここをクリックしてください! これは、この MQL5 ウェブサイトでのみ提供されるオリジナル製品です。
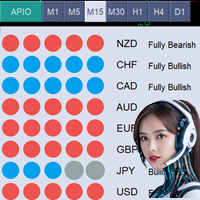
現在の製品価格は49ドルで、限定的な期間です。次の価格は99ドルになります。 オールパワーインワン(APIO)インジケーター オールパワーインワン(APIO) インジケーターは、USD、EUR、GBPなどの主要通貨の強さを評価するために設計された強力なツールです。選択した時間足で複数の通貨ペアの動きと方向を分析することで、APIOは通貨の強さと潜在的な取引機会をトレーダーに明確に示します。 APIOのMT5バージョンが利用可能です。以下のリンクからMT5バージョンにアクセスしてください: https ://www .mql5 .com /en /market /product /129241 このインジケーターを使用すると何が得られるのでしょうか? 各通貨の現在の強さ: USD、EUR、GBPなどの通貨の現在の強さを追跡します。 購入のベストチャンスリスト: 購入の最適な取引機会を提供するペアのリストを取得します。 売却のベストチャンスリスト: 売却の最適な取引機会を提供するペアのリストを取得します。 リアルタイムデータと複数の時間足のアクセス: インターフェースのボタンを使

New Support and Resistance Indicator with Probabilities and Alerts Description: Maximize your profits with the newest Support and Resistance indicator! Our indicator automatically calculates support and resistance levels based on 24-hour analysis periods and provides detailed probabilities for each level. Additionally, you can set up custom alerts to be notified when the price touches specific levels, directly on your mobile device. Features: Support and resistance analysis based on hourly data
FREE
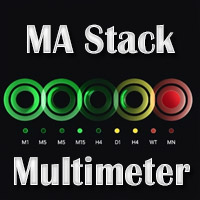
Basic MA Stack Indicator: This is a single timeframe & single currency indicator. It looks at MAs and show 3 possible states on chart: When all MA Align Upwards: Stack Up When all MA Align Downwards: Stack Down If MAs not aligned: Stack None Available for free here: https://www.mql5.com/en/market/product/69539
You can position the small block on your chart. And get current status of the Stack. It is simplistic and very eash to use and can guide you to find good trends in your strategies. Buy St

Moving Average Stack:
MA Stack single timeframe, multi-timeframe and multi-currency versions for MT4 (Metatrader 4) Very useful for finding current and higher timeframe trends. Best suited for long term trend based trading. For quick scalping use fewer moving averages. And not suitable during low volatility. Only use during high volatility and steady trending markets. Use this to enhance your existing Trend based strategies to find best trends. Instead of using as a standalone indicator.
You ca
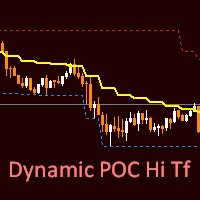
The new Dynamic PACK Hi Tf indicator is based on tick volumes. The middle line shows the average price for the selected period of the selected senior timeframe. The upper and lower lines show the maximum/minimum of the same selected period of the same timeframe. In the settings, the user can optionally choose which timeframe and bar calculation period he needs. You can also change the style, thickness, and color of each of the lines.
In the "StsrtBars" parameter, you can select the start peri

Divergentor — это продвинутый индикатор предназначенный для выявления дивергенции - точек расхождения цены у двух различных пар с известной корреляцией. Например EURUSD и индекса доллара DXY, USDCHF и EURUSD, ETHUSD и BTCUSD, Nasdaq100 и SP500 и тп. Индикатор использует фундаментальную закономерность движения цены за основным активом и дает преимущество в более раннем определении разворота на текущей паре. Индикатор может быть использован как готовая стратегия входа. Идеально подходит как для

Reversals is a trading tool designed to help traders identify potential trend reversals. Suitable for all experience levels, it provides instant alerts across multiple channels, with customizable settings . Whether you’re a scalper or swing trader, Reversal Pro can be integrated into your existing strategy.
Key Features of Reversals
Real-Time Alerts: Receive buy and sell signals directly via email, mobile, or desktop notifications. Non-Repaint Design: Once a signal is generated, it remains

The Dead Fish Pattern Indicator is a fresh take on the classic Quasimodo (QM) pattern, originally taught by Cikgu Mansor Sapari. But unlike traditional QM tools, this one’s laser-focused on bullish setups only—and for good reason.
Why no bearish patterns? Simple: they tend to be noisy and unreliable, often throwing false signals that can mess with your trade decisions. This indicator is built to filter that out and keep things clean, especially in uptrending markets.
Here’s how it works: it st
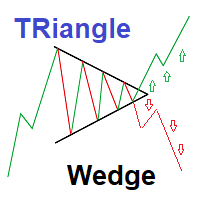
Strategy set to trade Triangle wedge break
This is a simple very effective strategy based on detecting and showing triangle wedges formation Strategy set to trade Triangle wedge break Red Arrows appears on crossing triangle down Green Arrows appears on crossing triangle Up You can also trade lower and upper triangle limit :(new version may be released to allow arrows for side ways trading) ---Sell on price declines from High triangle Level - Buy on increasing from Lower triangle level 2 inp

Spot Turning Points with Ease The Catalyst Indicator is a tool designed to assist traders in analyzing potential turning points in price movements. By combining a smoothing technique with an advanced algorithm, this indicator offers signals that can support your trading analysis and decision-making.
Parameters: Variable (Defaults) Cycle 14
Period 21 Drag 0.2 Computer Alerts True Play_Sound True Send_Email false Send_Notification True Signal_Bar 0
How It Works Signal Detection : Gree
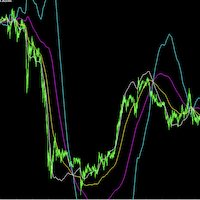
SourcePoint是一个很好的中长线交易指示器,他能独立使用,也可以去其他趋势型指标独立使用,可以很明确的给出趋势走向,很好的指出最佳的buy和sell位置,指标不含有未来函数,不会重新绘制,不仅能够应用到自己的手动交易过程中,还能完全可以写入到自己的EA中,如果你需要 MT5版本 可以去( https://www.mql5.com/zh/market/product/101744?source=Site +Market+My+Products+Page#description) 。 (如果你感觉到这个指标能够帮助你进行更准确的交易,请帮忙给个好评,希望我的作品能够帮助更多有需要的人) ===================参数列表===================== fastP: 96 slowP:208 avgP:72 =================参考使用方法=================== 此指标可以适用于任何交易品种,能够用在任何周期。 个人建议:短线交易选择M5,中长线交易选择M15 每次形成一个交点,就是一个交易机会,同时也是一个持仓平仓点位。建议配合
The ATR Strategy Multiplier is designed to help traders assess market volatility using the Average True Range (ATR) across multiple timeframes. It calculates and displays ATR values along with recommended Stop Loss (SL) and Take Profit (TP) levels based on the ATR. These levels are essential for setting risk management parameters and optimizing trading strategies.
Parameters: Indicator Parameters : ATR Period : Determines the period over which the ATR is calculated. Timeframe : Select the time
FREE

Zone to Zone Indicator for MT4 Introducing the "Zone to Zone" indicator for MetaTrader 4, designed to enhance your trading strategy with precision and versatility. Key Features: Accurate Historical Resistance/Support Zones : Effortlessly identify key resistance and support zones on your chart, drawn with pinpoint accuracy. Highly Configurable : Tailor the indicator to your specific needs with a wide range of input parameters. Customizable Parameters : Specify the length, width, and number of hig

The correlation indicator is an analytical tool used to measure the relationship between two or more currency pairs or financial assets in the market. This indicator helps traders understand how the price movement of one asset affects or relates to the movement of another asset. Correlation is typically expressed in values ranging from -1 to +1: Positive correlation (+1) : Indicates that two assets move in the same direction. Negative correlation (-1) : Indicates that two assets move in opposite

An indicator that calculates a volume value adjusted based on where did the candle close, so it gives a directional kind of volume. Buffers : It has two buffers, net long ,and net short. The buffers' empty value is mapped to the EMPTY_VALUE constant in MQL4 to make it easier to use the indicator in another EA or Indicator. Uses : Didn't find a specific use, but maybe combine it with VSA? not sure.
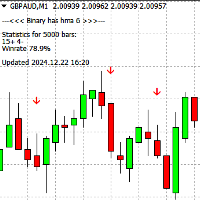
Binary has 6 は、MT4でバイナリーオプション取引を行うためのインジケーターで、どの時間枠や通貨ペアでも動作します。また、FX取引にも使用可能です。 主な特徴: 有効期限: デフォルトでは1本のローソク足に設定されていますが、設定で1~3本の期間に調整可能です。 トレンドベースの取引: インジケーターは現在のトレンドに基づいてシグナルを生成します。 シグナル: 現在のローソク足がクローズする前に、チャート上に矢印(赤または青)が表示され、エントリーのシグナルとなります。このシグナルはバッファーを介して利用でき、外部EAと連携して自動取引が可能です。 柔軟性: さまざまな市場状況や戦略に適しています。 インストール: 正常に動作させるには、 MQL5 フォルダーをターミナルのディレクトリに追加する必要があります。 こちら のリンク からフォルダーをダウンロードできます。インストール手順の詳細は こちら のビデオ をご覧ください。 補足: シグナルが表示された際にポップアップ通知を受け取るには、追加インジケーターを こちら からインストールしてください。
FREE
Binary HH 6 インジケーターは、バイナリーオプション取引向けに設計されており、 M1 と M5 タイムフレームで動作します。また、任意の通貨ペアで使用可能です。FX取引にも適しています。 主な特徴: 有効期限: デフォルト設定は1本のローソク足ですが、設定で1~3本に調整可能です。 トレンド分析: トレンドに基づいて動作し、チャート上に矢印としてシグナルを提供します: 青い矢印 – 買いシグナル。 赤い矢印 – 売りシグナル。 アラート: シグナルは現在のローソク足が閉じる前に表示され、外部EAを使用して自動取引を行うことができます。 必須条件: MQL5 フォルダをMT4ターミナルディレクトリにコピーしてください。以下のリンクからダウンロードできます:
https ://disk.yandex.ru /d /DPyo0ntaevi_2A 。 インストールガイド動画をご覧ください:
https ://youtu.be /Q9RvyKFQ4uA ?si =_q4qaF9jKPnhcj9x 。 シグナル表示時のポップアップ通知には、こちらの追加インジケーターを使用してください:
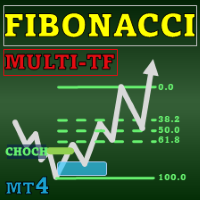
Special offer : ALL TOOLS , just $35 each! New tools will be $30 for the first week or the first 3 purchases ! Trading Tools Channel on MQL5 : Join my MQL5 channel to update the latest news from me Fibonacci Confluence Toolkit Multi-Timeframe は、プロのトレーダー向けに設計された高度な技術的分析ツールで、主要な市場シグナルとパターンを組み合わせて潜在的な価格反転ゾーンを特定するのに役立ちます。タイムフレームセレクターのダッシュボードを通じたマルチタイムフレーム表示機能により、このツールキットは市場のダイナミクスを包括的かつ洞察に満ちた視点で提供し、正確かつタイムリーなトレーディング判断を可能にします。 MT5バージョンの詳細は: Fibonacci Confluence Toolkit MT5 Multi Timefr

取引レベルインジケーターは、エントリーポイント、ポジションの保持、トレンドの方向を決定するために設計された取引システムです。
1 つの複合体で動作する複数のメカニズム、トレンド方向の波動分析、シグナル構築時のレベル分析が含まれており、考えられる TP および SL ターゲットを示します。
インジケーターの機能
シグナル矢印は現在のローソク足に表示されますが、色は変更されません。 特別なアルゴリズムを使用して、価格が跳ね返るレベルを検索します。 トレンドに合わせた働きをします。 このシステムは汎用的であり、さまざまな取引商品に適用できます。 矢印アラートにはいくつかの種類があります。 信号矢印の入力パラメータは自動モードで設定され、動作します。 時間枠に基づいて「トレンド波期間」パラメータを変更します 「ターゲットレベル SL TP」パラメータは主要通貨ペアに対して定義されており、他の取引商品で使用する場合は 10 以上の増加が可能です。
インジケーターの仕組み
トレンドを判断するには、インジケーターに波線があり、価格を下回っている場合はトレンドが弱気であり、価格を下回っている場

The Red Dragons Support and Resistance Levels indicator automatically determines support and resistance levels using the proprietary algorithm based on historical and current data, so the levels are dynamic, which allows you to adjust trading targets based on the current price movement. For this reason, we use this indicator in our advisors, for example, Red Dragons, which you can purchase here:
https://www.mql5.com/en/market/product/128713?source=Site +Market+MT4+New+Rating006
The panel also
FREE

SimpleProb: あなたの新しい金融市場の味方! 説明 複雑なインジケーターに振り回されていませんか? SimpleProb は、MetaTrader 4 での取引をよりシンプルかつ効率的にするために設計されたインジケーターです! SimpleProb は、過去 14 期間の価格動向を分析し、上昇 ( CALL ) と下降 ( PUT ) の確率を計算します。チャート上に明確な視覚的シグナルを表示し、売買の判断をサポートします。 どのように機能するのか? シンプルな確率計算 : 過去 14 期間の価格を分析し、上昇・下降の確率を算出。 視覚的シグナル : 緑の矢印 : 高確率の買いシグナル。価格の下に表示され、買いのチャンスを示します。 赤の矢印 : 高確率の売りシグナル。価格の上に表示され、売りのタイミングを示します。 統計ボックス : チャート上にリアルタイムの確率を表示。ボックスの位置は自由に調整可能で、分析をより便利にします。 なぜ SimpleProb を選ぶべきなのか? シンプルな操作性 : 初心者でも簡単に理解し、使いこなせる設計。 高精度 : 信頼性のある統計計算

取引戦略を向上させるBig Candle Scanner Dashboard MT4は、複数の通貨ペアとタイムフレームで大型の強気および弱気キャンドルを特定する強力なマルチアセットダッシュボードで、潜在的なモメンタムシフトやボラティリティサージを示します。1990年代にSteve Nisonによる日本キャンドルチャートの先駆的な研究を通じて普及したクラシックなキャンドル分析に基づいて構築されたこのツールは、大きな価格変動を活用しようとする外汇と暗号トレーダーに必須です。急速に変化する市場でトレンドの開始、ブレイクアウト、または反転を検出するために広く使用されており、大型キャンドルは主要なトレンドに先立つことが多く、早期エントリーポイント、高ボリューム確認によるリスク管理の向上、自動スキャンによるスクリーンタイムの削減といった利点を提供します—スカルパー、デイトレーダー、スイングトレーダーに最適で、外汇ペア、指数、金 (XAUUSD) などの商品、BTCUSDなどの暗号通貨に適しています。 Big Candle Scanner Dashboard MT4は、重要なキャンドルのリアルタイ

“Gold Miner Robot” is a very powerful AI-Based robot designed and built to accurately analyze the market and trade on gold. Developed by “Keyvan Systems” after more than 3 years of research and development on each tick of the gold chart. "Gold Miner Robot" uses a complex algorithmic approach based on price analysis, trend analysis. We have also provided two other personalized indicators called "GoldMinerRobot SI 1" and "GoldMinerRobot SI 2" for better market analysis, which you can download free
FREE

"GoldMinerRobot SI 2" is an indicator that is not displayed, but is one of the most important analytical arms of "GoldMinerRobot". This indicator is free. You can find more information about how this indicator works in the section "MQL5 Market" and section "Experts" and "GoldMinerRobot". "Gold Miner Robot" is specially designed and built for trading on gold (XAUUSD) in MetaTrader 4.
FREE

EARLY REMINDER: The Starting price is 65 price will rise soon up to 365$ and then 750$ after first 10 copies of sales. Grab this offer now! Introduction
Hello, traders! Welcome to the demonstration of the Forex Beast Indicator , a comprehensive tool designed to assist aspiring traders in navigating the complexities of the forex market. This indicator incorporates seven essential components to provide a well-rounded trading experience: Moving Averages Colored Zones Support and Resistance Levels

Two line MACD index composition MACD line (express line) : Usually calculated by subtracting the 12-cycle EMA from the 26-cycle EMA, it is more sensitive to price changes, can quickly reflect the change of the recent price trend, its fluctuation is relatively frequent, used to capture the dynamics of short-term market trends. Signal line (slow line) : Generally a 9-cycle EMA of the MACD line, its role is to smooth the MACD line, filter out some short-term noise and false signals, make the indic

AI Supertrend timely alerts
MT4 Super Trend timely reminder indicator introduction I. Overview of indicators The MT4 Super Trend Alert Indicator is a technical analysis tool specifically designed for the MetaTrader 4 platform to help traders accurately capture changes in market trends and send timely signals to alert traders to potential trading opportunities. It is based on a unique AI-based algorithm that takes into account factors such as price volatility, trend strength, and market volatil

MT4 platform AI T3 MA Super Fill indicator use introduction I. Overview of indicators
The AI T3 MA Super Fill indicator is a powerful analytical tool that combines advanced algorithms and T3 moving average technology to provide traders on the MT4 platform with accurate market trend judgments and trading signals. It uses intelligent algorithms to deeply process the price data, and displays the changes of the T3 moving average in a unique way to help traders more effectively grasp the market dyn
MT4CandleTime index introduction
MT4CandleTime is an indicator for the MT4 platform, which can display the remaining time of the current K line in the form of an intuitive digital countdown, which is convenient for traders to grasp the trading rhythm.
Precise time control: The MT4CandleTime indicator provides traders with extremely accurate K-line remaining time data, enabling them to fine manage the time rhythm in the trading process, avoiding the hasty or delayed trading decisions caused by
Introduction to the use of MT4 platform AI Color Gradient Volume indicators I. Overview of indicators
AI Color Gradient Volume is an innovative volume analysis indicator based on artificial intelligence technology for the MT4 platform. By converting the volume data into an intuitive color gradient graph, it helps traders to have a more acute insight into the inflow and outflow of funds in the market and the strength of the buying and selling forces, so as to provide strong support for trading

The indicator displays support and resistance zones defined logically using the MACD. The entire concept is explained in the video, with specific examples shown. The indicator works on any instruments and timeframes. It does not repaint.
After placing it on the chart, please go through all the timeframes sequentially, from monthly to 1-minute, so that all lines load correctly. After that, you can start using it.
The concept is unique and has not been seen in other systems or indicators.

The Pure Price Action ICT Tools indicator is designed for pure price action analysis, automatically identifying real-time market structures, liquidity levels, order & breaker blocks, and liquidity voids. Its unique feature lies in its exclusive reliance on price patterns, without being constrained by any user-defined inputs, ensuring a robust and objective analysis of market dynamics. Key Features Market Structures A Market Structure Shift, also known as a Change of Character (CHoCH), is a pivot

AI Pearson Trend!!
My name is Murat Yazici. I am a PhD candidate in Statistics.
I have several papers, writing books, book chapter studies, and several conference presentations and experiments about analytical modeling. About me: https://tinyurl.com/pjejextx The AI Pearson Trend indicator is a novel trend-based indicator including Fuzzy statistical modeling.
You can use it on all currencies and timeframes, not including M1 timeframes.
For best performance, check a trend to see if it is the sam
This custom trading indicator utilizes the Average True Range (ATR) to identify buy and sell opportunities based on price movement. It can optionally employ Heikin Ashi candles to reduce noise and produce smoother signals. The indicator is optimized for use on a 1-hour timeframe and is designed for long-term trading strategies. Works best with symbols: AUDUSD, EURUSD, USDJPY, GBPUSD, US500, US30, XAUUSD, BNBUSD Configure Settings : Configure Settings : Set KeyValue to 9.0 . Set ATRPeriod to 11 .
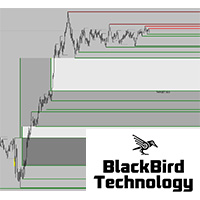
New market liquidity indicator, more accurate with two levels, will really unhide the "hidden agenda" of the price action in any timeframe. Forget all other indicator and use what professional traders are using ! For more information about market liquidity, a manual on how to use this indicator please send me a message.
A lot of information can be found on the net. (search liquidity trading/ inner circle trader)
https://www.youtube.com/watch?v=yUpDZCbNBRI
https://www.youtube.com/watch?v=2LIad2
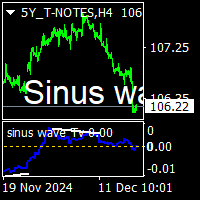
Sinus wave Tv indicator is a extra ordinary oscillator.to find divergency. For mt4 and Tradingview pine script purchased people, after installed on terminal ,contact me on mql5 to get BONUS TradingView pinescript.
it works all pairs and all timeframes. suitable for experienced and beginner traders.. indicator works on toward of the prices... while sinus wave go up side that means prices will up. and while sinus wave go down that means prices is going down. it gives divegency when trend rever

Wave Trend Pro: Market Trend Analysis Tool Key Features Smart Signal Analysis Provides structured BUY/SELL signal insights Helps detect potential trend reversals Assists in exit point identification Offers real-time market condition tracking Advanced Visual Analytics Color-coded trend strength representation Dynamic trend momentum evaluation Market volatility tracking system Noise reduction filtering for clarity Performance Benefits Designed for efficient signal processing Developed to improve

1.Indicator gives key trade levels with red and green arrows. 2. You need to manually mark these trade levels on higher time frame with horizontal line or area and take the trades based on price action on lower timeframe at these trade levels. For example, see rejection or violation of these trade levels to go along or reverse the trade. (See attached screenshot) 3. You need to manually turn off signals for lower timeframes you comfortable working with. 4. Please note that you need to manually

Special offer : ALL TOOLS , just $35 each! New tools will be $30 for the first week or the first 3 purchases ! Trading Tools Channel on MQL5 : Join my MQL5 channel to update the latest news from me Supertrend Fakeout インジケーターは、従来の Supertrend インジケーターを改良したバージョンで、より信頼性の高いトレンドシグナルを提供することを目的としています。 Fakeout Index Limit や Fakeout ATR Mult といった高度な機能を取り入れることで、このインジケーターは短期的な価格変動や市場ノイズによって引き起こされる誤ったトレンド反転をフィルタリングするのに役立ちます。 MT5バージョンを見る: Supertrend Fakeout MT5 その他の製品を見る: すべての製品 動作の仕組み Supertr
FREE

After your purchase, feel free to contact me for more details on how to receive a bonus indicator called VFI, which pairs perfectly with Easy Breakout for enhanced confluence!
Easy Breakout is a powerful price action trading system built on one of the most popular and widely trusted strategies among traders: the Breakout strategy ! This indicator delivers crystal-clear Buy and Sell signals based on breakouts from key support and resistance zones. Unlike typical breakout indicators, it levera
Special offer : ALL TOOLS , just $35 each! New tools will be $30 for the first week or the first 3 purchases ! Trading Tools Channel on MQL5 : Join my MQL5 channel to update the latest news from me Breakaway Fair Value Gaps (FVG) ツールは、トレーダーが価格がバランスから逸脱した領域を特定し、修正の可能性に関する詳細な洞察を提供するために設計された最先端のソリューションです。このツールは重要なシグナルを強調するだけでなく、意思決定の精度を向上させるための高度な機能も含まれています。 MT5バージョンはこちら: Breakaway Fair Value Gaps MT5 その他の製品を見る: すべての 製品 Breakaway FVGの主な特徴 1. Breakaway Fair Value Gapとは何ですか? 定義:
Bre
Special offer : ALL TOOLS , just $35 each! New tools will be $30 for the first week or the first 3 purchases ! Trading Tools Channel on MQL5 : Join my MQL5 channel to update the latest news from me Kalman Trend Levels は、先進的なカーマンフィルター技術を活用し、トレーダーに強力な分析信号を提供する高度なトレンド追従インジケーターです。正確さと適応性を追求したこのツールは、重要なサポートおよびレジスタンスゾーンを特定するだけでなく、市場のモメンタムやトレンド変化を包括的に分析する手法を提供します。 MT5バージョンはこちら: Kalman Trend Levels MT5 その他の製品はこちら: All Products See more detailed explanation of Kalman Filter logic in this

The ABC Indicator analyzes the market through waves, impulses, and trends, helping identify key reversal and trend-change points. It automatically detects waves A, B, and C, along with stop-loss and take-profit levels. A reliable tool to enhance the accuracy and efficiency of your trading. This product is also available for MetaTrader 5 => https://www.mql5.com/en/market/product/128178 Key Features of the Indicator:
1. Wave and Trend Identification: - Automatic detection of waves based on mov

Moving average alert plus is an advance moving average alert that will easily monitor the price action based on set moving averages to multiple open charts. Objective: To monitor multiple open charts and notify traders conveniently in a single display panel when using the moving averages to enter/exit a trade. Features: Monitor price action in two timeframes at the same time Supports simple, exponential, smoothed, linear weighted moving averages Trigger an alert based on candle size (full/

Hello, I need reviews from you guys. Thank you Fractal Swing Detector Pro Indicator is designed to help traders identify key swing points in the market . By combining fractal an d pivot analysis, this indicator provides deeper insights into price movements an d potential reversals. Key Features: Fractal Analysis: Identify high and low fractals with the option to use either 3 or 5 bar fractals . Fractals help detect minor reversal points within trends. Pivot Points: Advance d pivot
FREE

The Breakaway Fair Value Gap (FVG) is a typical FVG located at a point where the price is breaking new Highs or Lows.
USAGE Figure 1 In the figure 1, the price range is visualized by Donchian Channels.
In theory, the Breakaway FVGs should generally be a good indication of market participation, showing favor in the FVG's breaking direction. This is a combination of buyers or sellers pushing markets quickly while already at the highest high or lowest low in recent history. Figure 2 Whi

Super Scalp Indicator MT4 is a unique trend reversal 100% non-repainting multi-algo indicator that can be used on all symbols/instruments: forex, commodities, cryptocurrencies, indices, stocks . Super Scalp Indicator MT4 will determine the current trend at its early stages, gathering information and data from up to 10 standard algos When indicator give a valid buy or sell signal, a corresponding arrow will be printed on the chart, open trade at start of the next candle/bar

This product enables you to trade in opportunities that are detected by the indicator. Using advanced Calculations and formulae this product enables you to profit from trend opportunities. Trend master has Channels that show areas the trend is strong and you are likely to profit. Once this zone Is breached the price is on in uncertain territory and there is no guarantee the trend will continue This means there might be reversal and it is advisable to exit a trade here.

Do you want to beat the market? This indicator uses advanced mathematical formulae That include regression analysis to predict market trends. So what happens is That when the price is above the indicator line as depicted in the screenshot The trend is rising and when the price is below the indicator line the Trend is falling. This opportunities appear multiple times each day enabling You to profit. This indicator makes the trend your friend.
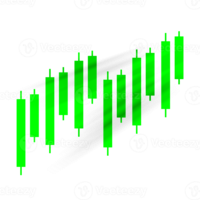
Bollinger trading is an indicator for mt4 that uses Bollinger bands and other trend following strategies To detect the direction of the market. Just as attached in the screenshot the light blue line shows areas The market is rising. This means opening positions here is in the direction of the trend. The dark blue lines cane be used for sell trades when the market moves in the opposing direction. Using this tactics you can have a clear sense of where the market is headed.

This product works by detecting trend opportunities. So as shown in the screenshot when The indicator shows an upward arrow it shows the market is on an uptrend and when the indicator Shows a downward arrow it shows the market is on a downward direction. What makes this indicator Special is that it has additional signals just below the arrow signals. It is up to the trader to be Creative and combine these signals with the arrow signal to get accurate forecasts.
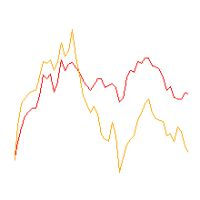
Line1: simple calculation of change in closing price for the chosen input period - named Velocity. Line2: simple calculation of change in velocity for the chosen input period - named Acceleration. Feel free to play with the input periods to find a profitable combination. For faster results it is best to do it in MT Optimizer. Can assist in either manual or automatic trading.

Manh RSICrossingAlert with Alert Indicator is a versatile technical analysis tool that aids traders in identifying market trends and potential entry and exit points. It features a dynamic Manh RSICrossingAlert , adapting to market conditions for a clear visual representation of trend direction. Traders can customize parameters to align with their preferences and risk tolerance. The indicator assists in trend identification, signals potential reversals, serves as a trailing stop mechanism, and p

Best Divergence Indicator for advanced traders without distraction of lines or arrows. It is not a magic blackbox for novice traders rather a great tool for experienced traders to decide their entry and exit. Can be used for most of the Forex pairs, Gold, Oil, Crypto. Flexibility to play with input to customize ur unique research too. Therefore, I will suggest turning off arrows and divergence line to reduce clutter and instead use the following advice: For sell on divergence indicator start tu

Special offer : ALL TOOLS , just $35 each! New tools will be $30 for the first week or the first 3 purchases ! Trading Tools Channel on MQL5 : Join my MQL5 channel to update the latest news from me Volumatic VIDYA (Variable Index Dynamic Average) は、トレンドを追跡し、トレンドの各フェーズ内での買い圧力と売り圧力を分析するために設計された高度なインジケーターです。可変インデックス動的平均 (Variable Index Dynamic Average) をコアの動的平滑化技術として利用することで、このツールは、価格とボリュームのダイナミクスに関する重要な洞察を、市場構造の重要なレベルで提供します。 MT5バージョンを見る: Volumatic VIDyA MT5 他の製品を見る: 全製品 To use iCus
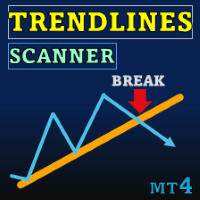
Special offer : ALL TOOLS , just $35 each! New tools will be $30 for the first week or the first 3 purchases ! Trading Tools Channel on MQL5 : Join my MQL5 channel to update the latest news from me Trendlines with Breaks Scanner は、トレーダーが重要なトレンドを特定し、リアルタイムでブレイクアウトを検出するのを支援するために設計された最先端の取引ツールです。ピボットポイントに基づいて自動生成されたトレンドラインを使用することで、このインジケーターはトレーダーが精度と自信を持って取引の機会を活用できるようにします。 MT5バージョンを見る: Trendlines with Breaks Scanner MT5 他の製品を見る: All Products 主な機能 1. リアルタイムのブレイクアウト検出 ブレイクアウトアラート: 価

Upper and Lower Reversal - 反転の瞬間を早期に予測するシステム。上限と下限の価格変動チャネルの境界にある価格の転換点を見つけることができます。
インジケーターの色が変わったり、信号矢印の位置が変更されることはありません。 赤い矢印は買いシグナル、青い矢印は売りシグナルです。
あらゆる時間枠と取引商品に調整します インジケーターは再描画されず、ローソク足が閉じるときにのみ機能します。 信号のアラートにはいくつかの種類があります このインジケーターは使いやすく、構成可能な外部パラメーターは 2 つだけです。
Channel Length - シグナルが構築される価格チャネルの長さを調整します。 Signal Normalization - シグナル矢印の品質レベルを変更します。パラメーターが高くなるほど、誤ったシグナルが減少します (BTC、ゴールド、および揮発性の高い商品では数桁変化します)。 Alerts play sound / Alerts display message / Alerts send notification / Send emai
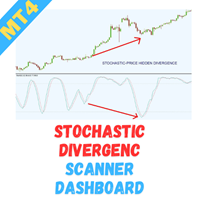
MT4用 Stochastic Divergence Multicurrency Scanner Dashboard は、複数の通貨ペアと時間足にわたって、ストキャスティクスの強気および弱気のダイバージェンスシグナルを効率的に検出するために設計された高度なツールです。リアルタイムスキャンと集中型ダッシュボードからのアラートを提供することで、潜在的な市場反転を特定するプロセスを簡素化します。主要通貨ペア、マイナーペア、エキゾチック通貨のいずれを取引する場合でも、このスキャナーは柔軟なカスタマイズオプションと広範な市場カバレッジを提供します。履歴シグナルの確認、チャート間のスムーズな移動、個人戦略に合わせた設定調整が可能で、手動によるチャート監視なしに情報に基づく意思決定をサポートします。市場の動きを先取りし、積極的なトレーダー向けに設計されたツールでエントリーを微調整しましょう。 主な機能 手間のかからないマルチカレンシースキャン:複数の通貨ペアをリアルタイムで監視し、チャートを切り替えることなくストキャスティクスダイバージェンスパターンを即座に検出。 包括的なダッシュボード概要:直感的
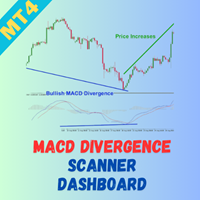
MACD Divergence Multicurrency Scanner Dashboard for MT4は、複数の通貨ペアと時間枠でMACDダイバージェンス信号を識別するための強力なツールです。リアルタイムでスキャンとアラートを提供することで、市場の反転の可能性を簡単に見つけるプロセスを簡素化します。主要通貨ペア、マイナー通貨ペア、またはエキゾチック通貨ペアを取引している場合でも、このスキャナーは広範な市場カバレッジと柔軟な設定オプションを提供します。ユーザーが過去の信号を確認し、簡単にチャート間を移動し、個々の戦略に基づいて設定をカスタマイズできるようにすることで、このスキャナーは手動で各チャートを監視する必要なしに効率的で情報に基づいた意思決定をサポートします。市場の動きに先んじて、真剣に取引するために作られた簡素化されたツールでエントリーを最適化しましょう。 主な機能 効率的な多通貨スキャン: 複数の通貨ペアをリアルタイムで監視し、グラフを切り替えることなく、MACDダイバージェンスパターンを即座に検出します。 包括的なダッシュボード: 直感的でクリーンなダッシュボードで、

未来の取引を発見しよう - Golden Arrow Scalper! 著名なFelipe FXによって開発されたEasy Entry Pointsは、直感的で効率的な取引体験を提供する次世代の取引指標です。先進的な機能とユーザーフレンドリーなインターフェースを備えており、どのレベルのトレーダーにも最適なツールです。 主要機能: 簡単な入口信号: 速いと遅いEMAのクロスを基に理想的な入口点を特定し、取引の正確さとタイミングを確保します。 音声アラート: EMAのクロスに対するリアルタイムの通知を音声で設定し、市場の変化に迅速に反応できるようにします。 完全なカスタマイズ: 速いと遅いEMAの設定をトレーディングスタイルや特定の戦略に合わせて調整します。 明確なビジュアル: 異なる色(SeaGreenとRed)を使用してEMAのクロスを簡単に視覚化し、迅速かつ情報に基づいた意思決定を容易にします。 最適化されたパフォーマンス: Easy Entry Pointsは、どの取引プラットフォームでも高速かつ効率的に動作するように設計されています。 なぜEasy Gold
MT4用Binary exfishインジケーター Binary exfish インジケーターは、バイナリーオプション取引のために設計されており、 M1 および M5 タイムフレームに対応しています。どの通貨ペアでも動作し、トレンドを分析し、チャート上に矢印としてエントリーシグナルを表示します: 青い矢印 — 買いシグナル 赤い矢印 — 売りシグナル 特徴: デフォルトの有効期限 :1本のローソク足 調整可能な有効期限:1〜3本のローソク足 シグナルは現在のローソク足が確定する前に表示され、迅速な意思決定をサポートします。 サウンド通知、ポップアップ、メール、モバイルアプリの通知をサポート。 インストールと使用方法: 正常に動作させるには、 MQL5 フォルダ をダウンロードしてMT4ターミナルフォルダに配置してください。 インストールガイドはこちらをご覧ください: 動画リンク 。 ポップアップ通知を受け取るには、追加のインジケーターを使用してください: ダウンロード は こちら 。 Binary exfish インジケーターは、トレンドベースの取引に最適で、正確かつ明確なシグナルを提供

Scalper Boss は、多層的なロジックフレームワークを通じて市場状況を評価し、最適なエントリーポイントとエグジットポイントを特定するために設計された先進的な分析ツールです。変化する市場環境に適応し、明確な視覚的なシグナルやトレンドラインを提供します。その主な価値は、市場のノイズをフィルタリングし、意味のある動きを捉える能力にあり、特にスキャルピングや日中取引に有用です。 Scalper Boss は利益を保証するものではありませんが、その強力な構造により、特にボラティリティが高い市場やレンジ相場において、トレーダーが市場をより深く理解する手助けをします。 インジケーターの利点 多層分析: 移動平均線の交差とトレンドラインを組み合わせ、市場を包括的に分析。 高精度: 市場レンジの分析を通じてノイズをフィルタリングし、誤ったシグナルを削減。 柔軟性: カスタマイズ可能なパラメーターにより、あらゆる金融商品や取引スタイルに適応。 使いやすさ: 矢印やトレンドラインなどの明確な視覚要素により、シグナルの解釈が簡単。 汎用性: スキャルピング、日中取引、中期取引戦略にも適応可能。 インジ
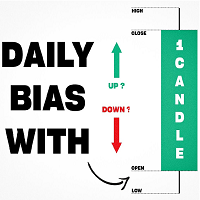
Inspired by TTrades video on daily bias, this indicator aims to develop a higher timeframe bias and collect data on its success rate. While a handful of concepts were introduced in said video, this indicator focuses on one specific method that utilizes previous highs and lows. The following description will outline how the indicator works using the daily timeframe as an example, but the weekly timeframe is also an included option that functions in the exact same manner.
On the daily timefr
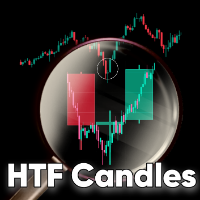
HTF Candles MT4 is a mt4 indicator which plots the outline of the higher time-frame candles on the lower candle, including any MT5 higher time-frame chosen. The indicator gives you the option to choose whether or not to view live current HTF candle, with no lag or repainting. Features MT5 Period Candles: This indicator plots any mt5 time-frame candle e.g m3, m5, m12, m15, m20... and so on, on the lower time-frame. Heiken Ashi Options: You have the option to view the HTF Heiken ashi instead of
MetaTraderマーケットは自動売買ロボットとテクニカル指標を販売するための最もいい場所です。
魅力的なデザインと説明を備えたMetaTraderプラットフォーム用アプリを開発するだけでいいのです。マーケットでプロダクトをパブリッシュして何百万ものMetaTraderユーザーに提供する方法をご覧ください。
取引の機会を逃しています。
- 無料取引アプリ
- 8千を超えるシグナルをコピー
- 金融ニュースで金融マーケットを探索
新規登録
ログイン