YouTubeにあるマーケットチュートリアルビデオをご覧ください
ロボットや指標を購入する
仮想ホスティングで
EAを実行
EAを実行
ロボットや指標を購入前にテストする
マーケットで収入を得る
販売のためにプロダクトをプレゼンテーションする方法
MetaTrader 4のための新しいテクニカル指標 - 41

Turbo Trend technical analysis indicator, which determines the direction and strength of the trend, and also signals a trend change. The indicator shows potential market reversal points. The indicator's intelligent algorithm accurately determines the trend. Uses only one parameter for settings. The indicator is built for simple and effective visual trend detection with an additional smoothing filter. The indicator does not redraw and does not lag. Take profit is 9-10 times larger than stop loss

Trends are like the "Saint Graal of traders": it can give you an higher win rate, a better risk to reward ration, an easier position management and so on...
But it is really hard to determine the trend with accuracy, avoiding fase signals, and with the right timing, in order to take massive movements. That's why I created the Trend Validator: a new and EASY tool that will make identifying trend and build new strategy a really easier work.
ANATOMY OF THE SOFTWARE
The indicator is composed by 3
FREE

This indicator identifies and displays zones, as it were areas of strength, where the price will unfold. The indicator can work on any chart, any instrument, at any timeframe. The indicator has two modes. The indicator is equipped with a control panel with buttons for convenience and split into two modes. Manual mode: To work with manual mode, you need to press the NEW button, a segment will appear. This segment is stretched over the movement and the LVL button is pressed. The level is displayed

The " Unforgettable Trend " indicator is a hybrid trend indicator that combines signals from elementary indicators with a special analysis algorithm. Its main task is to show the moments most favorable for entering the market, based on the current trend.
Main characteristics:
Algorithm and noise filtering: The indicator works as the main tool for determining the current trend in the market. Built-in intelligent algorithm allows you to filter out market noise and generate accurate input signal

FOTSI is an indicator that analyzes the relative strength of currencies in major Forex pairs. It aims to anticipate corrections in currency pairs following strong trends by identifying potential entry signals through overbought and oversold target areas. Theoretical Logic of Construction: Calculation of Individual Currency Momentum: FOTSI starts by calculating the momentum for each currency pair that includes a specific currency, then aggregates by the currency of interest (EUR, USD, GBP, CHF,

The Trend Prior indicator ignores sharp fluctuations and market noise and tracks market trends. Suitable for trading on small and large time frames, it ignores sudden price jumps or corrections in price movements by reducing market noise around the average price value. The indicator works on all timeframes and currency pairs. The indicator gives fairly accurate signals and is commonly used in both trend and flat markets. It is advisable to use the indicator in conjunction with other tools for m
This indicator is based on the work of legendary trader William Gann, specifically using mathematical models and data from past days. It calculates potential time for a reversal based on selected parameters for the current day. The time is displayed in the future, at the opening of the day and does not change thereafter. The indicator also includes alerts when potential reversal time approaches. An algorithm for possible price movement is built into the indicator. When the time comes, an alert i

The trading indicator we've developed analyzes real-time price action to identify bullish or bearish trends in the financial market. Using advanced algorithms, the indicator automatically plots an upward line when it detects a bullish trend and a downward line in the case of a bearish trend. These lines provide traders with a quick and clear view of the potential direction of market movement, helping them make informed decisions in their trades. Each time a new candle forms on the chart, the ind
Description of work The MA7 Aster indicator is based on the standard Moving Average indicator. Shows the price deviation from the moving average. Detailed information about the MA7 Aster indicator.
Indicator settings General settings: Period ; Method ; Apply to ; Minimum distance – minimum distance from the moving average to the closing price of the candle.
Message settings: Send message to the terminal (Alert) – permission to send messages to the terminal using the Alert function; Send messag
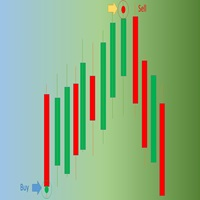
Wave_Entry_Alerts_In_EUR.mq4 is a custom indicator developed by Azad Gorgis for MetaTrader 4. This indicator is designed to provide alerts based on ZigZag patterns, specifically tailored for trading on the (EUR/USD) symbol.
Key Features: - Chart Window Indicator: The indicator is designed to be displayed on the main chart window. - Arrow Signals: The indicator generates arrow signals on the chart, indicating potential reversal points based on ZigZag patterns. - Customizable Parameters: Traders
FREE

The UNIVERSAL DASHBOARD indicator will eliminate the need of using dozens of indicators on dozens of charts. From one place you can monitor all the pairs and all the timeframes for each of the following indicators: MACD STOCHASTIC WPR RSI CCI You can also use any Custom indicator in the dashboard as long as it has a readable buffer. With a single click you can quickly navigate between charts, pairs and timeframes. Alerts will provide clear indication about what happens for your favorite pairs on
FREE
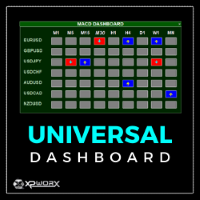
The UNIVERSAL DASHBOARD indicator will eliminate the need of using dozens of indicators on dozens of charts. From one place you can monitor all the pairs and all the timeframes for each of the following indicators: MACD STOCHASTIC WPR RSI CCI You can also use any Custom indicator in the dashboard as long as it has a readable buffer. With a single click you can quickly navigate between charts, pairs and timeframes. Alerts will provide clear indication about what happens for your favorite pairs on

The Ultimate Indicator For Trading Trend This indicator clearly shows you the strength of the market in one direction or the other, which means that you can trade knowing you are either with or against the market. When used in conjunction with the +3R principles you are sure to have some serious results. The +3R Principles Routine - This is when you trade and how often Rules - This is the rule you follow Risk:Reward - This is the percentage amount of your account which is at risk Whether you t
FREE

RiKen — Technical Analysis Indicator for Market Observation and Signal Support RiKen is a technical analysis indicator developed to assist traders in analyzing market behavior , offering structured visual references that support decision-making. Designed as a complementary analytical tool, RiKen helps users observe potential price movements, momentum shifts, and contextual entry or exit zones when combined with a broader trading strategy. Rather than guaranteeing results or outcomes, RiKen focus

カスタムMT4インジケーターで外国為替取引を成功させるための秘密を発見してください!
Strategy with RangeBars https://youtu.be/jBaDCAPTtHc
外国為替市場で成功を達成し、リスクを最小限に抑えながら一貫して利益を得る方法を疑問に思ったことはありますか? これがあなたが探している答えです! 取引へのアプローチに革命をもたらす独自のMT4インジケーターを導入できるようにします。
ユニークな汎用性
私たちのインジケータは、RenkoとRangeBarのろうそくのフォーメーションを好むユーザー向けに特別に設計されています。 これらのチャートタイプは多くの経験豊富なトレーダーに好まれていることを理解しています。そのため、私たちのインジケーターはそれらとシームレスに統合され、比類のない市場分析を提供します。
クリアトレンドシグナル
複雑な分析を忘れてください! 私たちのインジケーターは、鮮やかな色と明確なドット構造を利用して、市場の動向を明確に示しています。 赤と青の点は、価格の動きの方向性について疑いの余地がなく、取引の迅速な意思決定を可能に
トレーダーの皆様、こんにちは。
私の最高の取引ツールを紹介します。
機動部隊 PPAAF モデル T.
マルチタイムフレーム 正確なプライスアクションアローフィルタリングされたモデル T。
この取引ツールは、長年さまざまな取引ツールを作成してきた私の最高傑作です。
なぜこの取引ツールが最高で信頼できるのでしょうか?
1. このツールは 6 つのインジケーターを使用します。
ダブル CCI = 高速 CCI x 低速 CCI デュアル ストキャスティクス = 高速ストキャスティクス (高速ストキャスティクス メイン ライン x 高速ストキャスティクス シグナル ライン) & スロー ストキャスティクス (低速ストキャスティクス メイン ライン x 低速ストキャスティクス シグナル ライン) デュアルMACD = 高速MACD (高速MACDメインライン x 高速MACDシグナルライン) & スローMACD (低速MACDメインライン x 低速MACDシグナルライン) 6 つの移動平均 = MA 1 x MA 2 、MA 3 x MA 4 および
Top Bottom Tracker は、洗練されたアルゴリズムに基づき、市場のトレンドを分析し、トレンドの高値と安値を検出することができるインジケーターです / MT5バージョン 。
価格は500$に達するまで徐々に上昇します。次の価格 --> $99
特徴 リペイントなし このインジケーターは
新しいデータが到着してもその値を変更しません
取引ペア すべてのFXペア
時間枠 すべての時間枠
パラメーター ==== インジケータの設定
設定パラメータ // 40 (値が高いほど、シグナルは少なくなりますが、より正確です)
上レベル値 // 80 (上水平線の値)
下限値 // 20 (下限水平線の値)
インジケータ計算バー // 3000 (何本分のインジケータを計算するか。0を指定すると、全てのバーに対してインジケータを計算します)
==== アラーム設定
ポップアップアラート // true (端末にアラームを表示)
メールアラート // true (アラームをメールで通知)
アラート時間間隔 // 10 (アラーム間隔 (分))
警告

7年の歳月を経て、私のインジケーターとエキスパートアドバイザー(EA)を無料で公開することにしました。
役立つと感じたら、 5つ星の評価でサポートしてください!あなたのフィードバックが私を動かし、無料ツールの提供を続けさせます。 私の他の無料ツールも こちら からご覧ください。
_________________________________ 「RSI with Bands」インジケーター - より良い取引判断 「RSI with Bands」インジケーターは、クラシックなRSIにシンプルなバンドを組み合わせ、売買のタイミングをより明確に示します。市場でのエントリーとエグジットの最適なタイミングを見極めるように設計されています。 主な利点: 精密な過買い・過売り分析 : バンドを加えることでRSIを強化し、市場の極端な状態を明確にし、誤ったシグナルの一般的な落とし穴を避けます。 明確なシグナル : 価格が高すぎるか低すぎるかを簡単に見極め、取引の判断ができます。 タイミングの改善 : 通常のRSIに追加情報を加えるバンドによって、取引の適切な瞬間
FREE
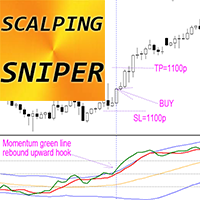
Crypto_Forex インジケーター SCALPING SNIPER for MT4、リペイントなしのトレーディング システム。 スキャルピング スナイパー - 正確な価格モメンタムを示す高度なシステム (インジケーター) です。
- MT4 のプロフェッショナルなスキャルピング スナイパー インジケーターを使用して、トレーディング メソッドをアップグレードします。 - このシステムは非常に正確ですが、まれなスナイピング シグナルを提供し、勝率は最大 90% です。 - システムは、1 ペアあたりのシグナル数の少なさを補うために、シグナルの検索に多くのペアを使用することを想定しています。 - スキャルピング スナイパーは、次の要素で構成されています。 - トップとボトムのボラティリティ ライン (青色)。 - ミドル ライン (オレンジまたは黄色) - 主要なトレンドを示します。 - シグナル方向ライン (赤) - ローカル トレンドの方向を示します。 - 70 レベルを超える領域 - 買われすぎゾーン (そこでは買わないでください)。 - 30 未満の領域 - 売られすぎゾー

人工知能(AI)を用いて、生物の目に見える行動パターンを傾向分析に取り込むために作成。 カオス理論は移動平均と出会う。 イソギンチャクに餌を与えるフィルターは、その蔓を伸ばして栄養の海に出し、自分自身を豊かにします。 私は過度に長い説明であなたの時間を無駄にしません、概念はこれらの用語で理解できます。 そのカスタマイズ可能な期間回転移動平均は、あなたが指定した時間入力で、単純、指数、加重、平滑化の間で切り替わります。 ローテーションはセミカオスであり、市場自体によって注入されたランダム性です。 これらのMAを積み重ねると、イソギンチャクのフィルターが巻きひげを環境に伸ばして餌を摂るような効果が得られます。
「Scalper M5 システム」は、外国為替市場におけるスキャルピング戦略のために設計された強力なツールです。 最大 95% の精度を持つこのインジケーターは、再ペイントせずに取引を開始するための信頼できるシグナルを提供します。 シンプルかつ効果的なアプローチを採用して短期取引の機会を特定し、あらゆるレベルのトレーダーに適しています。 この指標のアルゴリズムは、価格の勢い、ボラティリティ、市場トレンドなどのさまざまな要因を考慮して、誤ったシグナルを除去し、確率の高い取引設定を提供します。
主な特徴: 非再描画シグナル: Scalper Pro インジケーターの際立った機能の 1 つは、再描画しないシグナルを提供する機能です。 これは、シグナルがチャートに一度表示されると変化しないことを意味し、トレーダーが取引の決定に自信を持てるようになります。 高精度: 最大 95% の精度率を備えた Scalper Pro インジケーターは、トレーダーに高い成功確率を提供します。 高度なアルゴリズムとテクニカル分析技術を利用することで、取引の正確なエントリーポイントを特定し、利益の可能性を最大

Hot option premium - A reliable dial indicator that does not draw and shows accuracy.
The signal appears on the previous candle.
Very easy to set up, select a currency pair and adjust the frequency of signals in the “period” settings.
You can also customize the color of the candle yourself; the default is:
-Blue arrow up signal
-Red arrow down signal
Hot option premium is multi-currency and works on all charts.
A very large percentage of good deals.
The best timeframes are M1-M5. On a l

A simple indicator that automatically highlights all FVGs (Fair Value Gaps) formed on the chart, as well as FVGs on history. It is possible to select colors for FVGs of different directions (long or short), select the time interval, select the color of middle point and you can also choose whether to delete filled FVGs or leave them on the chart (the option is beneficial for backtesting). The indicator can be very useful for those, who trade according to the concept of smart money, ICT, or simply
FREE

Graphic Shapes -using history, it projects four types of graphical shapes at the moment, allowing you to determine the main ranges of price movement in the future, as well as gives an understanding of the main market reversals, while giving entry points by priority!The panel contains three types of figure sizes expressed by timeframes. They allow you to conduct a complete market analysis without using additional tools! The indicator is a powerful tool for forecasting price movements in the forex
FREE

This indicator accurately identifies and informs market reversals and continuation patterns by analyzing and signaling the Three White Soldiers / Three Black Crows pattern. It also offers a "real-time backtesting" panel in the indicator itself in a way that every change made on the indicator parameters will immediately show the user how many signals are occurred, how many take profits and stop losses were hit and, by having these informations, the Win Rate and the Profit Factor of the setup ba

The Positive Trend indicator is very reliable because it is based on moving averages. A feature of Trend Positive is the presence of a signal for entry/exit - the indicator line in a certain color indicates the signals "buy" or "sell". The accuracy of this signal is very high, matching 95% success to 5% failure. Trend Positive is also suitable for exiting a position. The indicator captures the trend almost completely, but during the flat it is necessary to use filters. When entering a positi

Volume indicator Effect Volume , in the Forex market volumes are unique (tick). This volume indicator demonstrates the level of financial and emotional involvement. When the indicator forms a new top, it indicates that buyers are stronger than sellers over a certain period of time. If the indicator decreases, this indicates that the bears are stronger.
Why is it impossible to track normal volumes in Forex? The fact is that this is an over-the-counter market. Consequently, it is practically imp

--- INTRODUCTION ---- This indicator is to measure the strength of BULL and BEAR. The formulars are based on Price Change and Volume for period of time.
---- HOW TO READ ---- GREEN BAR = BULL is stronger than BEAR ----> Strong GREEN = Strong Buying Volume ----> Light GREEN = Weakening Buying Volume (BULL Still in control)
RED BAR = BEAR is stronger than BULL ----> Strong RED = Strong Selling Volume ----> Light RED = Weakening Selling Volume (BEAR Still in control)

For traders, monitoring price movements is a constant activity, because each price movement determines the action that must be taken next. This simple indicator will helps traders to display prices more clearly in a larger size. Users can set the font size and choose the color that will be displayed on the chart. There are three color options that can be selected to be displayed on the chart.
FREE
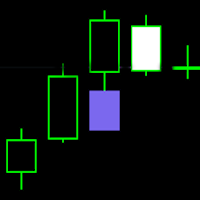
FVG - Fair Value Gap indicator is a three candle pattern indicator . It find inefficiencies or imbalances in market. It act as magnet before continue the trend.
indicator key function
1. No object is used to draw the plot. You can use this to build EA and backtest also.
2. Min and max value to Filter-out the noises .
It use as retest zone and can be use as entry price also. It popular among price action traders. your suggestion and comments are welcome and hopping that you will find this hel

- Real price is 90$ - 50% Discount ( It is 45$ now )
Contact me for instruction, any questions! Introduction V Bottoms and Tops (or Fibonacci Retracement) are popular chart patterns among traders due to their potential for identifying trend reversals. These patterns are characterized by sharp and sudden price movements, creating a V-shaped or inverted V-shaped formation on the chart . By recognizing these patterns, traders can anticipate potential shifts in market direction and posi

Данный индикатор представляет из себя комплекс из 4 индикаторов в правом углу состоящий из RSI,Stochastic,Envelope и MACD, показывающий данные на различных таймфреймах, настройки данных индикаторов вы можете изменить в параметрах, сигналы на вход основан на индикаторах силы быков и медведей, данные сигналы используются и в роботах, скрины прилагаю, желающим, скину бесплатно

Connect Indicator is a tool used for connecting indicators between the MQL market and MT4. The connected indicators are made by our group and can be used for other applications, such as sending messages to the Line application or Telegram application. If you have any questions, please don't hesitate to ask us to receive support. Function and indicator buffer Buffer one is the high price of the previous candle. Buffer two is the high price of the previous candle. Usage To connect indicators to fu
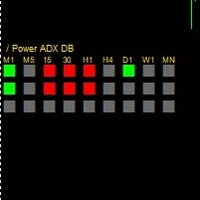
This is a trend indicator based on ADX and some other oscillators, the indicator change colors on strong trend directions, this indicator is most suitable for scalping purposes, if the lower timeframe shows opposite direction to the higher timeframe direction , the move may act as a retracement. And the lower squares of the indicator uses a higher ADX period, upon their change on color move may be exhausted.

レンジと次の動きを特定 | トレンドの最も早いシグナルと強さを得る | 反転の前に明確な出口を得る | 価格がテストするフィボ・レベルを見つける。 非リペイント、非遅延インディケータ - マニュアルおよび自動売買に最適 - すべての資産、すべての時間単位に対応 購入後、あなたの 無料 TrendDECODER_Scannerを取得するために私に連絡してください。 MT5 バージョン: ここをクリック BladeSCALPER と PowerZONES を使った完全な方法を入手する
どのようなものですか?
TrendDECODERは、トレンド監視をシンプルかつ簡単にするための複数のイノベーションを集約したものです。
Projective TrendLine (投影トレンドライン) - 今後のトレンドのスピードリファレンス。
RealTime TrendLine vs. Projective TrendLine (リアルタイムトレンドライン vs. Projective TrendLine) - 市場が同じ方向に加速しているのか、減速しているのか
戦略ゾーン x3、x4、x5回タッチ | TP1/TP2/TP3 ポイント または 値 | リスク/リワード比率の安全性を視覚的に確認 再描画なし、遅延なしのインジケーター - 手動とロボット取引に最適 - すべての資産とすべての時間枠に対応
期間限定オファー その後 >> $99 に戻ります 購入後、 推奨およびカスタマイズ設定のためにお問い合わせください [ バージョン MT5 - MT4 | 勝率を最大化する他の3つのツールを確認: TrendDECODER / PowerZONES / BladeSCALPER ]
概要
当社のインジケーターは初めて、チャート上で 3つの概念 を視覚的に結び付けます: 市場がテストするゾーン テイクプロフィットレベル サポートゾーン(ストップロス)とレジスタンスゾーン(テイクプロフィット)間のリスク/リワード比率
PowerZONES はあなたの取引ルーティンを変え、 衝動的な取引を止める のに役立ちます。
私たちは基本的なサポートとレジスタンスの概念に新機能を追加して革新しました: ゾーン: ラインより

ルールプロッターを使用して自動取引ロボットを作成する方法 マウスの数回のクリックで取引戦略を自動化できるとどれほど強力であるか考えたことがありますか?複雑なコードに没頭する必要なしに、さまざまな取引戦略を作成してテストできる自由を持つことを想像してください。ルールプロッターを使用すると、このビジョンが現実のものとなります。ここでは、ルールプロッターを使用してカスタム取引ロボットを作成する方法を探ってみましょう。これは、取引システムの作成を簡素化するツールです。 ルールプロッターとは何か、そしてどのように機能するか ルールプロッターは、MetaTraderのインジケータを使用してエキスパートアドバイザ(EA)を作成するためのプログラムです。このツールを使用すると、複雑なプログラミングの詳細を理解する必要なく、取引戦略を自動化できます。プロセスは簡単で、必要なインジケータをチャートに追加し、入出力条件を定義し、あとはルールプロッターにお任せください。 プログラミングの知識なしに戦略を自動化 ルールプロッターの主な利点の1つは、そのアクセシビリティです。プログラミングの経験がなくても、Met
FREE

7年の時を経て、私は自分のインディケーターとEAを無料で公開することにしました。
役に立つと思ったら、 5つ星の評価でサポートをお願いします! あなたのフィードバックが無料ツールの提供を続ける励みになります! 他の私の無料ツールや私のライブシグナルも こちら からご覧ください
_________________________________ エングルフディテクター - シンプルなトレーディングインディケーター エングルフディテクターを発見してください。これは、外国為替市場でのエングルフィングパターンを特定するためにMQL4で作成された直感的なツールです。このインディケーターは、潜在的な市場のエントリーやエグジットポイントを強調することで、あなたのトレーディング戦略をより効果的にします。 主な特長: エングルフィングパターン検出 : 強気と弱気のエングルフィングパターンを迅速に特定し、トレーディングの機会を示します。 高度な通知 : エンガルフが検出された際に通知とアラートを送信 使いやすさ ️: あなたのMetatrader 4プラット
FREE

7年の時を経て、私の独自のインディケーターとEA(エキスパートアドバイザー)を無料で公開することにしました。
役立つと感じたら、 5つ星の評価でサポートをお願いします!あなたのフィードバックが無料ツールを提供し続ける動機となります。 他の無料ツールも こちら からご覧ください
_________________________________ フォレックス市場のボラティリティ分析を強化するATRバンド付きインディケーター MQL5で開発されたATRバンド付きインディケーターをご紹介します。この革新的なツールは、平均真のレンジ(ATR)をカスタマイズ可能な上下のバンドと統合し、市場のボラティリティについて詳細な理解を提供します。 主な特徴: ボラティリティの測定 : 市場のボラティリティを正確に測定するためにATRを使用し、市場状況に関する重要な洞察を提供します。 カスタマイズ可能なバンド : ボラティリティの極値と市場のトレンドを視覚化するための調整可能な上下のバンドを特徴としています。 ブレイクアウトとコンソリデーションの検出 : 戦略的な取引決
FREE

スイープパターン 最先端のツールは、弱気トレンドの回転と強気トレンドの回転の両方を比類のない精度で識別するように設計されています。
情報に基づいた取引の決定を下し、市場の一歩先を行くことができます。 MT5バージョン: WH Sweep Pattern MT5 スイープパターンの特徴:
自動的に検出し、さまざまな色とスタイルを使用して、チャート上に弱気と強気のトレンド ローテーションを描画します。 アラート (サウンド、電子メール、プッシュ通知) を送信し、チャート上に矢印を描画するので、取引シグナルを見逃すことはありません。 あらゆる通貨ペア、時間枠、市場状況に対応し、取引武器として多用途で信頼性の高いツールを提供します。 カスタマイズ可能なパラメーターを使用して、インジケーターを特定の取引設定に合わせて調整します。
市場のローテーションに不意を突かれないようにしてください。スイープ パターン インジケーターを使用して取引戦略を強化すると、弱気トレンドの反転または強気トレンドの反転を簡単に見つけることができます。
あなたが経験豊富なトレーダーであろうと、初心者であろうと

導入
マイティ・アリゲーター - 金融市場と個々の証券のトレンドは 15% ~ 30% の確率で推移し、残りの 70% ~ 85% の確率で横ばいに推移するという前提に基づくトレンド追跡指標です。 Mighty Alligator インジケーターは、5、8、13 期間に設定された 3 つの平滑化移動平均を使用します。これらはすべてフィボナッチ数です。 最初の平滑化平均は単純移動平均 (SMA) を使用して計算され、インジケーターの回転を遅くする追加の平滑化平均が追加されます。
その特徴的な機能 ポップアップメッセージ、通知、メールなどのアラート機能を搭載 3 つの移動平均はワニの顎、歯、唇で構成され、進化するトレンドや取引範囲に反応して開閉します。 ジョー (青線) - 13 バー SMMA から始まり、後続の値で 8 バーによって平滑化されます。 歯 (赤い線) - 8 バーの SMMA から始まり、後続の値では 5 バーで平滑化されます。 唇 (緑の線) - 5 つのバーの SMMA から始まり、後続の値で 3 つのバーによって平滑化されます。 インジケーターの設定
ダッシ

TIRED OF HAVING TO CALCULATE THE LOTSIZE EVERY TIME?
This indicator will do it for you, WHATEVER ASSET YOU CHOOSE in 10 seconds !!!
INSTRUCTIONS
The things to do in order to activate this indicator will take around 10 seconds once you understand how to use this indicator properly.
Here are the steps to follow:
Place the indicator on the chart of the asset you want to trade on.
Go to " Inputs ".
Enter where you want to set the stop loss .
Choose risk in $ .
You can also choose whethe
FREE

Master Trend is a complete trading system for day traders, scalp traders and swing traders. The system consists of two indicators. A simple, clear set of rules ideal for both beginners and experienced traders. The Master Trend Strategy helps you to always be on the right side. It helps filter out the strongest trends and prevents you from trading in a directionless market. If the market is too weak or is in sideways phases, then the Magic Band shows different color It works well on all instrume
Description of work The MA7 Hypnum indicator is based on the standard Commodity Channel Index indicator. Shows overbought and oversold zones. Detailed information about the MA7 Hypnum indicator.
Indicator settings General settings: Period ; Apply to ; Upper level ; Lower level .
Message settings: Send message to the terminal (Alert) – permission to send messages to the terminal using the Alert function; Send message to the mobile terminal (Push) – permission to send messages to the mobile term

The Hero Line Trend indicator was developed to help you determine the trend direction by drawing channels on the graphical screen. It draws all channels that can be trending autonomously. It helps you determine the direction of your trend. This indicator makes it easy for you to implement your strategies. The indicator has Down trend lines and Up trend lines. You can determine the price direction according to the multiplicity of the trend lines. For example , if the Down trend lines start to

TG MTF MA MT5 is designed to display a multi-timeframe moving average (MA) on any chart timeframe while allowing users to specify and view the MA values from a particular timeframe across all timeframes. This functionality enables users to focus on the moving average of a specific timeframe without switching charts. By isolating the moving average values of a specific timeframe across all timeframes, users can gain insights into the trend dynamics and potential trading opp
FREE
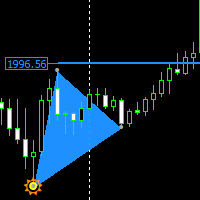
Non-repaint price action pattern based indicator works on all timeframe the indicator is based on a 123 Triangle pattern that happens everyday on the market the indicator will point out the pattern for you and you can turn on Fib level to see your take profit. Blue triangle is a buy signal Red triangle is a sell signal horizonal blue and red lines is an indication to place your trail stop loss one price has reached that area only entry when the triangle has fully formed
RaysFX Trade Info Ciao a tutti, sono entusiasta di presentarvi il nostro ultimo indicatore, RaysFX Trade Info . Questo strumento è stato progettato per fornire informazioni dettagliate sulle vostre operazioni di trading direttamente sul vostro grafico MT4. Caratteristiche principali Informazioni in tempo reale : RaysFX Trade Info fornisce informazioni in tempo reale sulle vostre operazioni aperte e chiuse. Potete vedere il profitto in punti, in valuta e in percentuale. Personalizzabile : L’in
FREE

The product Divergence Mom Stoch Adx Bears Bulls is designed to find the differences between indicators and price. It allows you to open orders or set trends using these differences. The indicator has 4 different divergence features.
Divergence types Class A Divergence Class B Divergence Class C Divergence Hidden Divergence
Product Features and Rec ommendations There are 5 indicators on the indicator Indicators = Momentum Stochastic Adx Bears Bulls 4 different divergence types are used.
FREE

The product Divergence Cci Force Stddev Ac Atr is designed to find the differences between indicators and price. It allows you to open orders or set trends using these differences. The indicator has 4 different divergence features.
Divergence types Class A Divergence Class B Divergence Class C Divergence Hidden Divergence
Product Features and Rec ommendations There are 5 indicators on the indicator Indicators = CCI, Force, Stdandard Deviation, Acelereator, Atr 4 different divergence type
FREE

RaysFX StepMA+Stoch Caratteristiche Principali Adattabilità: Il nostro indicatore RaysFX StepMA+Stoch è progettato per adattarsi alle mutevoli condizioni di mercato. Utilizza l’Average True Range (ATR) per misurare la volatilità del mercato e regolare di conseguenza le sue strategie di trading. Precisione: L’indicatore genera segnali di trading quando la linea minima incrocia la linea media. Questi segnali sono rappresentati come frecce sul grafico, fornendo punti di ingresso e di uscita chiari
FREE

RaysFX Market Trend Histogram Il RaysFX Market Trend Histogram è un indicatore personalizzato per la piattaforma di trading MetaTrader 4. Utilizza il Commodity Channel Index (CCI) per identificare le tendenze del mercato e visualizza queste informazioni in un istogramma intuitivo. Caratteristiche principali: Identificazione delle tendenze: L’indicatore calcola il CCI per ogni periodo di tempo e lo utilizza per determinare se il mercato è in una tendenza al rialzo o al ribasso. Visualizzazione in
FREE

RaysFX MACD Divergence
Presentiamo RaysFX MACD Divergence, un indicatore di trading avanzato progettato per i trader moderni. Questo indicatore utilizza la divergenza MACD, uno dei metodi più affidabili nel mondo del trading, per fornirti segnali di trading precisi e tempestivi. Caratteristiche principali: Divergenza MACD: L’indicatore identifica e traccia le divergenze MACD, fornendo segnali di trading potenzialmente redditizi. Personalizzabile: Puoi personalizzare i parametri dell’EMA veloce,

RaysFX WPR Strategy Indicator RaysFX WPR Strategy è un indicatore di strategia di trading basato sul calcolo del WPR (Williams Percent Range). Questo indicatore utilizza tre lunghezze diverse per il calcolo del WPR e pesa i risultati per fornire un valore complessivo del WPR.
Caratteristiche: - Calcola il WPR utilizzando tre lunghezze diverse (9, 33, 77) - Utilizza un sistema di pesi per combinare i tre valori del WPR in un unico valore - Genera alert in base al numero di alert impostato dall'

HorizonFX — Market Oscillator for Technical Analysis Support HorizonFX is a market oscillator developed to support technical analysis in Forex and other CFD markets. It is designed to help visualize price momentum behavior and volatility context through an oscillator panel and clear visual references on the chart.
Core Features Oscillator with Momentum Representation HorizonFX calculates an internal oscillator line and histogram to represent momentum behavior relative to recent market movement

次の反転のシグナルを受け取る | ゲインレートの統計を最適化する | 価格がテストするゾーンを取得する。 | 非リペイント、非遅延インディケータ - マニュアルおよび自動売買に最適 - すべての資産、すべての時間単位に対応 期間限定キャンペーン >> 50%OFF 購入後、 推奨セッティングについては、このチャンネルで私に連絡してください。 МТ4 - МТ5 バージョン | 利益をより簡単に、迅速に、安全に最大化するために、私たちの global MetaMethod をご確認ください。
切って走れ!
BladeSCALPERを使えば、これらの予測可能なM&Wの動きのほんの一部を切り取ることができるのです! お気に入りのアセットに繋いで、利益を上げて、群衆から逃げましょう。
何のことでしょう?
最も予測しやすいパターンとして、「ダブルトップ」と「ダブルボトム」が挙げられ、文字がこれらのパターンを明示することから、一般的に「M」と「W」と呼ばれています。
BladeSCALPERは、スキャルピングをシンプルかつ簡単にす
Candle_Timer_and_Spread インジケーターは、選択したシンボルのスプレッドとともに、ローソク足の終了までの時間と価格変化の割合を 1 つのチャートに表示します。
現在の時間枠のローソク足の終わりまでの時間と、その日の始値に対するパーセンテージでの価格変化のタイマーは、デフォルトでチャートの右上隅に表示されます。 パネルには、選択したシンボルのその日の始値に対する現在の価格のスプレッドと変化率が表示されます。パネルはデフォルトで左上隅に配置されます。
入力設定: Candle_Time_Lable_Settings - ローソク足の終わりまでの時間と現在のシンボルの価格の変化に関するタイマーのタイプの設定。 Font_Size - フォント サイズ。 X_offset - 横軸に沿ってシフトします。 Y_offset - 縦軸に沿ってシフトします。 Text_color - フォントの色。 Multi_Symbol_Settings - マルチシンボル パネルの設定。 Symbols_to_work - パネルに表示するシンボルをカンマで区切って手動で入力します
FREE

ハーモニックパターンは市場の転換点を予測するのに最適です。これらのパターンは高い勝率と1日の中での多くの取引機会を提供します。当社のインジケーターは、ハーモニックトレーディングの原則に基づいて、市場反転ポイントを予測する最も一般的なハーモニックパターンを特定します。 重要な注意事項: インジケーターは再描画されず、遅れることはありません(パターンはDポイントで検出されます);再描画されることはありません(パターンは有効またはキャンセルされます)。 使用方法: インジケーターをMT5チャートにドラッグアンドドロップします。 パターン検出をTRUE(ABCD;Gartley)に設定します。 任意のデバイスを設定します(高いデバイス=より多くのパターン;低いデバイス=より少ないパターン)。 好みに合わせて色を調整します。 バルブ/エントリーポイント、TP、SLの警告を有効または無効にします。 パターンが検出された場合: アルゴリズムはDポイントでパターンを検出します。 警告が有効になっている場合、パターン検出を通知します。 パターンが無効になった場合、「パターンがキャンセルされました」という
FREE
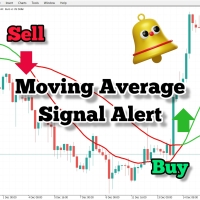
取引戦略で移動平均を使用している場合、このインジケーターは非常に役立ちます。 2つの移動平均がクロスするとアラートを提供し、音声アラートを送信し、取引プラットフォームに通知を表示し、イベントに関する電子メールも送信します。 独自の取引スタイルと戦略に適応するための簡単にカスタマイズ可能な設定が付属しています。
調整可能なパラメーター: 高速MA 遅速MA メール送信 音声アラート プッシュ通知
他の製品もチェックしてください: https://www.mql5.com/en/users/8587359/seller
それらに関する質問やフィードバックがある場合は、コメントを残すか、プライベートメッセージを送信してください。
成功した取引を!
FREE
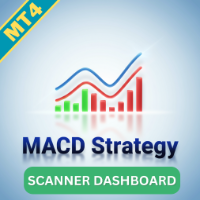
MACDマルチカレンシースキャナーダッシュボード MT4 は、移動平均収束拡散(MACD)インジケーターを使用して、複数の通貨ペアと時間枠でシグナルを追跡するための包括的なツールです。シンボルと時間枠(M1からMN1まで)でシグナルを整理するグリッド形式を提供します。トレーダーは、戦略に合わせて特定の時間枠を有効または無効にできます。 MT5バージョンはこちらで入手できます: MACD Multicurrency Scanner MT5 詳細なドキュメントはこちらをクリックしてください: ドキュメント このツールは、以下のMACD戦略に基づいてシグナルを表示します: ゼロライン下方での強気クロス:MACDラインがゼロライン下方でシグナルラインを上抜けする際にシグナルが生成され、潜在的な強気モメンタムを示します。 ゼロライン上方での強気クロス:MACDラインがゼロライン上方でシグナルラインを上抜けする際にシグナルがトリガーされ、強い強気トレンドを示唆します。 ゼロラインクロスオーバー:MACDラインがゼロラインをクロスする際にシグナルが活性化され、トレンド反転または継続を識別するためにカ

一目均衡表マルチカレンシースキャナーダッシュボード MT4 は、一目均衡表(Ichimoku Kinko Hyo)を使用して複数の通貨ペアと時間枠を監視するために設計された強力な取引ツールです。シグナルはグリッド形式で整理され、ベース通貨と時間枠(M1からMN1まで)でグループ化されます。トレーダーは、戦略に合わせて特定の時間枠を有効または無効にできます。 このツールは、以下の戦略に基づいてシグナルを表示します: Kijun Cross Strategy: 価格が基準線(Kijun-sen)をクロスする際にシグナルを生成します。
Kumo Breakout Strategy: 価格が雲(Kumo)をブレイクアウトするに基づくシグナル。
Chikou Span Confirmation Strategy: 遅行スパン(Chikou Span)を使用してシグナルを確認します。
Tenkan-Kijun Cross Strategy: 転換線(Tenkan-sen)と基準線(Kijun-sen)のクロスに基づく短期シグナル。
Kumo Twist Strategy: 雲(Kumo)のねじれを

追加のクリックなしで2EMAの交差点に基づいてトレンドを見ることができるマルチ通貨、マルチタイムフレームインジケーターは、すべての時間枠で最後の交差点を一度に検索し、開いている通貨ペアのトレンドがどの方向に向けられているか、および最後の交差点がどれくらい前にあるかを左上隅に書き込みます。
この指標に基づいて、ほとんどの傾向が1方向に向けられている場合は注文を開始し、状況が変化したときに取引を終了することができます。
インジケータはチャート上にEMAを描画しません。これにより、空き領域を有利に使用することができます。rsiやMACDなどの追加の確認インジケータを追加できます。
この指標は、平均価格で計算された高速と低速の2つのEMAに基づいています。 速い-24の期間があり、遅い-60は、周波数を失うことなく、より多くの偽の信号を遮断することができます! 私は他に何を改善し、改善することができるかを知ることができるように、レビューの形でフィードバックを残してください!
FREE

上昇下降トレンド - トレンドそのものを決定します。 トレンドを正しく特定することで、取引効率の 95% が決まります。 そして、トレーダーが常にトレンドの方向を正確に判断できれば、トレンドの方向が修正されるのを待って取引を開始するだけで済みます。 どのような取引戦略においても、トレンドを正しく特定する必要があります。 トレンドが正しく定義されていない場合、トレーダーは市場に効果的に参入できず、取引結果がマイナスになる可能性が高くなります。 アップダウントレンドインジケーターは、市場のトレンドの動きを正確に判断し、この情報をシンプルな形でトレーダーに表示するために作成されました。 このインジケーターは、多数の矢印や線の代わりに、上昇トレンドの場合は「UP」という単語をチャート上に表示し、下降トレンドの場合は「DOWN」という単語をチャート上に表示します。 トレンドの動きをさらに単純に判断することは不可能です。 トレーダーにとって、これは市場の現在のトレンドをすべての時間枠にわたって同時に判断するための最も簡単であると同時に、最も効果的な方法の 1 つです。 このインジケーターは、すべ

Tired of using the same technical indicators? The "Tekno RSI" is an innovative tool designed to make the interpretation of the Relative Strength Index (RSI) more intuitive and accessible to traders of all levels. It displays the RSI as a 3-color histogram, providing a clear and intuitive visual representation of market conditions.
1)Key Features 3-Color Histogram: RSI is a versatile indicator providing insights into market direction and potential reversal points. However, when analyzing the cha
FREE

Using the Neo Forex indicator algorithm, you can quickly understand what trend is currently developing in the market. The NeoX indicator accompanies long trends and can be used without restrictions on instruments or timeframes. Using this indicator you can try to predict future values. But the main use of the indicator is to generate buy and sell signals. The indicator tracks the market trend, ignoring sharp market fluctuations and noise around the average price. The indicator implements a type

The Compare Graphs indicator is an analysis tool that allows traders to compare two or more graphs on the same chart window. This indicator is commonly used in trading platforms such as MetaTrader and provides a clearer comparison of different financial instruments or time frames.
Functions of the Compare Graphs indicator may include: Selecting Charts: The trader can select the charts he wants to compare, such as price charts of different currency pairs or indicators on the same chart. Setting

FX Correlation Matrix is a powerful multi-timeframe dashboard that helps traders analyze real-time currency correlations of up to 28 symbols at a glance. With customizable settings, sleek design, and manual symbol selection option, it enhances trade accuracy, reduces risk, and identifies profitable correlation-based opportunities. Setup & Guide: Download MT5 Version here. Follow our MQL5 channel for daily market insights, chart, indicator updates and offers! Join here.
Read the product des
Description of work The MA7 Viola indicator is based on the standard Moving Average indicator. Shows a sharp increase or decrease in the moving average. Detailed information about the MA7 Viola indicator.
Indicator settings General settings: Period ; Method ; Apply to ; Difference – difference between the last two MA values; Remove subsequent arrows – removes subsequent arrows in one direction.
Message settings: Send message to the terminal (Alert) – permission to send messages to the terminal

RaysFX Forcaster è un indicatore avanzato per MetaTrader 4, progettato per fornire previsioni accurate del mercato. Questo indicatore utilizza un algoritmo sofisticato per calcolare i valori futuri basandosi su una serie di parametri configurabili dall'utente.
Caratteristiche principali: - TimeFrame : Permette all'utente di impostare il timeframe desiderato. Supporta diversi timeframes come M1, M5, M15, M30, H1, H4, D1, W1 e MN. - HalfLength : Questo parametro determina la lunghezza della metà
Description of work The MA7 Galega indicator is based on the standard Moving Average indicator. Shows a puncture of the moving average. Detailed information about the MA7 Galega indicator.
Indicator settings General settings: Period ; Method ; Apply to ; Consider the direction of the candle .
Message settings: Send message to the terminal (Alert) – permission to send messages to the terminal using the Alert function; Send message to the mobile terminal (Push) – permission to send messages to t
MetaTraderマーケットは、他に類のない自動売買ロボットやテクニカル指標の販売場所です。
MQL5.community ユーザーメモを読んで、取引シグナルのコピー、フリーランサーによるカスタムアプリの開発、支払いシステムを経由した自動支払い、MQL5Cloud Networkなど、当社がトレーダーに対して提供するユニークなサービスについて詳しくご覧ください。
取引の機会を逃しています。
- 無料取引アプリ
- 8千を超えるシグナルをコピー
- 金融ニュースで金融マーケットを探索
新規登録
ログイン