Sinus wave
- インディケータ
- バージョン: 6.1
- アップデート済み: 28 3月 2025
- アクティベーション: 20
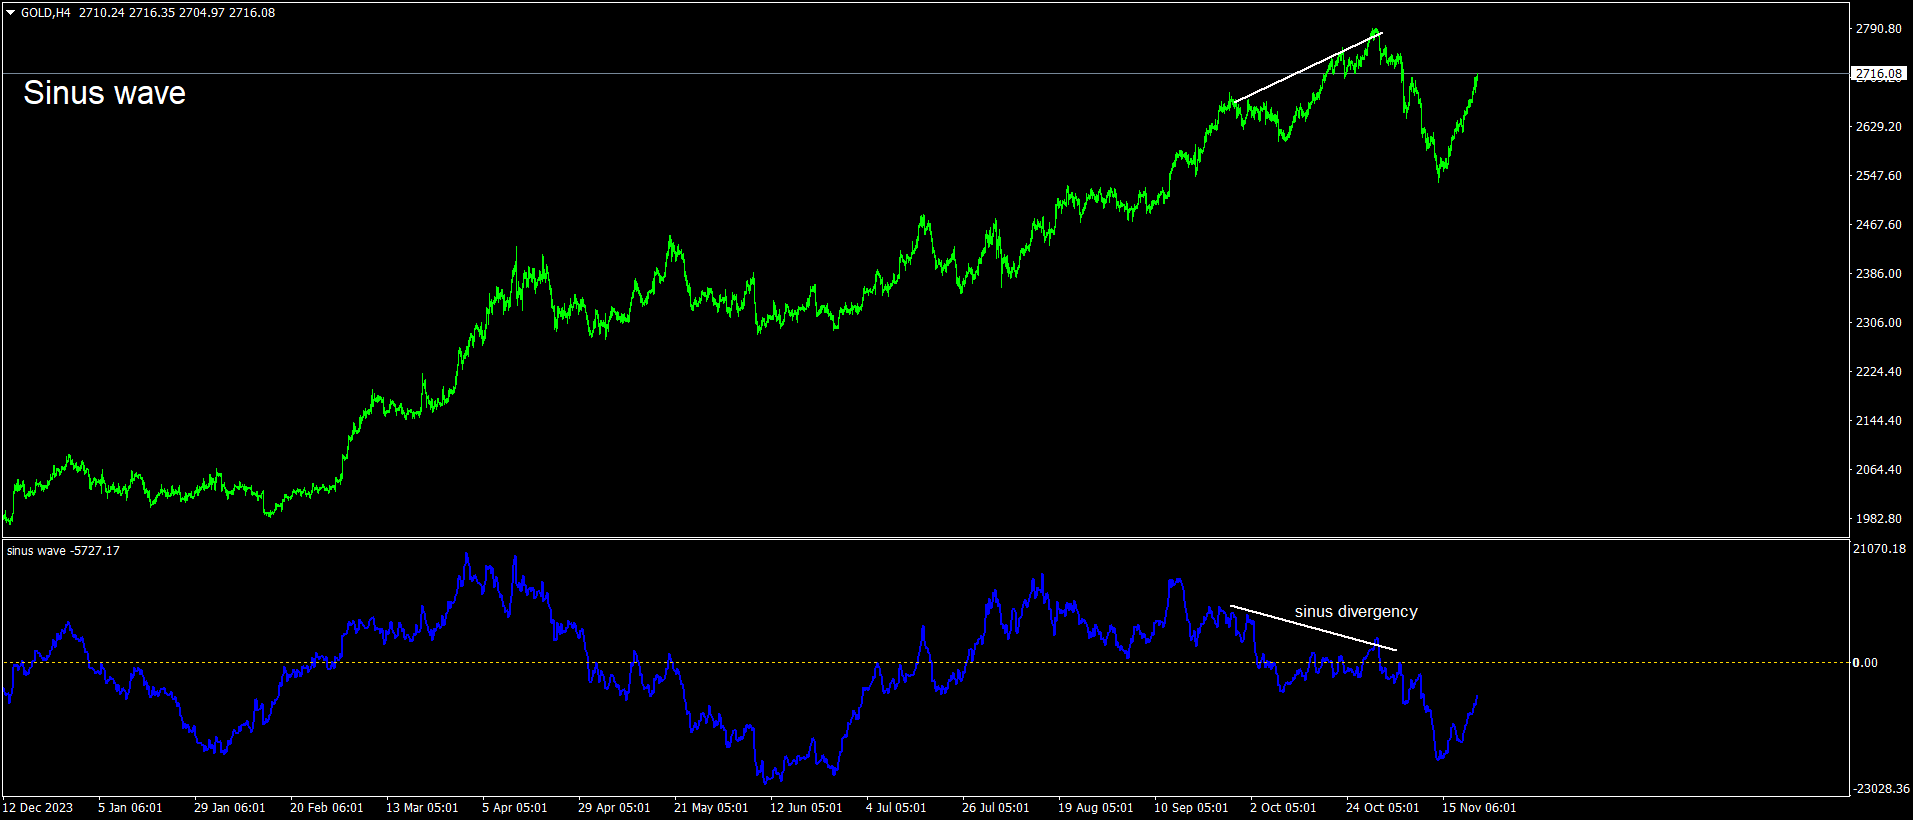
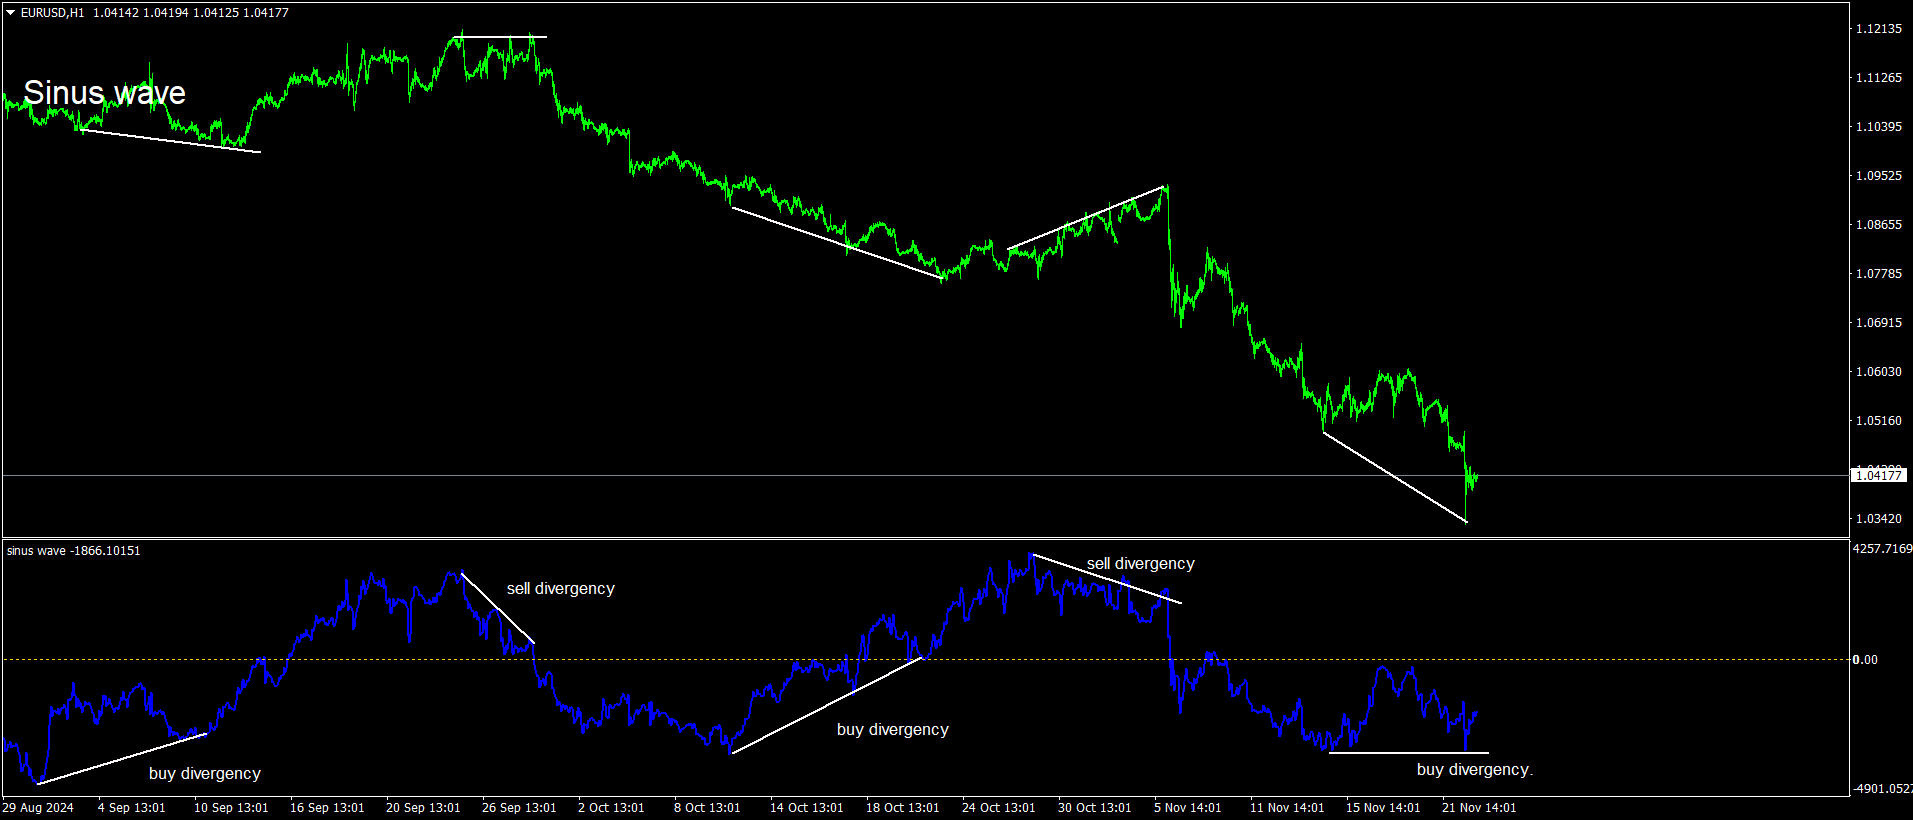
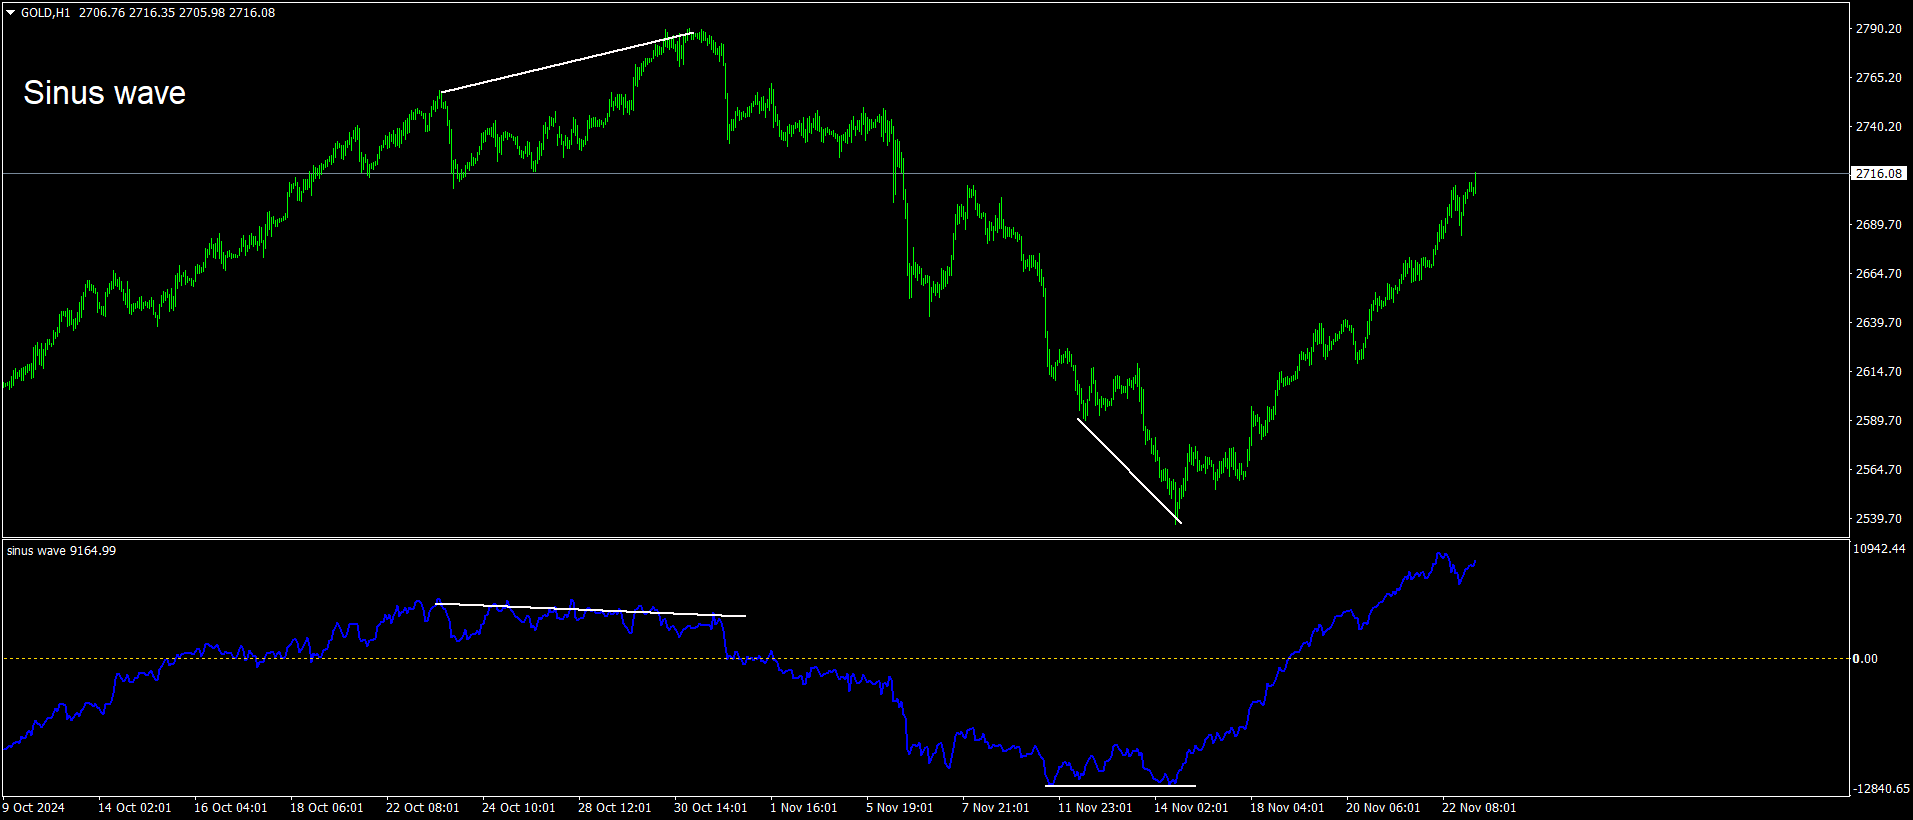
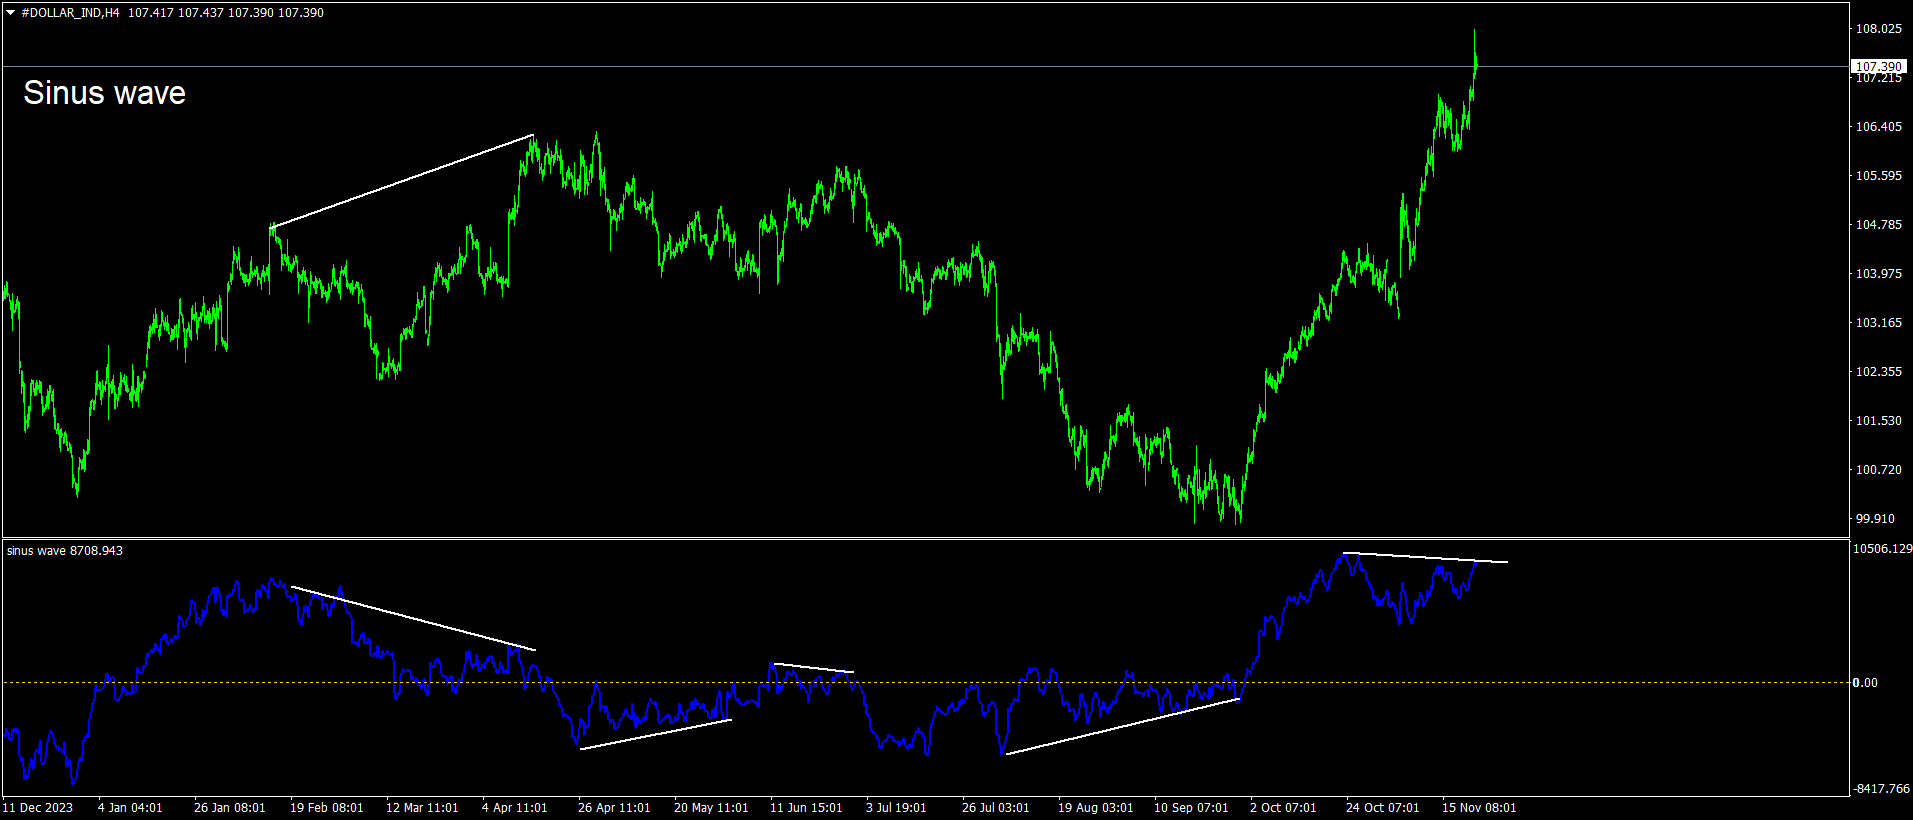
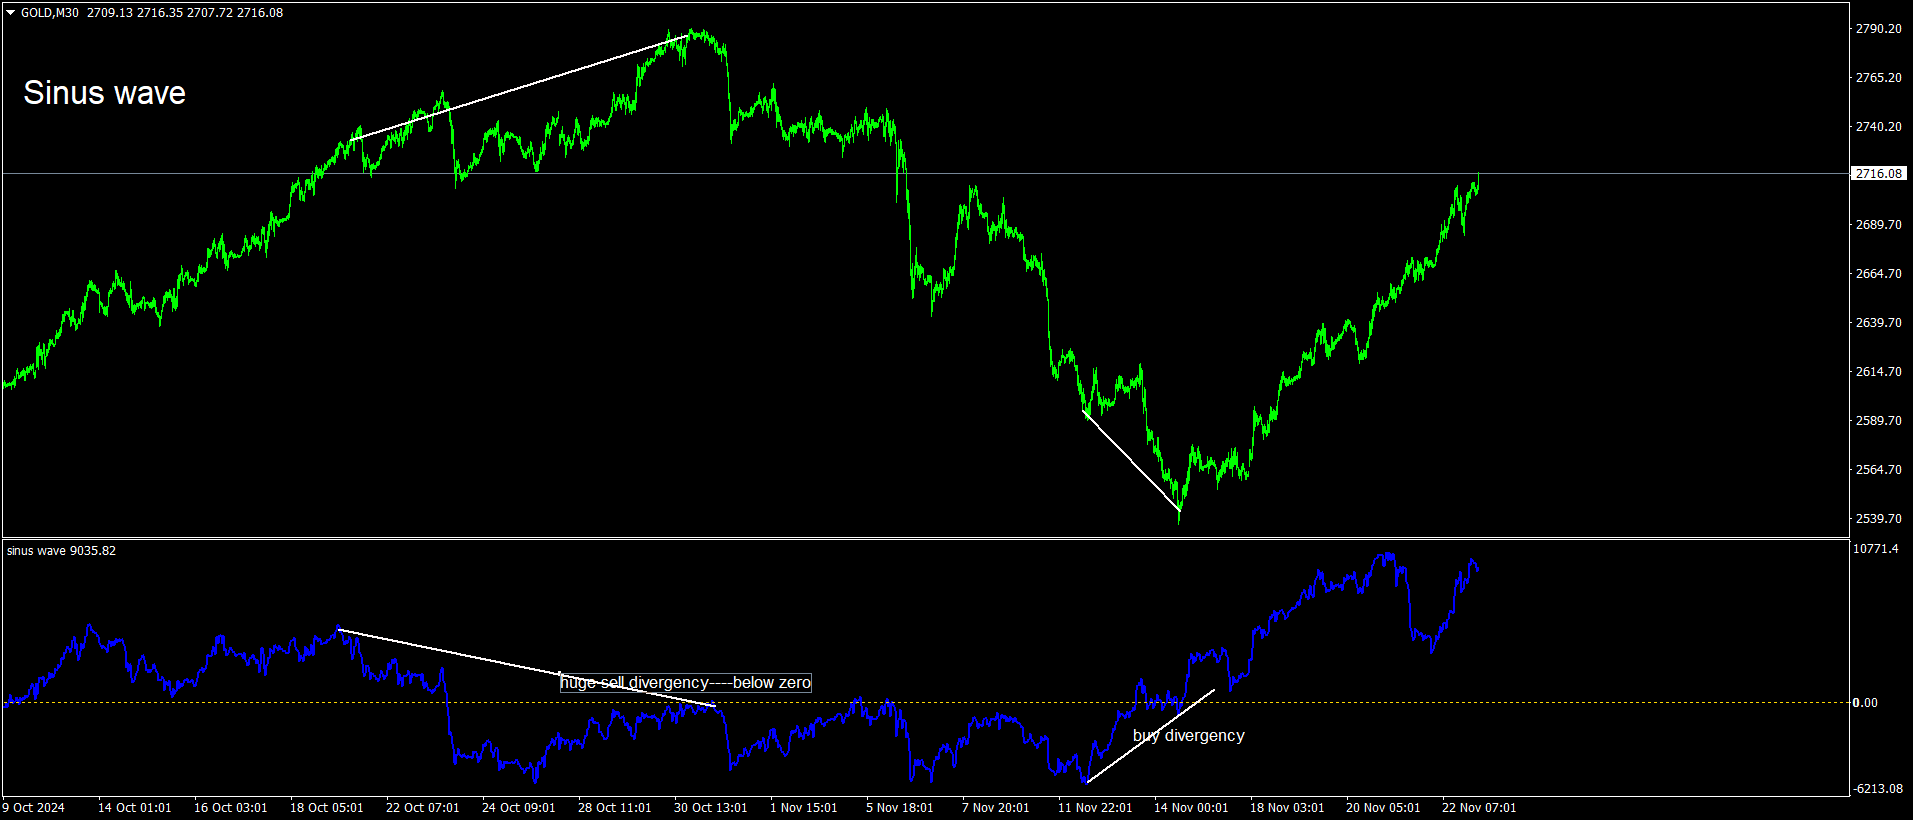
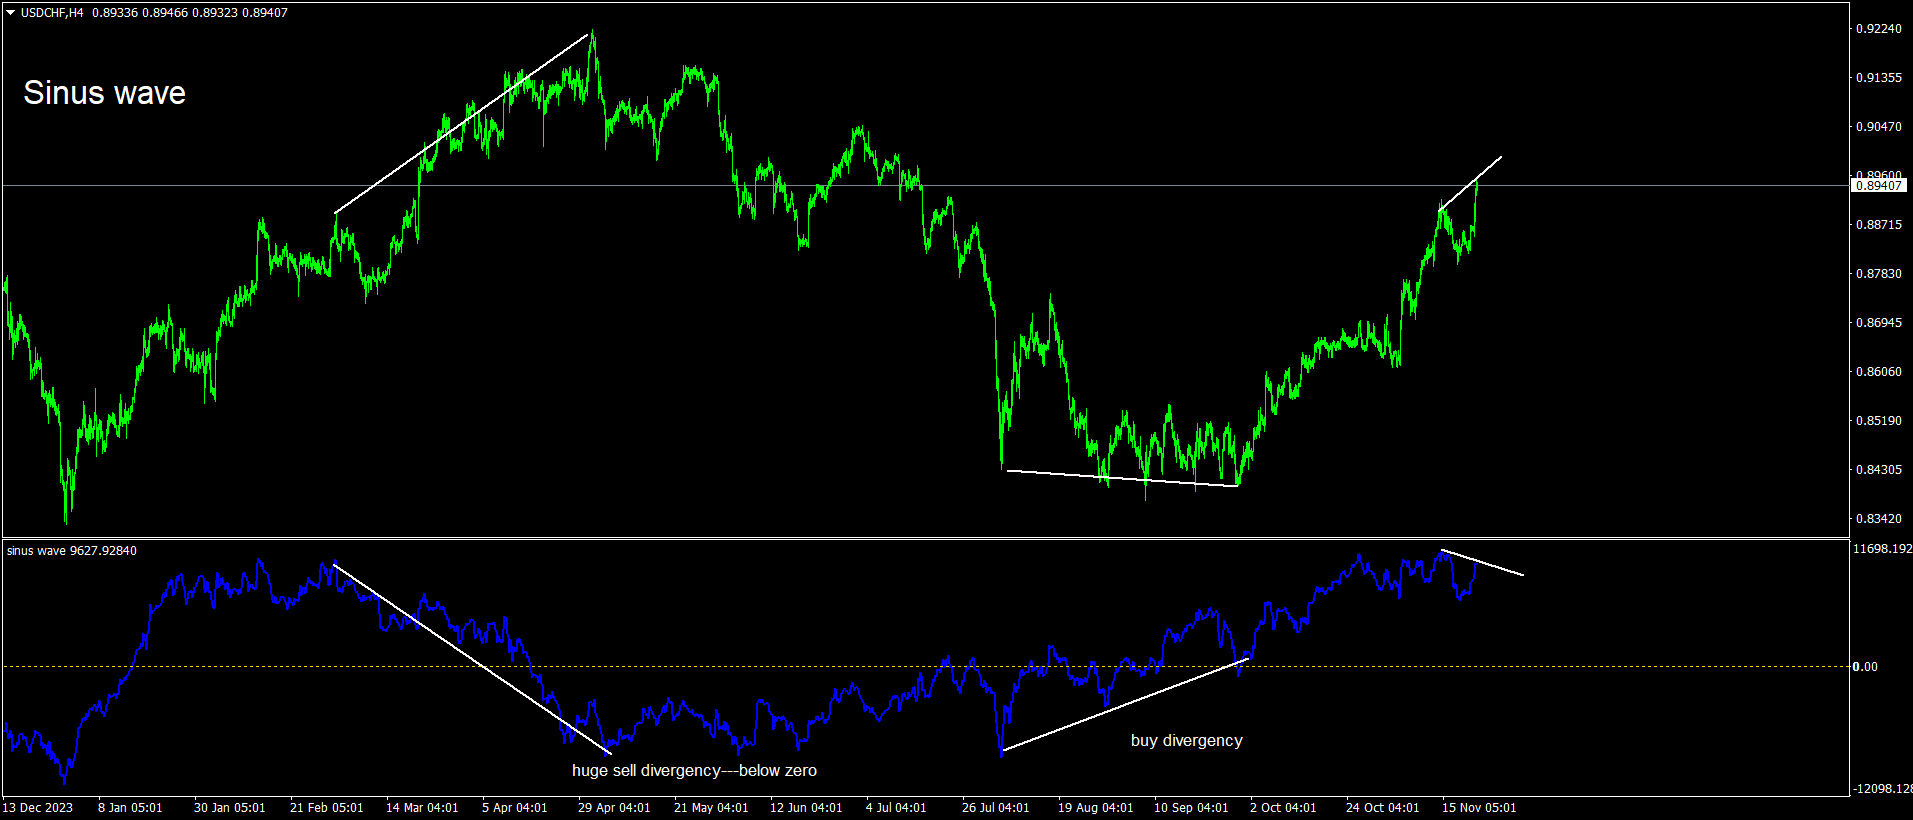
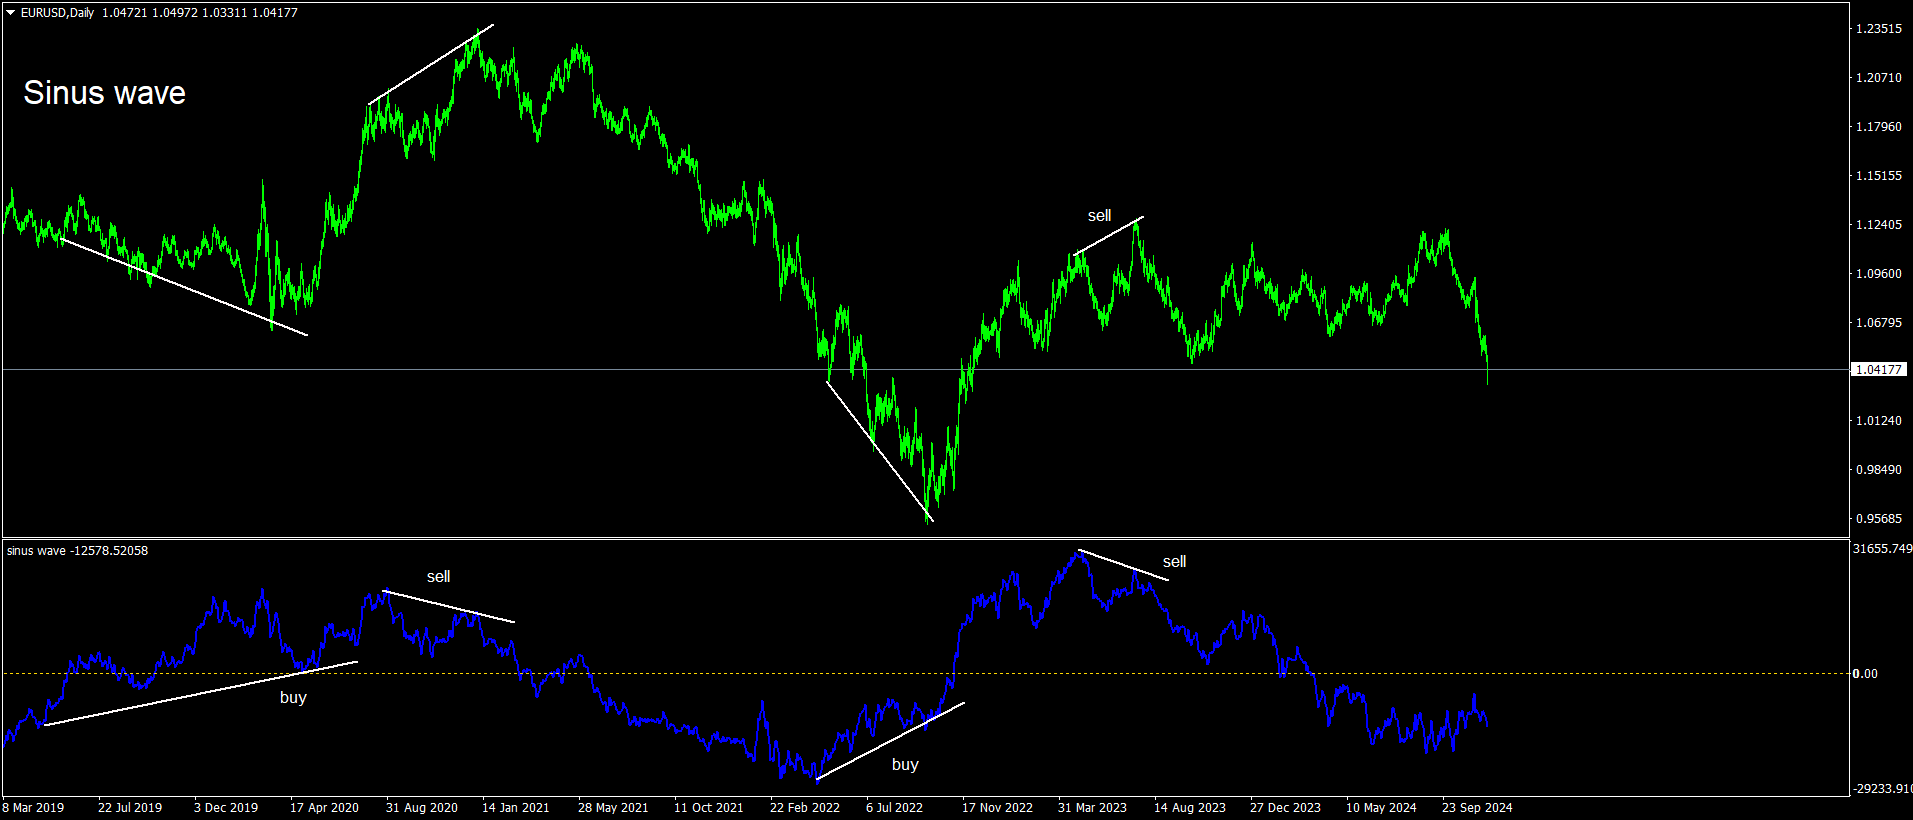
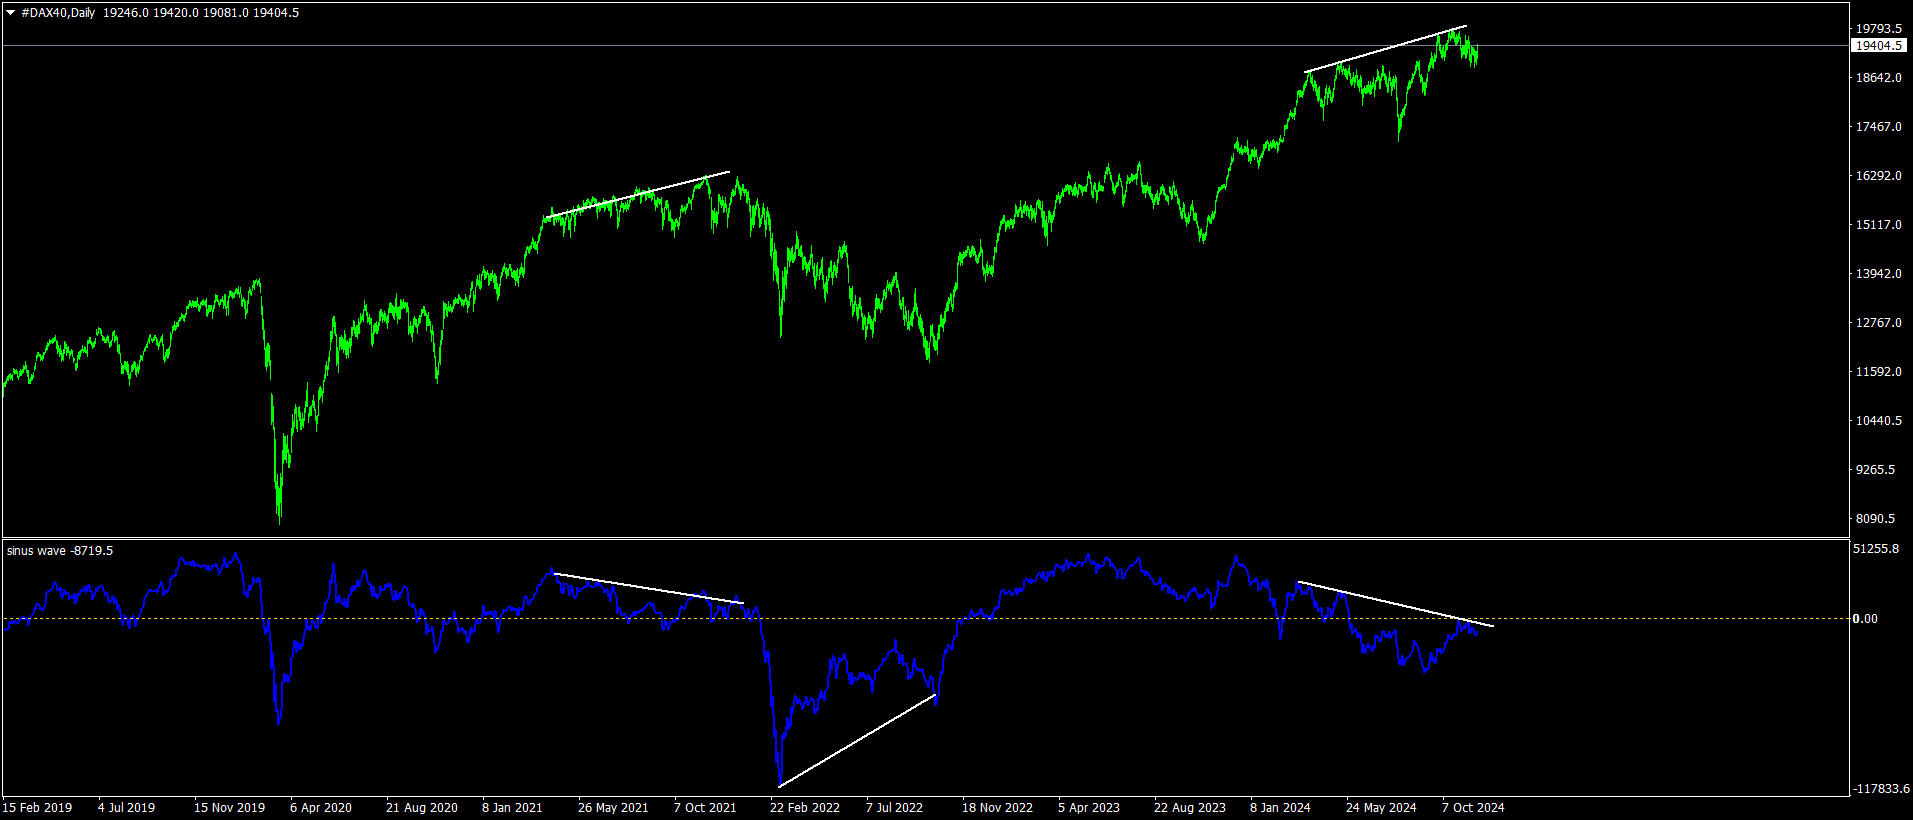
Sinus wave indicator is a extra ordinary oscillator.to find divergency.
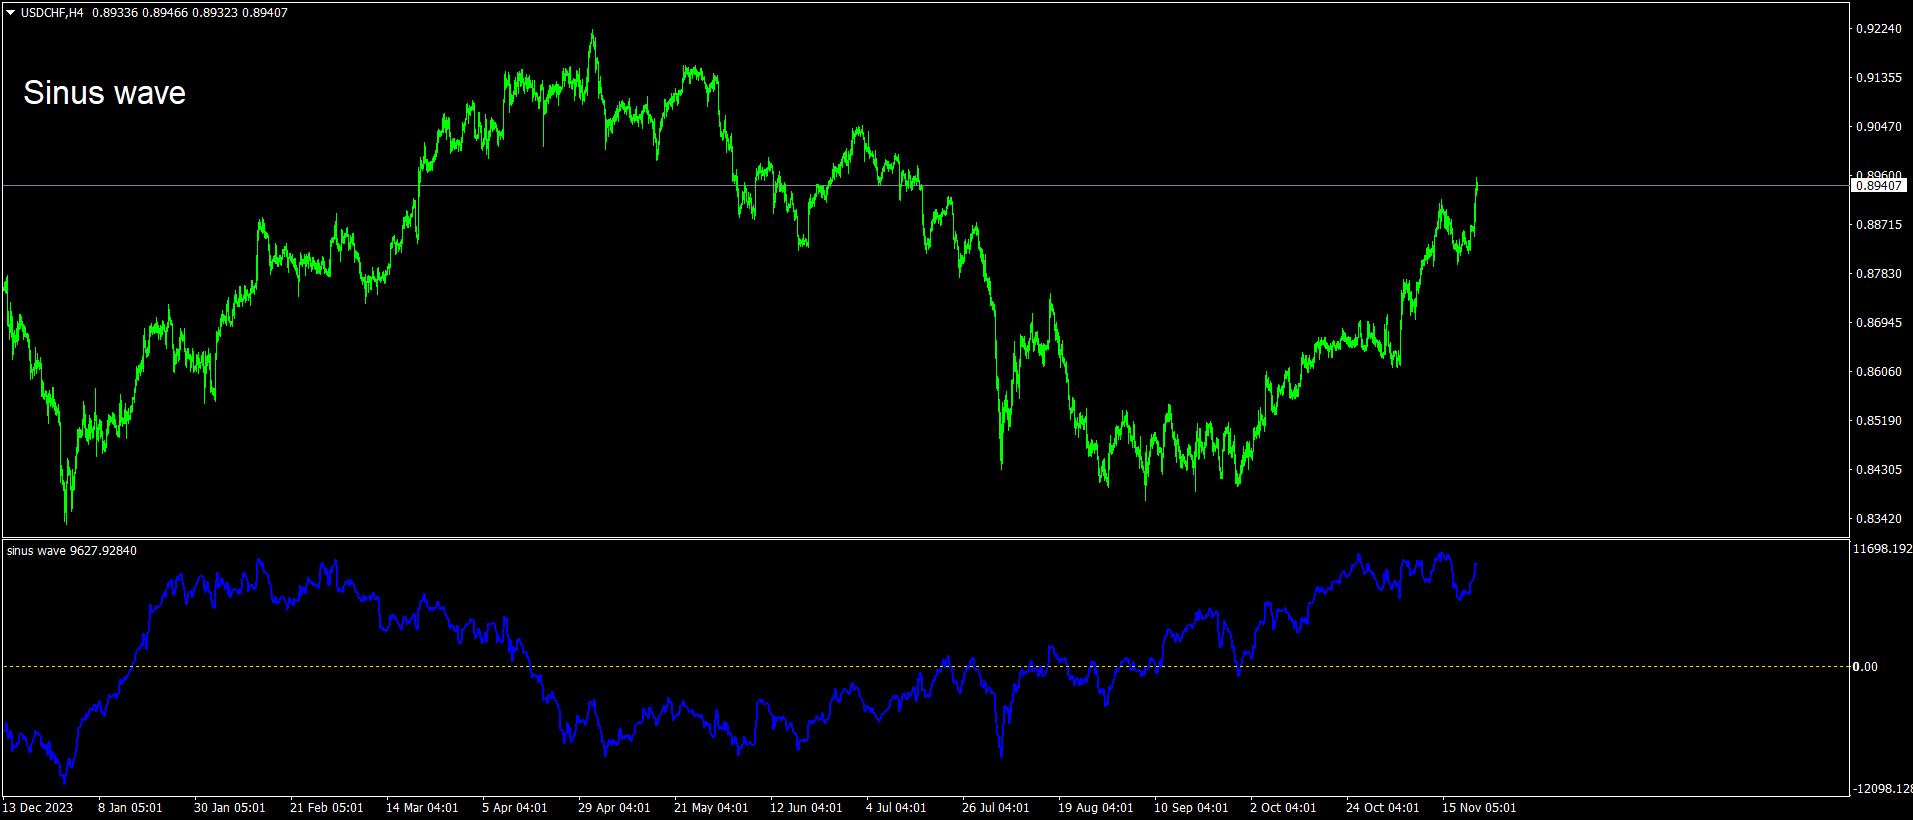
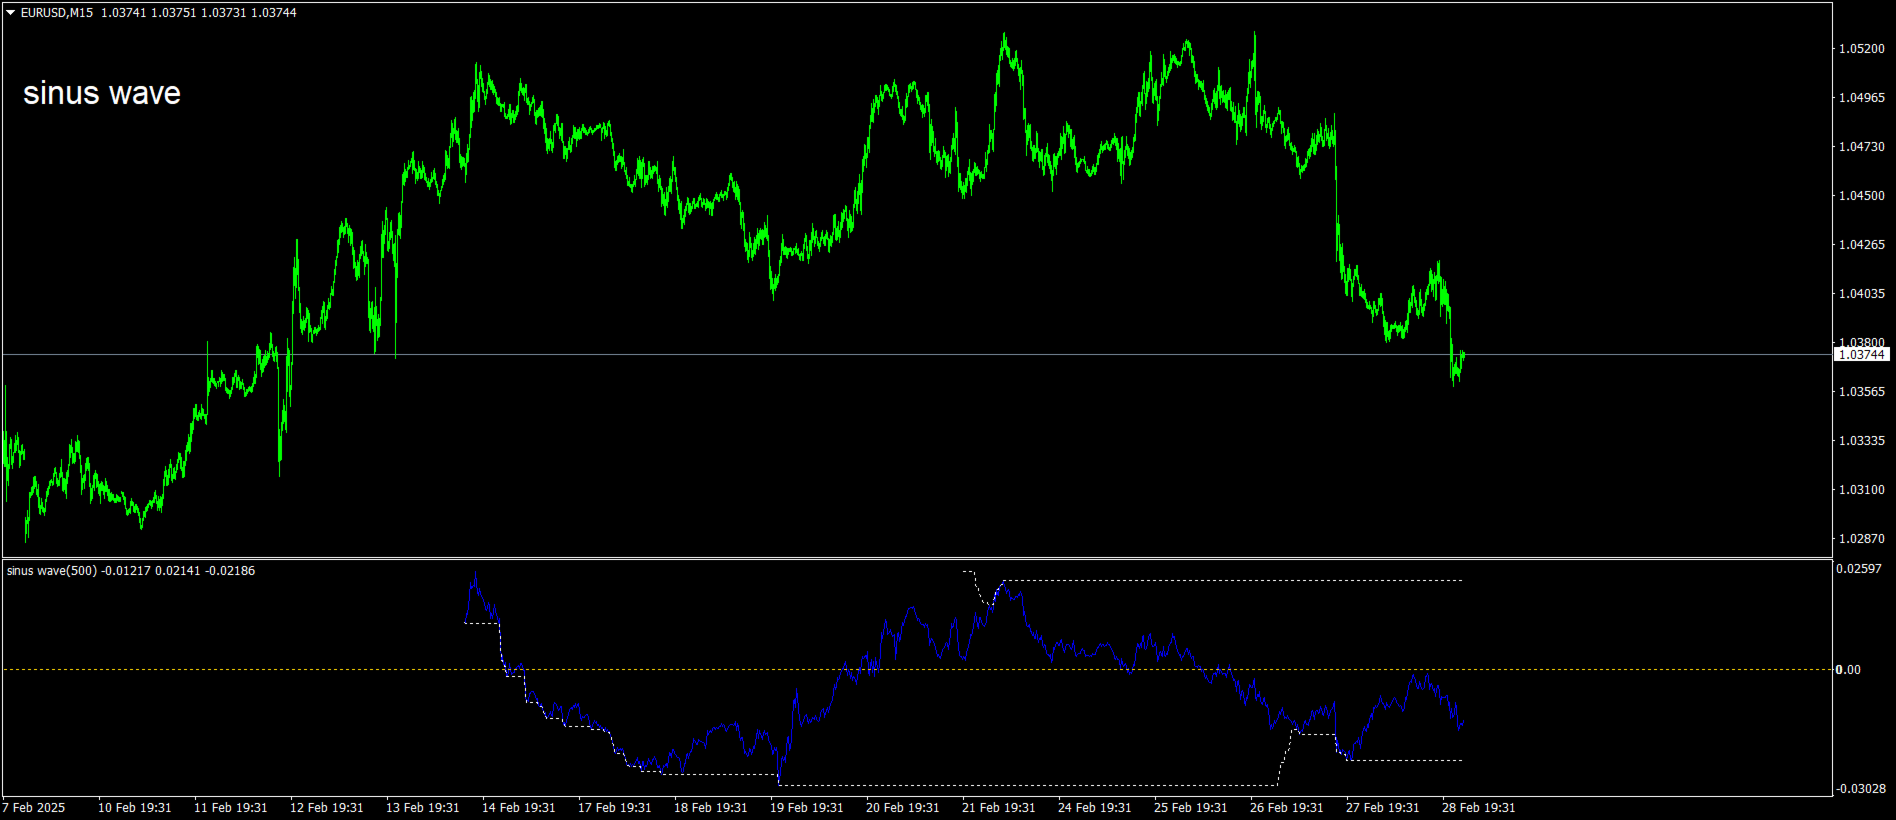
it works all pairs and all timeframes.
suitable for experienced and beginner traders..
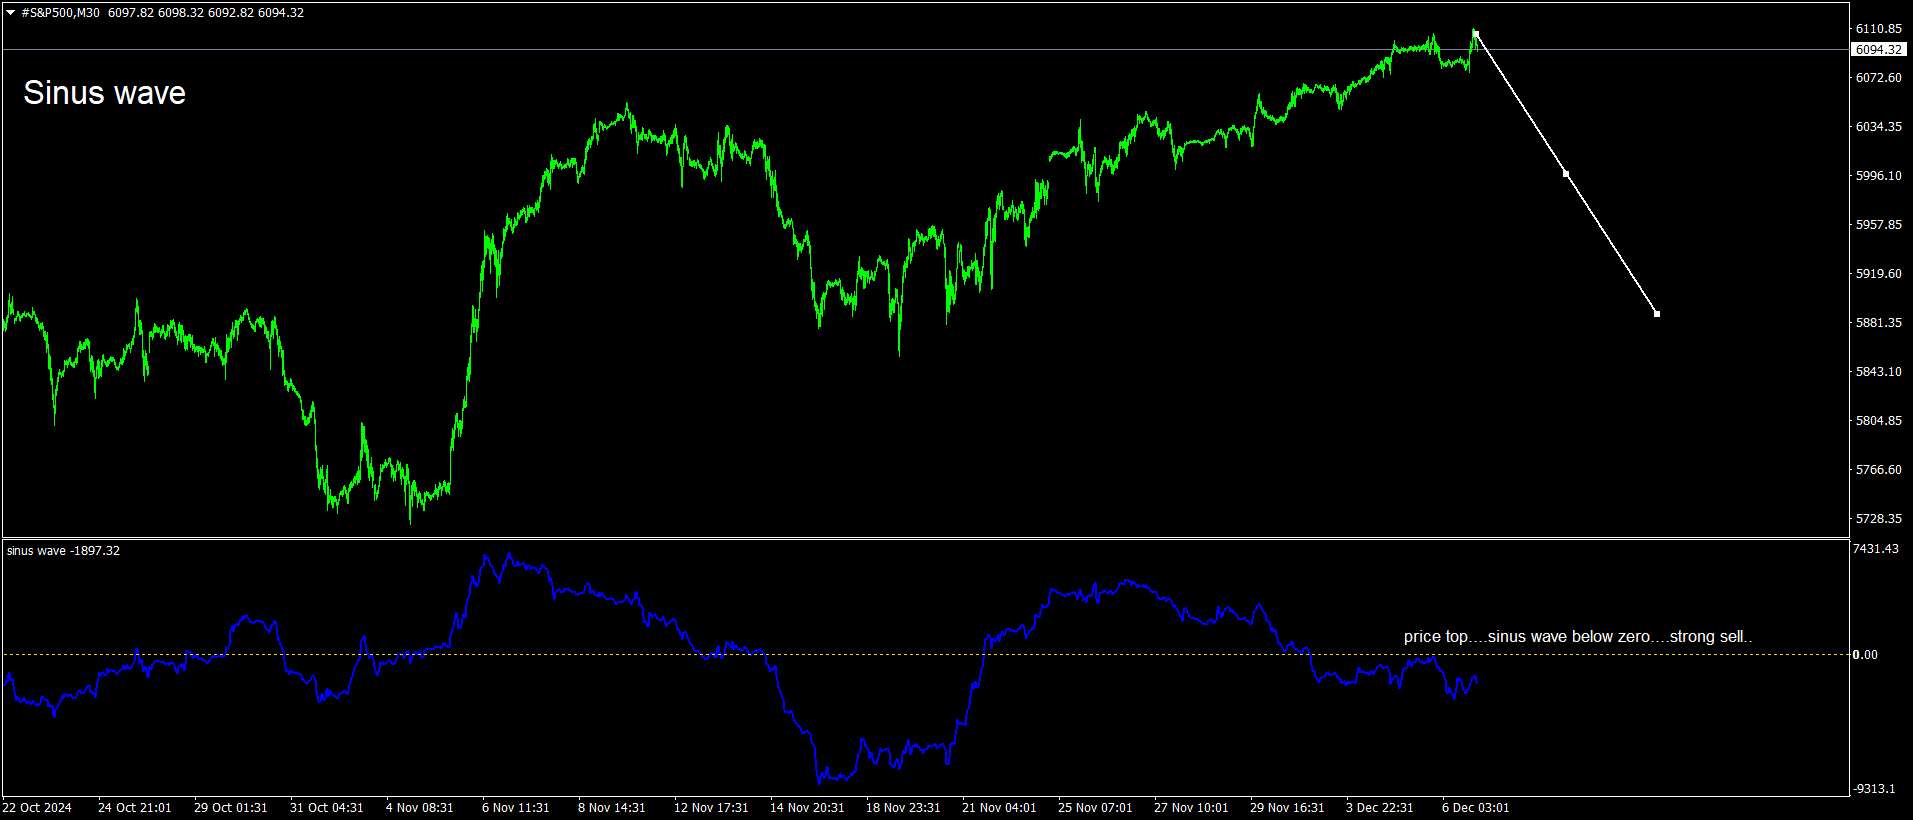
indicator works on toward of the prices...
while sinus wave go up side that means prices will up.
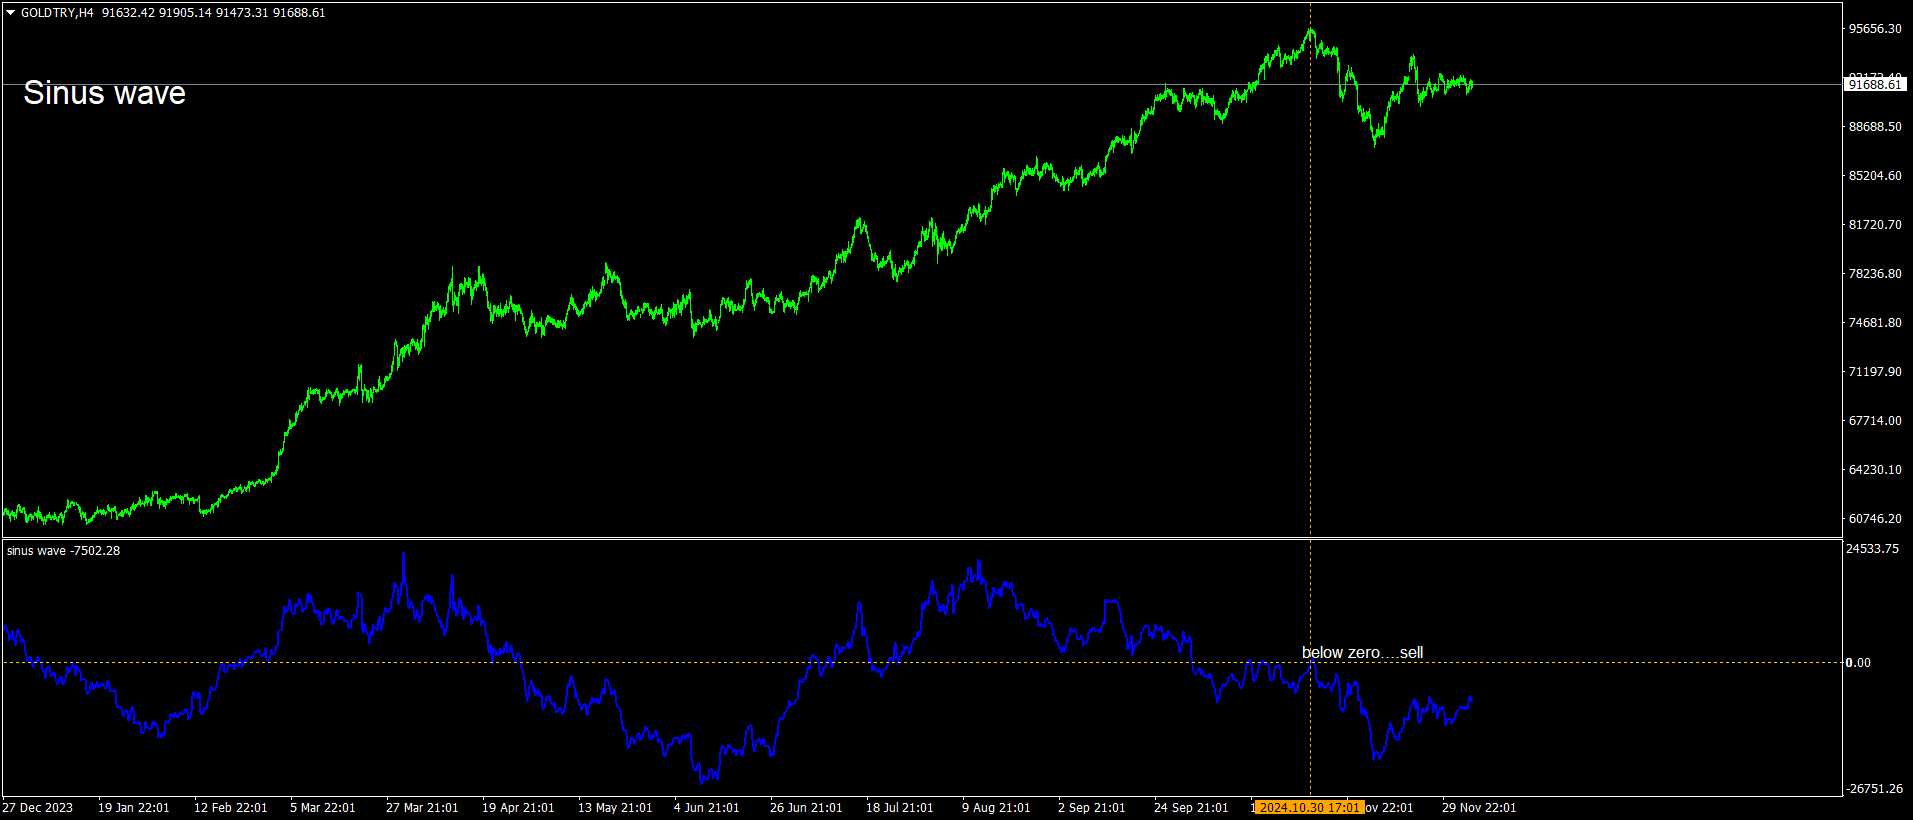
and while sinus wave go down that means prices is going down.
it gives divegency when trend reversals.
It also gives sell divergency on bear markets
there is wave to set default 500.
It can be increase depends to charts bars numbers
on pictures divergency lines and letters has been drawn by hand.to explain how it works.

I recently purchased the Sinus Wave indicator, and my results so far have been very good. The Wyckoff methodology is a style I find extremely useful. As a result, I prefer clean charts without unnecessary lines, averages, or arrows. If you have a solid understanding of price action, this indicator is remarkably helpful for confirming trade decisions. Additionally, Guner, the creator, has been helpful, easy to communicate with, and supportive. That said, it ultimately depends on your trading style. This indicator has definitely made a positive difference in my trading results.