Gap Indicator 123 Gap

Indicatore di Gap (Gap 123): Strumento di Precisione per Identificare Potenziali Obiettivi di Prezzo

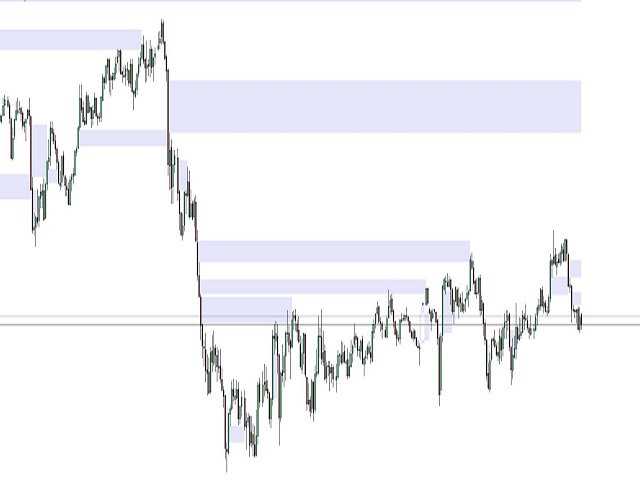
L'Indicatore di Gap (Gap 123) è uno strumento potente progettato per identificare obiettivi di prezzo ad alta probabilità basati sulla struttura del mercato. Analizzando set di tre candele consecutive, questo indicatore individua gap cruciali che spesso fungono da magneti per l'azione del prezzo.

Come Funziona

  1. Analisi Continua: L'indicatore scansiona ogni set di tre candele consecutive sul tuo grafico.
  2. Identificazione dei Gap: Calcola il gap tra la prima e la terza candela in ogni set.
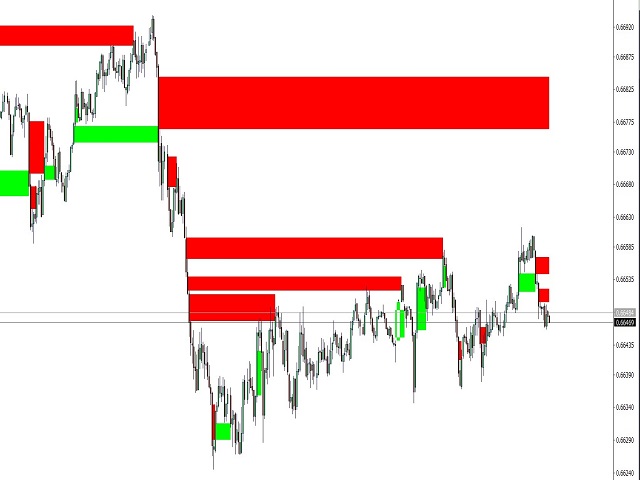
  3. Rappresentazione Visiva: I gap identificati vengono visualizzati sul grafico, codificati a colori per una facile interpretazione.

Vantaggi Principali

  • Previsione di Potenziali Inversioni: Evidenzia aree dove il prezzo potrebbe tornare dopo un'inversione di tendenza.
  • Identificazione di Obiettivi di Ritracciamento: Indica livelli dove il prezzo potrebbe fare una pausa durante un ritracciamento.
  • Miglioramento di Entrate e Uscite di Trading: Usa i livelli di gap per affinare i tuoi punti di entrata e uscita.

Esempio Reale

In uno scenario di trend ribassista:
  • Minimo della prima candela: 1,0000
  • Massimo della terza candela: 0,9950
  • L'indicatore evidenzierà il gap tra 0,9950 e 1,0000 come potenziale obiettivo al rialzo.
Questo gap spesso agisce come un "magnete", attraendo il prezzo durante futuri movimenti al rialzo.

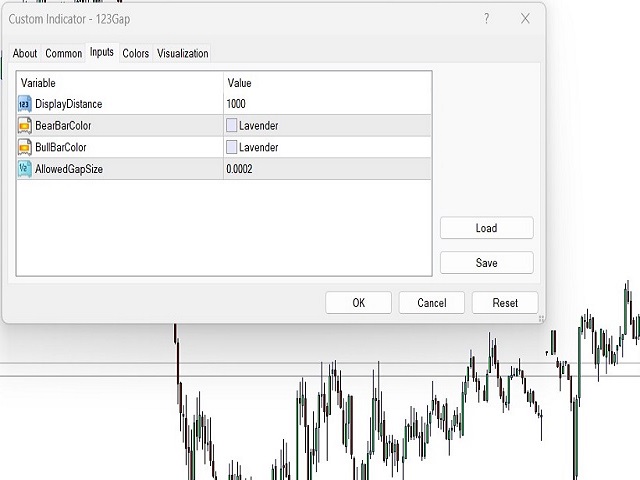
Impostazioni Personalizzabili

  1. Distanza di Visualizzazione: Regola quanto indietro l'indicatore cerca i gap.
  2. Colore Barra Ribassista: Personalizza il colore per i gap nei trend ribassisti.
  3. Colore Barra Rialzista: Imposta il colore per i gap nei trend rialzisti.
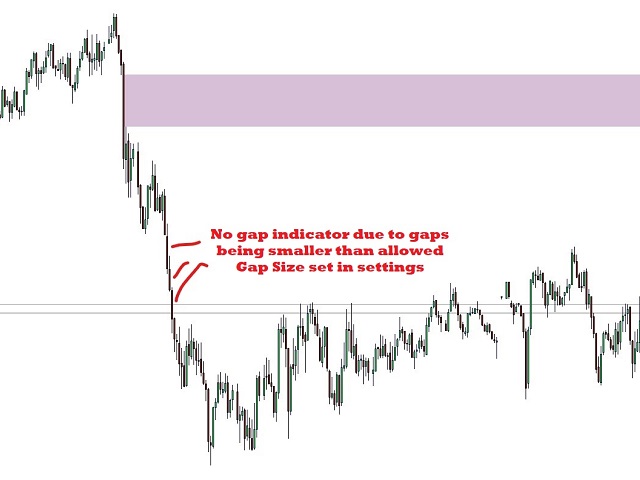
  4. Dimensione Gap Consentita: Definisci la dimensione minima del gap da evidenziare.

Perfetto Per

  • Trader di swing alla ricerca di punti precisi di entrata e uscita
  • Day trader che cercano di identificare livelli di inversione intraday
  • Trader di tendenza che desiderano individuare potenziali obiettivi di ritracciamento
Migliora la tua analisi tecnica con l'Indicatore di Gap (Gap 123) e ottieni un vantaggio unico nella previsione di potenziali movimenti di prezzo. Inizia oggi stesso a identificare opportunità di trading ad alta probabilità!


Prodotti consigliati
Cosmic Dream
Tyrae Trae Bailey
This indicator may or may not be within your interest but I call it Cosmic Dream. When I backtested the indicator, colored level zones appear on your chart. It can work on any currency pair you want. There are 5 level zones. 5 are red and 5 are green. The purpose of this indicator is to let traders see the number of level zones. The interval of the zones is 50 at best. In terms of zone width, the number is 10. It can utilized for any direction. The colors will be visible as long as the indicator
Breakout Impulse IndicatorBreakout Impulse Indicator is a pattern recognition indicator for Forex, Stocks, Indices, Futures, Commodities and Cryptos. The Breakout Impulse is a multi-bar pattern. The purpose of the pattern is to identify a fast change in momentum. This type of change can announce the start of a big directional move. Inputs of the indicator are: Distance: distance in pixel relative to top or bottom of candle to display the arrow symbol MaxBars: number of bars back used to calcula
Decent Trading Tools, The ones that separate the Winners from the Losers, do not have to be expensive. This is the second out of a series of two indicators from the magic series. This indicator is Magic Correlation , this is the Middle Indicator in the screenshot. The indicator plots up to 30 instruments and visualizes events like: Time, Start, End and Duration of the events. Underlying Correlation. Trend Strength. Front Runners and Laggards. Directions. Patterns. What normally remains hidden be
The indicator for presenting current spread in real time. It is a very simple still useful indicator for manual trading and market analysis. The indicator shows current spread (in 4-digit format) for the selected instrument. You can specify the place on the chart where indicator shall print the output as well as output color. Please contact the author if any changes are required.
Momentum Breakout Envelope
Pieter Gerhardus Van Zyl
Momentum Breakout Envelope is a momentum-analysis indicator designed to highlight potential breakout phases and shifts in market strength. It runs in a separate window and displays three main elements: an upper band , a lower band , and a momentum core line . Together they form a dynamic envelope that expands or contracts as market momentum changes. The bands act as a structured range that helps visualize momentum pressure, while the core line represents the underlying strength of the current mo
El indicador "MR BEAST ALERTAS DE LIQUIDEZ" es una herramienta avanzada diseñada para proporcionar señales y alertas sobre la liquidez del mercado basándose en una serie de indicadores técnicos y análisis de tendencias. Ideal para traders que buscan oportunidades de trading en función de la dinámica de precios y los niveles de volatilidad, este indicador ofrece una visualización clara y detallada en la ventana del gráfico de MetaTrader. Características Principales: Canal ATR Adaptativo: Calcula
Alpha Trend sign has been a very popular trading tool in our company for a long time. It can verify our trading system and clearly indicate trading signals, and the signals will not drift. Main functions: Based on the market display of active areas, indicators can be used to intuitively determine whether the current market trend belongs to a trend market or a volatile market. And enter the market according to the indicator arrows, with green arrows indicating buy and red arrows indicating se
Rainbow Price Visualizer v1.21 See where the market really breathes. Turns your MT4 chart into an ultra-precise heatmap that highlights price zones favored by big players. Why it matters 300 price levels at 0.2‑pip resolution — microscopic detail. 8 visual themes (Rainbow, Fire, Ocean…) for instant readibility. Smart opacity: low noise fades, real zones pop. Lightweight rendering with automatic cleanup. Fully customizable: saturation, opacity, resolution, history depth. Bands project into the f
Trendiness Index
Libertas LLC
5 (3)
"The trend is your friend" is one of the best known sayings in investing, because capturing large trendy price movements can be extremely profitable. However, trading with the trend is often easier said than done, because many indicators are based on price reversals not trends. These aren't very effective at identifying trendy periods, or predicting whether trends will continue. We developed the Trendiness Index to help address this problem by indicating the strength and direction of price trend
CYov_KijunLine_MTF (Kijun Ribbon / Multi-Timeframe Kijun) This indicator is designed to visualize Ichimoku Kijun-sen together with a higher-timeframe Kijun-sen , helping you keep your trading bias consistent and avoid low-quality conditions. It is not a “magic signal generator”. The goal is to provide a clearer perspective so you can reduce mistakes and avoid bad trades . 1. What is Kijun-sen? Kijun-sen is a core line of the Ichimoku system calculated from the highest high and lowest low over a
Levels price
Levi Kevin Midiwo
Levels price is a mt4 indicator that shows various levels to enter the market based on indicator calculations. The indicator consists of the following buffers; Red buffer Blue buffer Purple buffer The blue buffer is the resistance level where price is expected to bounce back.  The red buffer is the support level based on the current market price. There is also a purple buffer below red buffer that can indicate the current support and resistance levels have been breached when price crosses this p
PipsZenith Virtual Candle Levels – Indicator Description Take your trading to the next level with PipsZenith Virtual Candle Levels – the ultimate multi-timeframe support and resistance tool. This powerful indicator plots High, Low, Open, and Close levels from multiple standard and custom timeframes, helping traders identify key market zones with precision. Unlike ordinary indicators, PipsZenith Virtual Candle Levels lets you see levels from: Yearly, 6-Month, 4-Month, 3-Month, 2-Month Monthly, We
Indicator that alerts by push  notification to the mobile phone or by alert on the platform of the touch of the candle with the selected average. The alarm can be set to receive "x" seconds before the candle closes. Specially suitable for those who cannot or want to spend a lot of time in front of the screens to see a movement start from a moving average and therefore miss the movement. You can configure any average method and the time to receive the alert before the candle closes.
StructureFlow MT4
Vincent Jose Proenca
Indicatore Avanzato di Analisi della Microstruttura di Mercato Questo indicatore analizza l’azione del prezzo a livello microscopico per rilevare squilibri nascosti prima che avvengano grandi movimenti. A differenza degli indicatori tradizionali che osservano solo il prezzo, StructureFlow esamina tre dimensioni fondamentali: Analisi Principale Microstruttura delle Candele Rapporto ombra/corpo Posizione del corpo all’interno del range Rilevamento di espansione/contrazione Anomalie di volatilità i
The block of bars is collected under condition of divergence . If the divergence conditions are not met, the block is deleted. More precisely, the condition is the transition of the block of bars from the state of divergence to the state of convergence . Blocks are formed selectively with gaps. Gaps are characterized by the state of convergence of bars. The indicator shows the value and direction of the price in the divergence block . To determine the divergence value, see here , the line of ext
The " Stochastic Advanced " indicator displays the signals of the 'Stochastic" indicator directly on the chart without the presence of the indicator itself at the bottom of the screen. The indicator signals can be displayed not only on the current timeframe, but also on a timeframe one level higher. In addition, we have implemented a filter system based on the Moving Average indicator. Manual (Be sure to read before purchasing) | Version for MT5 Advantages 1. Displaying the signals of the "Stoch
Market Follower
Alexey Surkov
5 (1)
The Market Follower indicator displays two types of potential entry points on the chart (by trend and absolute reversal points). The entry point by the trend is displayed by a circle. The indicator qualifies the presence of a trend at a certain interval by a certain algorithm. Then it displays a potential entry point after a rollback (correction). For the successful use of these entry points, it is recommended to use at least M30 timeframe with a confirmation on smaller timeframes. The Absolute
SX Currency Strength indicator allows users to analyze currency strength through a selected period, with results resetting periodically and accumulating thereafter. It displays the historical relative strength of eight major currencies (USD, EUR, GBP, JPY, AUD, CHF, CAD and NZD) across a selected timeframe. Assessing a currency's relative strength aids in evaluating its performance against a basket of other currencies. Users can select to visualize relative strength of the currencies in the shap
Theq HAG
Luis Alberto Vazquez Carpio
5 (6)
THEQ HAG Indicator. - THEQ HAG Indicator has p rofit maximization and loss minimization math algorithm displaying signals . Full description in video and screenshots. - Trading with the Trend with Signals  and Take Profit Alert signals. - This Indicator never recalculates, Repaints, back Repaints, or Delays after bar is closed. - All Timeframes and Currency Pairs.
Indicator without redrawing Divergent MAX The DivirgentMAX indicator is a modification based on the MACD. The tool detects divergence based on OsMA and sends signals to buy or sell (buy|sell), taking into account the type of discrepancies detected. Important!!!! In the DivirgentMAX indicator, the optimal entry points are drawn using arrows in the indicator's basement. Divergence is also displayed graphically. In this modification of the MACD, the lag problem characteristic of its predecessor i
Kangaroo Tailz
Brenden Caleb Luebeck
Looking for an indicator that identifies high-probability price action patterns? Love counter-trend trading? The Kangaroo Tailz indicator might be just for you. This indicator is meant to be used as a reversal detector. I personally would rather enter a position at the beginning of a trend rather than catch the last couple of moves. This indicator does a good job of alerting when price may reverse by identifying price action patterns that occur frequently in markets. Even though this indicator i
Potential Reversal Price (PRP) Indicator - Ultimate Sniper Entries for XAUUSD Discounted   Price   !!     Secure your lifetime access   now   before it switches to   subscription-only ! Welcome to the   Potential Reversal Price (PRP) Indicator , your ultimate trading tool designed to catch high-probability market reversals with extreme precision. Built for serious traders who demand accuracy, the PRP Indicator combines advanced market structure analysis with momentum exhaustion to pinpoint the e
TouchGuard Alert – Advanced Price Alert & Notification Indicator for MetaTrader 4 (MT4) TouchGuard Alert   is a fast, lightweight, and highly accurate price-touch   Alert & Notification   system designed for   MetaTrader 4 (MT4)   and   MetaTrader 5 (MT5) . It automatically sends real-time   Alerts, Pop-Up Alerts, Email Notifications, Push Notifications   and early-warning notifications when price touches or approaches your chart objects. Key Features (High-Precision Alert & Notification System)
PABT Pattern Indicator - it's classical system one of the signal patterns. Indicator logic - the Hi & Lo of the bar is fully within the range of the preceding bar, look to trade them as pullback in trend. In the way if indicator found PABT pattern it's drawing two lines and arrow what showing trend way.  - First line - it's entry point and drawing at: 1. On the high of signal bar or on middle of the signal bar (depending from indicator mode) for buy; 2. On the low of signal bar or on middle of t
The Advanced Bands Squeeze indicator is a custom indicator based on the classic Bollinger Bands as created by John Bollinger. The Bollinger Band Squeeze occurs when volatility falls to low levels and the Bollinger Bands narrow. This low volatility level is called a “Squeeze”.  According to John Bollinger, periods of low volatility are often followed by periods of high volatility, where prices tend to move a lot in either direction. Therefore, a volatility contraction or narrowing of the bands
Indicador Taurus All4
Fabio Oliveira Magalhaes
Taurus All4 Taurus All4 is a high-performance indicator, it will tell you the strength of the trend, and you will be able to observe the strength of the candle. Our indicator has more than 4 trend confirmations. It is very simple and easy to use. Confirmation Modes Candle Trend Confirmations: When the candle switches to light green the trend is high. When the candle switches to light red the trend is reverting down. When the candle changes to dark red the trend is low. Trendline Trend Confirm
Signal Histogram è un indicatore tecnico affidabile per la piattaforma MetaTrader 4, progettato per identificare visivamente il trend attuale confrontando il prezzo di chiusura con una media mobile. L'indicatore visualizza l'istogramma in una finestra separata: le barre verdi indicano che il prezzo è superiore alla media, mentre le barre rosse indicano che il prezzo è inferiore o uguale alla media. Questo approccio consente di valutare rapidamente la direzione del trend e di identificare potenz
MACD Decision Tree
Thomas Bradley Butler
This indicator was constructed using decision trees.  I will only give a few insights into the algorithm since it is original. But there are 4 trees in the inputs and by default they are 10. The decision tree logic for buy signals is as follows: If the MACD line is less than  certain bullish divergence (determined by the "BUY_TREE_1" and "BUY_TREE_2" variables) The decision tree logic for sell signals is as follows: If the MACD line is greater than certain bearish divergence  (determined by the
Indicatore Crypto_Forex "FORCE Index FLAT Detector" - è un efficace strumento ausiliario per il trading! Nessun bisogno di ridisegnare. Ti offro di aggiornare i tuoi metodi di trading con questo fantastico indicatore per MT4. - L'indicatore mostra le aree piatte di prezzo sul grafico. Dispone di un parametro di "sensibilità piatta", responsabile del rilevamento del prezzo piatto. - "FORCE Index FLAT Detector" può essere utilizzato per confermare l'ingresso di Price Action o in combinazione con
The Moving Average Dashboard indicator allows you to see the relationship between a fast and a slow moving average. This indicator is working on multiple symbols and up to 21 timeframes. It's allows you to configure the fast and slow moving averages to whatever period, method or price is appropriate The Moving Average Dashboard saves you time as you can use the indicator to scan multiple currency pairs or other symbols in just one window. Installation Download the Indicator in your MT5 termi
Gli utenti di questo prodotto hanno anche acquistato
Neuro Poseidon MT4
Daria Rezueva
4.94 (31)
Neuro Poseidon is a new indicator by Daria Rezueva. It combines precise trading signals with adaptive TP/SL levels - creating best possible trades as a result! Message me and get  Neuro Poseidon Assistant  as a gift to automize your trading process! What makes it stand out? 1. Proven profitability on all assets and timeframes 2. Only confirmed BUY and SELL signals present on the chart 3. Adaptive TP & SL levels generated by the software for each trade 4. Easy to understand - suitable for all
Gann Made Easy
Oleg Rodin
4.84 (164)
Gann Made Easy è un sistema di trading Forex professionale e facile da usare che si basa sui migliori principi del trading utilizzando la teoria di mr. WD Gann. L'indicatore fornisce segnali ACQUISTA e VENDI accurati, inclusi i livelli di Stop Loss e Take Profit. Puoi fare trading anche in movimento utilizzando le notifiche PUSH. CONTATTAMI DOPO L'ACQUISTO PER RICEVERE GRATUITAMENTE LE ISTRUZIONI DI TRADING E OTTIMI INDICATORI EXTRA! Probabilmente hai già sentito parlare molte volte dei metodi d
Dynamic Forex28 Navigator
Bernhard Schweigert
4.43 (7)
Dynamic Forex28 Navigator - Lo strumento di trading Forex di nuova generazione. ATTUALMENTE SCONTATO DEL 49%. Dynamic Forex28 Navigator è l'evoluzione dei nostri indicatori popolari di lunga data, che combinano la potenza di tre in uno: Advanced Currency Strength28 Indicator (695 recensioni) + Advanced Currency IMPULSE con ALERT (520 recensioni) + CS28 Combo Signals (Bonus). Dettagli sull'indicatore https://www.mql5.com/en/blogs/post/758844 Cosa offre l'indicatore di forza di nuova generazione?
M1 Sniper
Oleg Rodin
5 (24)
M1 SNIPER è un sistema di indicatori di trading facile da usare. Si tratta di un indicatore a freccia progettato per l'intervallo temporale M1. L'indicatore può essere utilizzato come sistema autonomo per lo scalping sull'intervallo temporale M1 e come parte del tuo sistema di trading esistente. Sebbene questo sistema di trading sia stato progettato specificamente per il trading sull'intervallo temporale M1, può comunque essere utilizzato anche con altri intervalli temporali. Inizialmente ho pro
Scalper Inside PRO
Alexey Minkov
4.74 (68)
Scalper Inside PRO Scalper Inside PRO is an intraday trend and scalping indicator for MetaTrader 4 that uses an exclusive algorithm to quickly detect market direction and key target levels. It automatically calculates entry, exit and multiple profit targets, and shows detailed performance statistics so you can see how different instruments and strategies performed. This helps you choose the most suitable trading instruments for the current market conditions. Additionally, you can easily integrat
Enigmera
Ivan Stefanov
5 (8)
ENIGMERA: Il cuore del mercato Importante: La demo di MQL5.com funziona nel Strategy Tester e potrebbe non riflettere completamente le funzionalità di Enigmera. Consulta la descrizione, gli screenshot e il video per maggiori dettagli. Non esitare a inviarmi un messaggio se hai domande! Il codice dell'indicatore è stato completamente riscritto. La versione 3.0 aggiunge nuove funzionalità e corregge i bug accumulati dall'inizio dell'indicatore. Introduzione Questo indicatore e sistema di trading
KT Alpha Hunter Arrows MT4
KEENBASE SOFTWARE SOLUTIONS
La maggior parte degli indicatori a frecce ti dà un segnale e poi ti lascia capire da solo tutto il resto. KT Alpha Hunter Arrows ti offre un piano di trading completo. Ogni freccia di segnale viene visualizzata con un piano già tracciato: linea di ingresso, stop loss, quattro livelli di take profit e un verdetto edge in tempo reale che ti indica se quel simbolo e quel timeframe meritano di essere tradati in quel momento. Il pacchetto include un Trade Manager EA che gestisce l’esecuzione dopo il
Neo Wave PRO
Nikolay Raykov
5 (1)
Price & Time Market Structure Indicator A professional market structure tool that analyzes waves through both price and time — not price alone. Main Description NeoWave PRO is a professional market structure indicator for MetaTrader 4 designed for traders who want to move beyond traditional one-dimensional wave tools such as ZigZag, swing indicators, and basic high/low systems. Most wave indicators analyze only one thing: Price. But a real market wave is not only a price movement. A true wave de
PRO Renko System
Oleg Rodin
5 (30)
PRO Renko System è un sistema di trading altamente accurato appositamente progettato per il trading di grafici RENKO. Questo è un sistema universale che può essere applicato a vari strumenti di trading. Il sistema neutralizza efficacemente il cosiddetto rumore di mercato che consente di accedere a segnali di inversione accurati. L'indicatore è molto facile da usare e ha un solo parametro responsabile della generazione del segnale. Puoi facilmente adattare lo strumento a qualsiasi strumento di
Trend Lines PRO
Roman Podpora
5 (1)
LINEE DI TENDENZA PRO       Aiuta a capire dove il mercato sta realmente cambiando direzione. L'indicatore mostra reali inversioni di tendenza e punti in cui i principali attori rientrano. Vedi  Linee BOS   Cambiamenti di tendenza e livelli chiave su timeframe più ampi, senza impostazioni complesse o rumore inutile. I segnali non vengono ridisegnati e rimangono sul grafico dopo la chiusura della barra. VERSIONE MT 5     -      Svela il suo massimo potenziale se abbinato all'indicatore   RFI LEVE
Trend Catcher ind
Ramil Minniakhmetov
5 (2)
INDICATORE TREND CATCHER L'indicatore Trend Catcher analizza i movimenti dei prezzi di mercato, utilizzando una combinazione di indicatori di analisi del trend proprietari dell'autore e personalizzati. Identifica la vera direzione del mercato filtrando il rumore a breve termine e concentrandosi sulla forza del momentum sottostante, sull'espansione della volatilità e sul comportamento della struttura dei prezzi. Utilizza inoltre una combinazione di indicatori personalizzati di smoothing e filtr
Genesis Matrix Pro is a professional multi-timeframe trend detection indicator designed to help traders identify high-quality market alignment with clarity and structure. It combines 12 different technical indicators into one visual alignment matrix, allowing traders to quickly see when market conditions are bullish, bearish, or neutral. A signal is generated only when the selected strategies are aligned, helping reduce noise and improve decision-making. PLEASE CONTACT ME AFTER PURCHASE TO GET
Current event:  https://c.mql5.com/1/326/A2SR2025_NoMusic.gif R. Cos'è l'A2SR ?   * È un indicatore tecnico leader (nessuna riverniciatura, nessun ritardo). -- Guida : -- su https://www.mql5.com/en/blogs/post/734748/page4#comment_16532516 -- e https://www.mql5.com/en/users/yohana/blog A2SR ha una tecnica speciale per determinare i livelli di supporto (domanda) e resistenza (offerta). A differenza del modo ordinario che abbiamo visto in rete, A2SR ha un concetto originale nel determinare i li
PZ Trend Trading
PZ TRADING SLU
4.8 (5)
Capture every opportunity: your go-to indicator for profitable trend trading Trend Trading is an indicator designed to profit as much as possible from trends taking place in the market, by timing pullbacks and breakouts. It finds trading opportunities by analyzing what the price is doing during established trends. [ Installation Guide | Update Guide | Troubleshooting | FAQ | All Products ] Trade financial markets with confidence and efficiency Profit from established trends without getting whips
Step into the world of Forex trading with confidence, clarity, and precision using   Gold Indicator   a next-generation tool engineered to take your trading performance to the next level. Whether you’re a seasoned professional or just beginning your journey in the currency markets, Gold Indicator equips you with powerful insights and help you trade smarter, not harder. Built on the proven synergy of three advanced indicators, Gold Indicator focuses exclusively on medium and long-term trends eli
Questo prodotto è stato aggiornato per il mercato 2026 e ottimizzato per le ultime build di MT5. AVVISO DI AGGIORNAMENTO PREZZO: Smart Trend Trading System è attualmente disponibile a $99 . Il prezzo aumenterà a $199 dopo i prossimi 30 acquisti . OFFERTA SPECIALE: Dopo aver acquistato Smart Trend Trading System, inviami un messaggio privato per ricevere Smart Universal EA GRATIS e trasformare i tuoi segnali Smart Trend in operazioni automatiche. Smart Trend Trading System è un sistema di tradin
Scalper Vault
Oleg Rodin
5 (37)
Scalper Vault è un sistema di scalping professionale che ti fornisce tutto il necessario per scalping di successo. Questo indicatore è un sistema di trading completo che può essere utilizzato dai trader di forex e opzioni binarie. L'intervallo di tempo consigliato è M5. Il sistema fornisce segnali di freccia accurati nella direzione della tendenza. Ti fornisce anche i segnali più alti e più bassi e i livelli di mercato di Gann. Gli indicatori forniscono tutti i tipi di avvisi, comprese le notifi
PZ Swing Trading
PZ TRADING SLU
5 (3)
Protect against whipsaws: revolutionize your swing trading approach Swing Trading is the first indicator designed to detect swings in the direction of the trend and possible reversal swings. It uses the baseline swing trading approach, widely described in trading literature. The indicator studies several price and time vectors to track the aggregate trend direction and detects situations in which the market is oversold or overbought and ready to correct. [ Installation Guide | Update Guide | Tro
BTMM State Engine Pro is a MetaTrader 4 indicator for traders who use the Beat The Market Maker approach: Asian session context, kill zone timing, level progression, peak formation detection, and a multi-pair scanner from a single chart. It combines cycle state logic with a built-in scanner dashboard so you do not need the same tool on many charts at once. What it does Draws the Asian session range; session times can follow broker server offset or be set in inputs. Tracks level progression (L
L'indicatore " Dynamic Scalper System " è progettato per il metodo di scalping, ovvero per il trading all'interno di onde di trend. Testato sulle principali coppie di valute e sull'oro, è compatibile con altri strumenti di trading. Fornisce segnali per l'apertura di posizioni a breve termine lungo il trend, con ulteriore supporto al movimento dei prezzi. Il principio dell'indicatore. Le frecce grandi determinano la direzione del trend. Un algoritmo per generare segnali per lo scalping sotto fo
MonsterDash Harmonic Indicator is a harmonic pattern dashboard. It recognizes all major patterns. MonsterDash is a dashboard that displays all detected patterns for all symbols and (almost) all timeframes in sortable and scrollable format. Users can add their own user defined patterns . MonsterDash can open and update charts with the pattern found. Settings MonsterDash's default settings are good enough most of the time. Feel free to fine tune them to your needs. The color settings are for thos
Apollo SR Master è un indicatore di Supporto/Resistenza con caratteristiche speciali che rendono il trading con le zone di Supporto/Resistenza più semplice e affidabile. L'indicatore calcola le zone di Supporto/Resistenza in tempo reale senza alcun ritardo, rilevando i massimi e i minimi dei prezzi locali. Quindi, per confermare la nuova area SR formata, l'indicatore mostra un segnale speciale che segnala che la zona SR può essere presa in considerazione e utilizzata come un vero e proprio segna
Il rilevatore di terremoti del mercato  del sismografo. Description in English : https://www.mql5.com/en/market/product/113869?source=Site+Market+Product+Page#description How to use the Seismograph : https://www.mql5.com/en/market/product/113869#!tab=comments&page=2&comment=52806941 Create an EA : https://www.mql5.com/en/market/product/113869#!tab=comments&page=3&comment=52816509 Qualunque sia il modo in cui fai trading, vuoi assolutamente evitare di entrare nel mercato a bassa liquidità.
ATTUALMENTE SCONTATO DEL 40% La soluzione migliore per ogni principiante o trader esperto! Questo indicatore è uno strumento di trading unico, di alta qualità e conveniente perché abbiamo incorporato una serie di caratteristiche proprietarie e una nuova formula. Con un solo grafico è possibile leggere la forza delle valute per 28 coppie Forex! Immaginate come migliorerà il vostro trading perché sarete in grado di individuare l'esatto punto di innesco di una nuova tendenza o di un'opportunità
Auto Optimized Parabolic RSI: Motore di Momentum 3D Avanzato La maggior parte degli indicatori per trader privati fallisce perché si affida a parametri statici che smettono di funzionare nel momento in cui la volatilità del mercato cambia. Auto Optimized Parabolic RSI risolve il problema dell'"obsolescenza dell'indicatore" ricalcolando continuamente il proprio vantaggio matematico, portando un adattamento quantitativo di livello istituzionale direttamente sul tuo terminale MT5. Il Vantaggio Prin
Advanced Supply Demand
Bernhard Schweigert
4.91 (300)
Speciale Trading- SCONTO DEL 40% La soluzione migliore per qualsiasi trader principiante o esperto! Questo indicatore è uno strumento di trading unico, di alta qualità e conveniente, perché abbiamo incorporato una serie di funzionalità proprietarie e una nuova formula. Con questo aggiornamento, potrai visualizzare doppie zone di timeframe. Non solo potrai visualizzare un TF più alto, ma anche entrambi, il TF del grafico e il TF più alto: MOSTRA ZONE ANNIDATE. Tutti i trader che operano con Of
Questo indicatore funziona con la teoria delle onde di Elliott in due modi: Modalità automatica: In questa modalità, l'indicatore rileverà automaticamente le cinque onde motrici sul grafico in conformità alla teoria delle onde di Elliott. Fornirà previsioni e individuerà potenziali zone di inversione. Inoltre, avrà la capacità di generare avvisi e messaggi push per informare i trader sugli sviluppi importanti. Questa funzionalità automatica semplifica il processo di identificazione e analisi dei
Introduction to Fractal Pattern Scanner Fractal Indicator refers to the technical indicator that makes use of the fractal geometry found in the financial market. Fractal Pattern Scanner is the advanced Fractal Indicator that brings the latest trading technology after the extensive research and development work in the fractal geometry in the financial market. The most important feature in Fractal Pattern Scanner is the ability to measure the turning point probability as well as the trend probabi
Bull versus Bear
Mohamed Hassan
4.5 (18)
Send us a message after your purchase to receive more information on how to get your  BONUS  for FREE  that works in great combination with Bull vs Bear ! Bull versus Bear is an easy-to-use Forex indicator that gives traders clear and accurate signals based on clear trend retests . Forget about lagging indicators or staring at charts for hours because  Bull vs Bear provides real-time entries with no lag and no repaint, so you can trade with confidence. Bull vs Bear  helps you enter trades during
The Propfolio Master Suite is the ultimate all-in-one analytical workstation for professional traders. Combining the power of the Beat The Market Maker (BTMM) methodology, Smart Money Concepts (SND/Liquidity), and Advanced Volume Profile, this suite replaces multiple different indicators with one optimized engine. Monitor up to 14 pairs simultaneously from a single chart, instantly identify market cycles, and seamlessly map institutional footprints with the click of a button. The Command Center
Altri dall’autore
Never miss when a pair is being oversold or overbought again!! This RSI dashboard allows you to monitor RSI levels on 6 different time frames for up to 30 different currency pairs. This dashboard is packed with features including: 1. Monitoring of 6 customizable time frames (M1, M5, M15, M30, H1, H4, D1, W1, M1) 2. You can set the overbought/oversold levels you want for EACH time frame and they will be highlighted in the dashboard when a pair gets to that level 3. You can also set the RSI period
Filtro:
Nessuna recensione
Rispondi alla recensione