Congestion Breakout

CONGESTION BREAKOUT INDICATOR:

When you see a sideways price movement in a meaningless market, what goes through your mind? Is it a danger, an opportunity or completely a vacuum? Let's see if we can avoid the latter and focus on using it to our advantage.  The ability to read price action through the display of rectangles on the chart could be the boost you need to achieve your trading goals.

What is congestion?

Congestion is a market situation where the price is trading around a particular level without making progress in any direction. When there is a congestion, the market not only moves sideways, but also moves in a disorderly fashion, making price action erratic.

When does a congestion occur?

Congestion can occur before the announcement of an important piece of news, when traders are waiting for the news, or immediately after its release, when the market is trying to figure out what the impact will be.

It is also normal for congestion to occur during periods of indecision, such as at lunchtime. In this case, you may see the start of a sideways movement that ends when traders return to their desks to resume trading.

Market congestion often ends when the bulls or bears get the better of the others and the price moves out of the congestion zone, usually with high volume.

How to use congestion zones to trade?

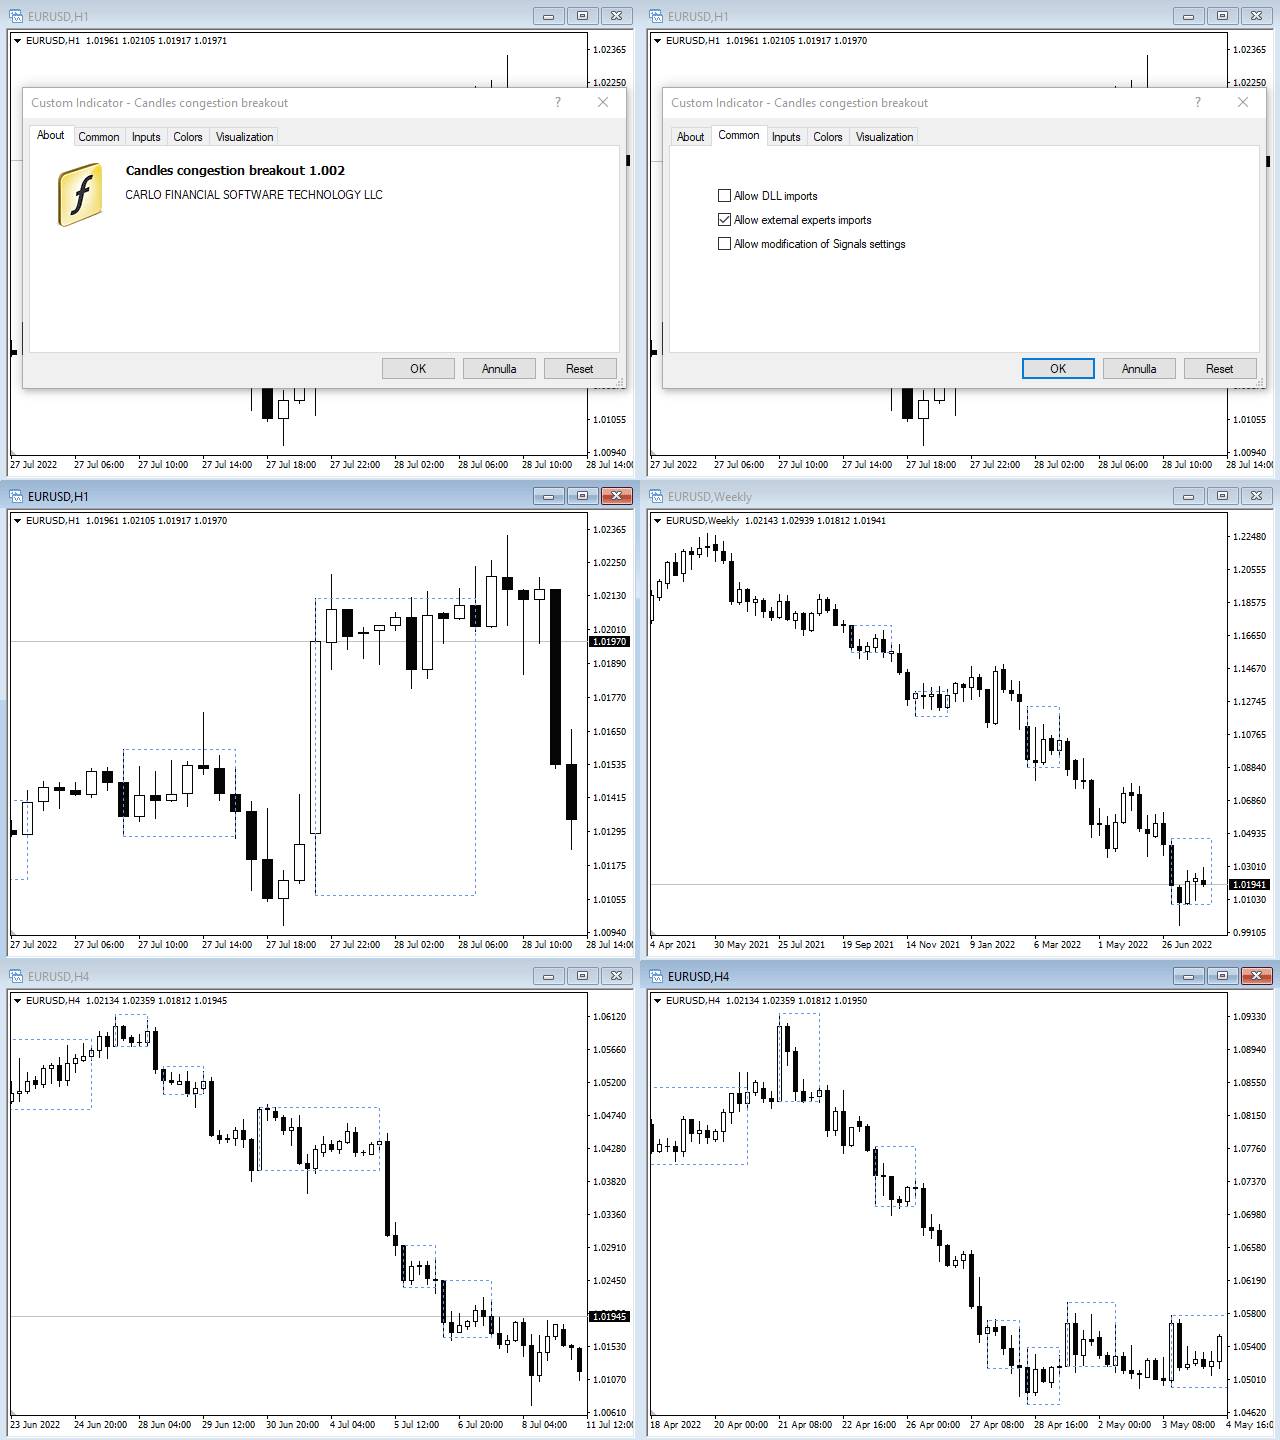
Congestion zones can be very useful for trading, which is where the Congestion Breakout Indicator comes in, a useful indicator that highlights these areas in all desired time frames.

·         Congestion zones as support and resistance:

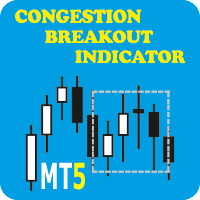
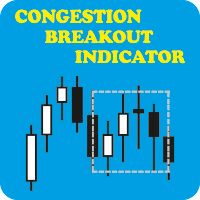
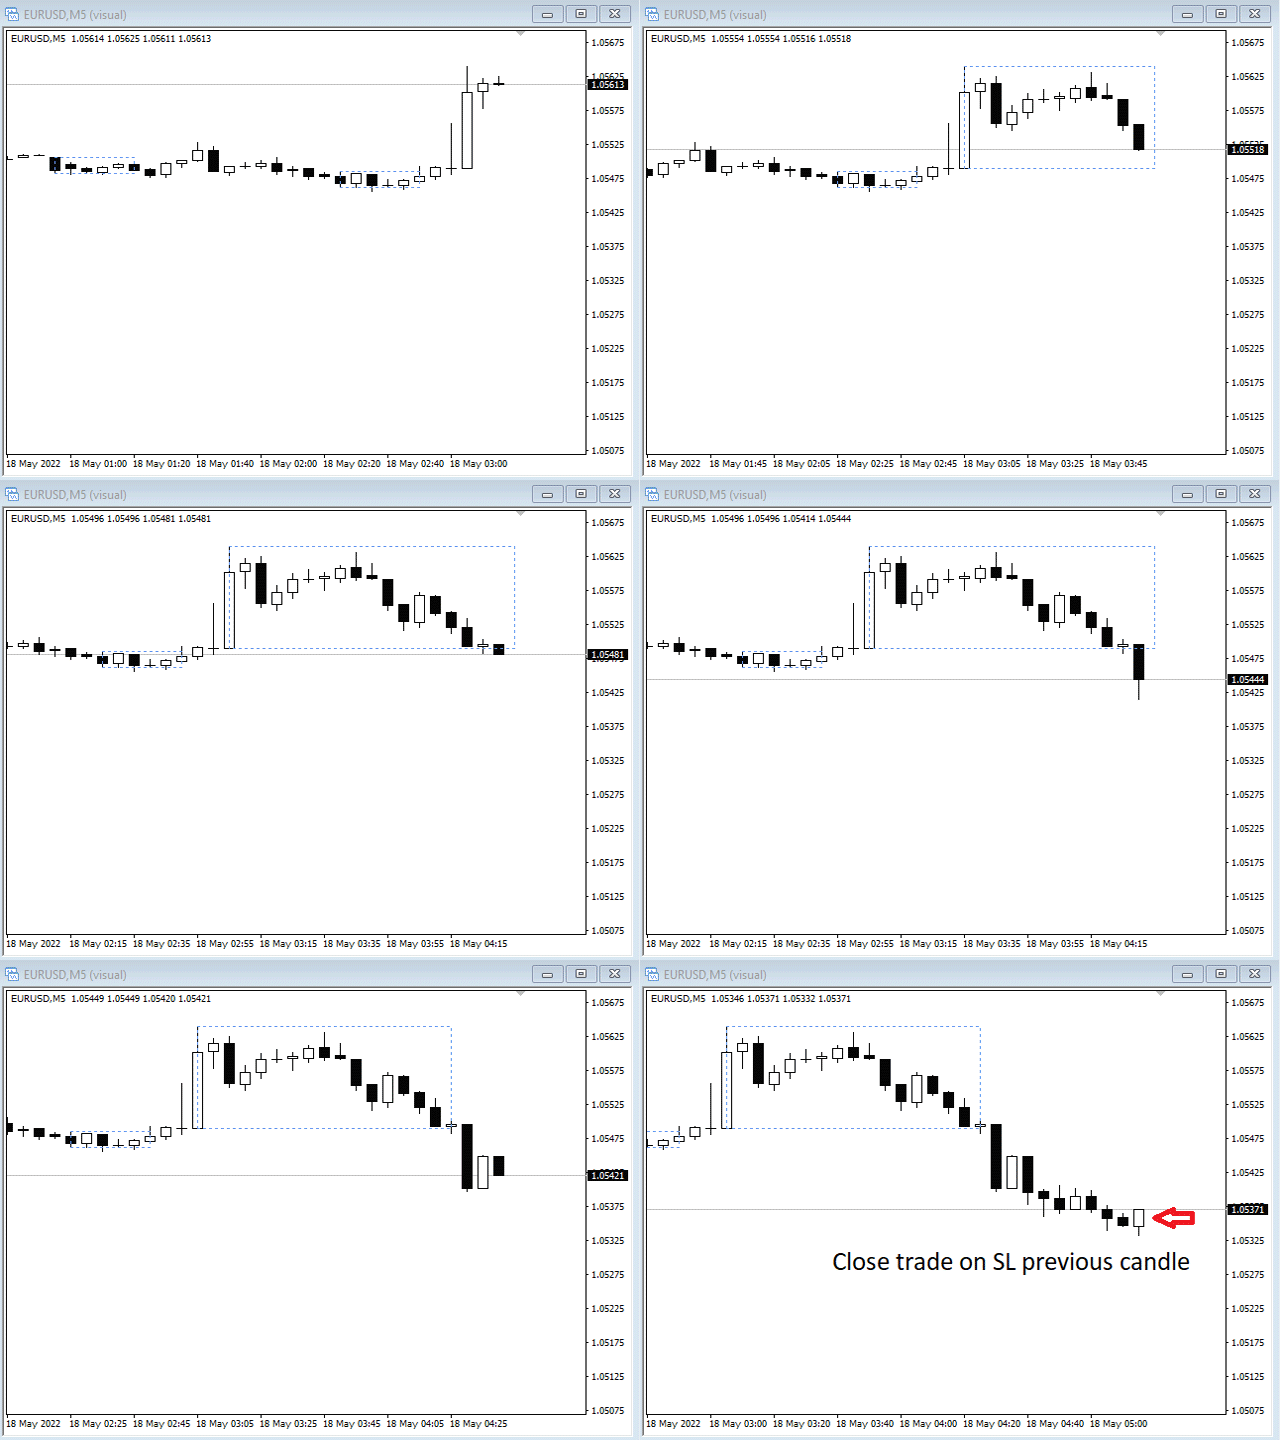
As a trader you should consider congestion zones as solid and highly reliable support and resistance zones; the indicator tracks the congestion area with a rectangle from the formation of the fourth bar to subsequent bars that have openings and closes, or only closes, within a previous larger candle (Measuring Bar).

·         Congestion zones for trading exits:

 Expect a price reaction in that zone whenever price reaches it and if, for example, you have managed to enter a trend early enough and secure a good profit, you can use price congestion signals to take some of your profits off the table.

·         The congestion zone as a potential entry point:

Furthermore, spotting the congestion allows you to anticipate the eventual breakout, although it is important to know that multiple false breakouts can occur. So do not trade until a reliable breakout occurs with clear signs of trend continuation.

Why use the congestion breakout indicator in combination with the Candles Trading Panel?

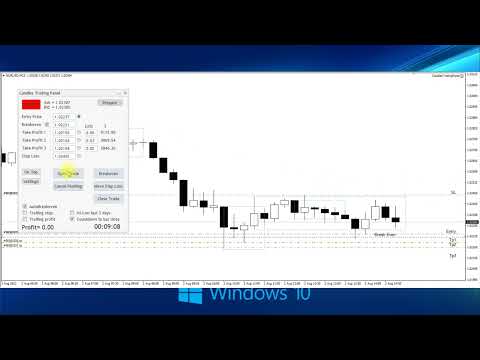
The combined use of this indicator and the Candles Trading Panel ( https://www.mql5.com/en/market/product/84104 ) allows you to minimise possible losses with a quick method to move the automatic Trailing Stop and Trailing Profit based on your analysis or with the ability to manually move the stop to breakeven if the trade does not immediately continue in the direction of the breakout within a specified time frame.

In addition, the congestion area display is a reference point for placing stop loss orders. Risk management is the key to successful trading and it is essential to enter a trade with stop loss orders already placed to protect your capital.

Instead, the efficient trailing profit method, within the Candles trading panel, will allow you to maximise your profits.

In any case, it is essential to have a trading plan and stick to it.

Key features:

·         Ability to highlight congestions in two modes:

-          open and close of successive bars within the bar

-          close of successive bars within the measuring bar (only_close)

·         Possibility to display nested congestions (flag_ congestion_in_congestion)

·         Customisation of indicator colour (clr_congestion)

·         Ability to receive Metaquotes ID alerts and messages when congestion breaks (send_MetaQuotes_ID_alert)

·         Ability to customise the number of ticks before the breakout to receive alerts (ticks_to_congestion_break)

Prodotti consigliati
Credible Cross System   indicator is designed for signal trading. This indicator generates trend signals. It uses many algorithms and indicators to generate this signal. It tries to generate a signal from the points with the highest trend potential. The indicator works based on instant price movements. This indicator is a complete trading product. This indicator does not need any additional indicators. The indicator certainly does not repaint. The point at which the signal is given does not c
This indicator is customized for binary option trading like M1 timeframe or turbo option trading. The way a binary option works is from the traders perspective is that you choose whether or not a certain underlying asset (a stock, commodity, currency etc.) is going to go up or down in a certain amount of time. You essentially bet money on this prediction. You are shown how much money up front you will earn if your prediction is correct. If your prediction is wrong, you lose your bet and the mone
The Th3Eng PipFinite indicator is based on a very excellent analysis of the right trend direction with perfect custom algorithms. It show the true direction and the best point to start trading. With StopLoss point and Three Take Profit points. Also it show the right pivot of the price and small points to order to replace the dynamic support and resistance channel, Which surrounds the price. And Finally it draws a very helpful Box on the left side on the chart includes (take profits and Stop loss
Fibonacci retracement and extension line drawing tool Fibonacci retracement and extended line drawing tool for MT4 platform is suitable for traders who use  golden section trading Advantages: There is no extra line, no too long line, and it is easy to observe and find trading opportunities Trial version: https://www.mql5.com/zh/market/product/35884 Main functions: 1. Multiple groups of Fibonacci turns can be drawn directly, and the relationship between important turning points can be seen
Pro Magic Signal   indicator is designed for signal trading. This indicator generates trend signals.  It uses many algorithms and indicators to generate this signal. It tries to generate a signal from the points with the highest trend potential. This indicator is a complete trading product. This indicator does not need any additional indicators.  The indicator certainly does not repaint. The point at which the signal is given does not change.  Thanks to the alert features you can get the signals
Embark on the pinnacle of Binary Options evolution. Our indicator isn't just adaptive—it's relentless. Picture a ninja riding a serpent, shadowing its every move; that's how this tool trails the market trend, unwavering till the end. Built upon the foundational prowess of the Ichimoku indicator and honed with an array of fine-tuned oscillators, it epitomizes accuracy and precision. Dive deep without getting lost in the Ichimoku's intricacies—our indicator simplifies the process for you. Perhaps
Signal trend indicator. Detects the direction of the trend and is coloured accordingly.  Has built in audible and visual alerts when trends change. Can send notifications to your phone or email. Allows Trend and Counter-Trend trading. Works on all timeframes, all currency pairs, metals, indices and cryptocurrencies. Can be used with binary options. Distinctive features No re-drawing; Simple and clear settings; Four types of alerts; Works on all timeframes and all trading tools; Suitable
The   True Magic Oscillator   indicator is designed for signal trading. This indicator generates trend signals. It uses many algorithms and indicators to generate this signal. It tries to generate signals from the points with the highest trend potential. This indicator is a complete trading product. This indicator does not need any additional indicators. The indicator is never repainted. The point at which the signal is given does not change.         Features and Recommendations Works wit
This   Rattling Signal Point   indicator is designed for signal trading. This indicator generates trend signals. It uses many algorithms and indicators to generate this signal. It tries to generate signals from the points with the highest trend potential. This indicator is a complete trading product. This indicator does not need any additional indicators. The indicator is never repainted. The point at which the signal is given does not change. When the signal comes the arrows are put back on
Happy Scalping Indicator
Leandro Bernardez Camero
Questo indicatore è stato progettato per uno scalping aggressivo e per entrate rapide nelle opzioni binarie , generando segnali su ogni candela in modo da sapere esattamente cosa sta succedendo in ogni momento. Unisciti al canale Happy Scalping: MQL5 Non ripinta : il segnale della candela attuale viene generato in tempo reale , il che significa che può cambiare mentre la candela è ancora in formazione, a seconda che il prezzo salga o scenda rispetto alla chiusura della candela precedente. Tutt
Entry Signal Arrows   indicator is designed for signal trading. This indicator generates trend signals.  It uses many algorithms and indicators to generate this signal. It tries to generate a signal from the points with the highest trend potential. This indicator is a complete trading product. This indicator does not need any additional indicators.  The indicator certainly does not repaint. The point at which the signal is given does not change.  Thanks to the alert features you can get the sign
This indicator monitors the market for a flat state and possible breakout. The flat state is detected as a predefined number of consecutive bars during which price fluctuates inside a small range. If one of the next bars closes outside the range, breakout is signaled. The indicator shows 3 lines: blue - upper bound of flat ranges AND consecutive breakout areas; red - lower bound of flat ranges AND consecutive breakout areas; yellow - center of flat ranges (NOT including breakout areas). When a b
Happy Trend Arrow
Muhammed Emin Ugur
This   Happy Trend Arrow   indicator is designed for signal trading. This indicator generates trend signals. It uses many algorithms and indicators to generate this signal. It tries to generate signals from the points with the highest trend potential. This indicator is a complete trading product. This indicator does not need any additional indicators. The indicator is never repainted. The point at which the signal is given does not change.       Features and Recommendations Time Frame: H1
Real Pro Signal
Muhammed Emin Ugur
Real Pro Signal   indicator is designed for signal trading. This indicator generates trend signals. It uses many algorithms and indicators to generate this signal. It tries to generate a signal from the points with the highest trend potential. This indicator is a complete trading product. This indicator does not need any additional indicators. The indicator certainly does not repaint. The point at which the signal is given does not change.     Features and Suggestions Time Frame: H1 Works
The indicator shows you buy/sell signals and does not repaint. It works well with almost all pairs, while the best ones are GBPUSD, XAUUSD and EURUSD. The product works better on H1 and H4. You can change the parameters in the inputs tab to get the best signals and the best trade results on each pair. You can enable/disable alerts when signal appears. The indicator is easy to use. Parameters barstrip & Sensitive: amount of bars to process the highest and lowest prices (relates to the internal l
We present you the indicator "Candle closing counter", which will become your indispensable assistant in the world of trading. That’s why knowing when the candle will close can help: If you like to trade using candle patterns, you will know when the candle will be closed. This indicator will allow you to check if a known pattern has formed and if there is a possibility of trading. The indicator will help you to prepare for market opening and market closure. You can set a timer to create a pre
Heiken Ashi candle chart is an improved version of The Japanese candle chart, which can effectively filter the market "noise" of the Japanese candle chart. It is favored by many traders for its simplicity and intuition. For trend traders, the HA candle chart is a magic tool. Unlike the traditional Japanese candle chart, Heikenashi does not reflect the opening price, high price, low price and closing price of the market. Instead, Heikenashi calculates the value of a single K line in the dominant
QuantumEdge Trader
Hossam Ali Ahmed Ali
QuantumEdge Trader v1.0 AI-Powered Precision Signals for Serious Traders QuantumEdge Trader is a smart and reliable indicator that delivers accurate BUY and SELL signals using advanced market analysis and trend detection. Designed for M1 to M60 timeframes, it's ideal for scalping and intraday strategies. --- Key Features: No Repaint – Signals never change after appearing Smart trend filters to reduce noise Adjustable sensitivity and alerts Perfect for XAUUSD, EURUSD, and m
Infinity Trend Pro
Yaroslav Varankin
1 (1)
This is a trend indicator without redrawing Developed instead of the binary options strategy (by the color of the Martingale candlestick) Also works well in forex trading When to open trades (binary options) A signal will appear in the place with a candle signaling the current candle It is recommended to open a deal for one candle of the current timeframe M1 and M5 When a blue dot appears, open a deal up When a red dot appears, open a trade down. How to open trades on Forex. When a signal is rec
Great Strong System   indicator is designed for signal trading. This indicator generates trend signals. It uses many algorithms and indicators to generate this signal. It tries to generate a signal from the points with the highest trend potential. This indicator is a complete trading product. This indicator does not need any additional indicators. The indicator certainly does not repaint. The point at which the signal is given does not change.     Features and Suggestions Time Frame: H1 Wo
The Strategy Tester product is an indicator where you can both test and run strategies. There are 64 strategies in total in this indicator. It uses 3 indicators. You can test tens of thousands of strategies by changing the parameter settings of these indicators. You can run 6 strategies at the same time. With this product, you will now create your own signals. Recommendations and Features Used indicators: Stochastic, Macd, Williams Percent Range It works on all time frame   Recommended time fr
Automated Trendlines
Georgios Kalomoiropoulos
5 (16)
Le linee di tendenza sono lo strumento più essenziale di analisi tecnica nel forex trading. Sfortunatamente, la maggior parte dei trader non li disegna correttamente. L'indicatore automatizzato delle linee di tendenza è uno strumento professionale per i trader seri che ti aiuta a visualizzare il movimento di tendenza dei mercati. Esistono due tipi di linee di tendenza, linee di tendenza rialziste e linee di tendenza ribassiste. Nella tendenza rialzista, la linea di tendenza Forex viene tracci
The indicator is created for professional trading by Fibonacci levels. AutoFiboLevels plots Fibonacci retracement and extension levels on impulse and corrective wave. The indicator unambiguously interprets a market situation. Points of extremum for level plotting are calculated using fractal analysis. A trader can independently set retracement and extension levels and calculation time frame adjusting the indicator for various strategies. Parameters: WorkTF - time frame for indicator calculation
Color Stochastic Enhanced Stochastic Oscillator with Cross Detection and Visual Signal Support Overview Color Stochastic is a customized version of the classic Stochastic Oscillator designed for momentum analysis and crossover visualization. The indicator provides color-based signal marking and configurable crossover detection at user-defined overbought and oversold levels. It can be used as part of: Momentum analysis Mean reversion workflows DCA-based strategies Multi-indicator confirmation sys
Cosmic Diviner X Planet
Olena Kondratenko
4 (2)
This unique multi-currency strategy simultaneously determines the strength of trends and market entry points, visualizing this using histograms on the chart. The indicator is optimally adapted for trading on the timeframes М5, М15, М30, Н1. For the convenience of users, the indicator renders the entry point (in the form of an arrow), recommended take profit levels (TP1, TP2 with text labels) and the recommended Stop Loss level. The take profit levels (TP1, TP2) are automatically calculated for
Magic Super Signal   indicator is designed for signal trading. This indicator generates trend signals.  It uses many algorithms and indicators to generate this signal. It tries to generate a signal from the points with the highest trend potential. This indicator is a complete trading product. This indicator does not need any additional indicators.  The indicator certainly does not repaint. The point at which the signal is given does not change.  Thanks to the alert features you can get the sign
Signal Tower   indicator is designed for signal trading. This indicator generates trend signals. It uses many algorithms and indicators to generate this signal. It tries to generate a signal from the points with the highest trend potential. This indicator is a complete trading product. This indicator does not need any additional indicators. The indicator certainly does not repaint. The point at which the signal is given does not change. The indicator has a pips counter. You can see how many
Renko, Heiken Ashi, Ticks Bar, Range Bar.    Easy switching, easy setup, all in one window.        Place the Custom Chart indicator and view Renko, Heiken Ashi, Tick bar, Range bar charts in real time at real chart.    Position the offline chart window so that the indicator control panel is visible.    Switch the chart mode by click of a button.    Connect to the output chart any indicator, expert advisor without any restrictions.    No, it doesn't work in the tester.    Yes, you can use an
VR Cub
Vladimir Pastushak
VR Cub è un indicatore per ottenere punti di ingresso di alta qualità. L'indicatore è stato sviluppato per facilitare i calcoli matematici e semplificare la ricerca dei punti di ingresso in una posizione. La strategia di trading per la quale è stato scritto l'indicatore ha dimostrato la sua efficacia per molti anni. La semplicità della strategia di trading è il suo grande vantaggio, che consente anche ai trader alle prime armi di commerciare con successo con essa. VR Cub calcola i punti di apert
"Dynamic Scalping Oscillator" - è un indicatore Crypto_Forex personalizzato avanzato - uno strumento di trading efficiente per MT4! - Nuova generazione di oscillatori - guarda le immagini per vedere come usarlo. - L'oscillatore Dynamic Scalping ha zone di ipervenduto/ipercomprato adattive. - L'oscillatore è uno strumento ausiliario per trovare punti di ingresso esatti dalle aree dinamiche di ipervenduto/ipercomprato. - Valori di ipervenduto: sotto la linea verde, valori di ipercomprato: sopra l
Gli utenti di questo prodotto hanno anche acquistato
Trend SniperX MT4
Sarvarbek Abduvoxobov
5 (4)
Trend Sniper X è un indicatore di trend-following multi-timeframe per MetaTrader 5 che aiuta i trader a identificare la direzione del trend e i potenziali punti di inversione con chiarezza e precisione. Per MT5: https://www.mql5.com/en/market/product/181101 Informazioni sul prezzo: Il prezzo attuale è promozionale ed è soggetto a modifiche con il rilascio dei prossimi aggiornamenti e nuove funzionalità. Canale Code2Profit Domina il mercato con l'analisi multi-timeframe! Come massimizzare il tuo
Tokyo mt4 Indicator
Vasiliy Strukov
5 (2)
Il Tokyo Indicator offre una chiara panoramica visiva della direzione del trend, dei potenziali segnali di trading e delle condizioni di mercato. La sua linea di trend a gradini, codificata a colori, distingue le fasi rialziste (in blu) da quelle ribassiste (in magenta). Frecce direzionali dedicate evidenziano potenziali opportunità di acquisto e vendita al variare del trend visualizzato. Una dashboard integrata riunisce in un'unica visualizzazione pratica il segnale corrente, il bias di mercato
SR Liquidity
Oleg Rodin
5 (2)
SR Liquidity è un indicatore di trading progettato per individuare le zone nascoste in cui si concentra la liquidità di mercato e dove il prezzo reagisce con maggiore intensità. Queste aree di liquidità agiscono come potenti livelli di supporto e resistenza, offrendo una mappa chiara dei punti in cui è più probabile che il mercato inverta la propria direzione. Invece di tracciare le classiche linee di supporto e resistenza, SR Liquidity analizza l'effettivo comportamento dei prezzi per individua
PRO Renko System
Oleg Rodin
5 (31)
PRO Renko System è un sistema di trading altamente accurato appositamente progettato per il trading di grafici RENKO. Questo è un sistema universale che può essere applicato a vari strumenti di trading. Il sistema neutralizza efficacemente il cosiddetto rumore di mercato che consente di accedere a segnali di inversione accurati. L'indicatore è molto facile da usare e ha un solo parametro responsabile della generazione del segnale. Puoi facilmente adattare lo strumento a qualsiasi strumento di
Gann Made Easy
Oleg Rodin
4.84 (172)
Gann Made Easy è un sistema di trading Forex professionale e facile da usare che si basa sui migliori principi del trading utilizzando la teoria di mr. WD Gann. L'indicatore fornisce segnali ACQUISTA e VENDI accurati, inclusi i livelli di Stop Loss e Take Profit. Puoi fare trading anche in movimento utilizzando le notifiche PUSH. CONTATTAMI DOPO L'ACQUISTO PER RICEVERE GRATUITAMENTE LE ISTRUZIONI DI TRADING E OTTIMI INDICATORI EXTRA! Probabilmente hai già sentito parlare molte volte dei metodi d
CRT Candle Range Theory HTF MT4 - Ultimate CRT Indicator: Concetti ICT avanzati e sistema di trading Malaysian SnR Padroneggia le orme dei Market Maker con l'indicatore Candle Range Theory più avanzato. Sblocca il vero potere degli Smart Money Concepts (SMC) e fai trading con la stessa precisione delle istituzioni grazie all'Ultimate CRT Indicator. Costruito esclusivamente per i trader seri, questo indicatore automatizza la teoria CRT, un pilastro centrale dei Concetti ICT (Inner Circle Trader),
Miraculous Indicator Binary & Forex v3 StrategySafe Miraculous Indicator Binary & Forex v3 StrategySafe è un indicatore professionale progettato per trader che cercano segnali chiari, strumenti di conferma avanzati e un metodo strutturato per operare sui mercati Binary e Forex. La versione v3 include MIR Dashboard, Miraculous Confirmation Dashboard, GANN Law, livelli Square of 9, angoli GANN e una modalità Forex più completa per un’analisi di mercato più precisa. Caratteristiche principali Modal
PTS Precision Index Oscillator V2
PrecisionTradingSystems
5 (1)
L'Oscillatore dell'Indice di Precisione (Pi-Osc) di Roger Medcalf di Precision Trading Systems La Versione 2 è stata attentamente rielaborata per essere estremamente veloce nel caricarsi sul tuo grafico e sono state apportate alcune altre migliorie tecniche per migliorare l'esperienza. Il Pi-Osc è stato creato per fornire segnali di sincronizzazione del trading accurati progettati per individuare punti di esaurimento estremi, i punti ai quali i mercati vengono costretti a recarsi solo per eli
Smart Trend Trading System è un indicatore per MetaTrader 4 che riunisce informazioni sul trend, segnali di entrata e uscita e livelli di prezzo in un unico grafico. Combina più di 10 strumenti di trading in un unico sistema, inclusi rilevamento del trend, zone di inversione, Smart Cloud, logica di trailing stop, supporto e resistenza, colorazione delle candele, avvisi e analisi multi-timeframe. Il sistema è progettato per aiutarti a operare in diverse condizioni di mercato: Mercati in trend: I
Currency Strength Wizard è un indicatore molto potente che ti fornisce una soluzione all-in-one per un trading di successo. L'indicatore calcola la potenza di questa o quella coppia forex utilizzando i dati di tutte le valute su più intervalli di tempo. Questi dati sono rappresentati in una forma di indice di valuta facile da usare e linee elettriche di valuta che puoi utilizzare per vedere il potere di questa o quella valuta. Tutto ciò di cui hai bisogno è collegare l'indicatore al grafico che
M1 Sniper
Oleg Rodin
4.97 (30)
M1 SNIPER è un sistema di indicatori di trading facile da usare. Si tratta di un indicatore a freccia progettato per l'intervallo temporale M1. L'indicatore può essere utilizzato come sistema autonomo per lo scalping sull'intervallo temporale M1 e come parte del tuo sistema di trading esistente. Sebbene questo sistema di trading sia stato progettato specificamente per il trading sull'intervallo temporale M1, può comunque essere utilizzato anche con altri intervalli temporali. Inizialmente ho pro
Volume Break Oscillator è un indicatore che abbina il movimento dei prezzi con le tendenze del volume sotto forma di oscillatore. Volevo integrare l'analisi del volume nelle mie strategie, ma sono sempre stato deluso dalla maggior parte degli indicatori di volume, come OBV, Money Flow Index, A/D ma anche come Volume Weighted Macd e molti altri. Ho quindi scritto questo indicatore per me stesso, sono soddisfatto di quanto sia utile e quindi ho deciso di pubblicarlo sul mercato. Caratteristiche
Atomic Analyst
Issam Kassas
5 (13)
Atomic Analyst — MetaTrader 4 Per domande sul prodotto, indicazioni sulla configurazione o supporto tecnico, scrivimi direttamente qui su MQL5. L’indicatore trasforma calcoli complessi del mercato in semplici segnali visivi, candele colorate, letture del trend, livelli di stop-loss e diverse zone di take-profit che i trader possono capire rapidamente e usare in condizioni reali di mercato. Principali utilizzi di trading: Scalping e trading intraday: Progettato per decisioni rapide, frecce chiar
Scalper Vault
Oleg Rodin
5 (39)
Scalper Vault è un sistema di scalping professionale che ti fornisce tutto il necessario per scalping di successo. Questo indicatore è un sistema di trading completo che può essere utilizzato dai trader di forex e opzioni binarie. L'intervallo di tempo consigliato è M5. Il sistema fornisce segnali di freccia accurati nella direzione della tendenza. Ti fornisce anche i segnali più alti e più bassi e i livelli di mercato di Gann. Gli indicatori forniscono tutti i tipi di avvisi, comprese le notifi
PZ Swing Trading
PZ TRADING SLU
5 (4)
Protect against whipsaws: revolutionize your swing trading approach Swing Trading is the first indicator designed to detect swings in the direction of the trend and possible reversal swings. It uses the baseline swing trading approach, widely described in trading literature. The indicator studies several price and time vectors to track the aggregate trend direction and detects situations in which the market is oversold or overbought and ready to correct. [ Installation Guide | Update Guide | Tro
Introduction to Fractal Pattern Scanner Fractal Indicator refers to the technical indicator that makes use of the fractal geometry found in the financial market. Fractal Pattern Scanner is the advanced Fractal Indicator that brings the latest trading technology after the extensive research and development work in the fractal geometry in the financial market. The most important feature in Fractal Pattern Scanner is the ability to measure the turning point probability as well as the trend probabi
This is a professional chart indicator designed for traders focused on stability and clear price action. It helps filter market noise and provides clear visual entry and exit zones for your trading decisions. Core Features: Strictly Non-Repainting: The system is built with strict non-repaint logic. What you see on the chart is the true historical performance. Confirmed Signals: Signals are triggered and confirmed only after the candle closes . Once a trading arrow appears on a closed candle, it
Advanced Supply Demand
Bernhard Schweigert
4.91 (302)
Speciale Trading- SCONTO DEL 30% La soluzione migliore per qualsiasi trader principiante o esperto! Questo indicatore è uno strumento di trading unico, di alta qualità e conveniente, perché abbiamo incorporato una serie di funzionalità proprietarie e una nuova formula. Con questo aggiornamento, potrai visualizzare doppie zone di timeframe. Non solo potrai visualizzare un TF più alto, ma anche entrambi, il TF del grafico e il TF più alto: MOSTRA ZONE ANNIDATE. Tutti i trader che operano con Of
Trend Catcher ind
Ramil Minniakhmetov
5 (11)
INDICATORE TREND CATCHER L'indicatore Trend Catcher analizza i movimenti dei prezzi di mercato, utilizzando una combinazione di indicatori di analisi del trend proprietari dell'autore e personalizzati. Identifica la vera direzione del mercato filtrando il rumore a breve termine e concentrandosi sulla forza del momentum sottostante, sull'espansione della volatilità e sul comportamento della struttura dei prezzi. Utilizza inoltre una combinazione di indicatori personalizzati di smoothing e filtr
DayTrader PRO MT4
Davit Beridze
4.6 (10)
DayTrader PRO MT5:  https://www.mql5.com/en/market/product/186222 DayTrader PRO è un indicatore di trading avanzato che combina il filtro Laguerre di John Ehlers con un potente motore di auto-ottimizzazione. Invece di utilizzare parametri fissi, l'indicatore ricerca automaticamente le migliori impostazioni in base alle condizioni recenti del mercato, aiutandoti ad adattarti alla volatilità variabile senza costanti aggiustamenti manuali. L'indicatore genera segnali chiari di ACQUISTO (BUY) e VEND
Apollo SR Master è un indicatore di Supporto/Resistenza con caratteristiche speciali che rendono il trading con le zone di Supporto/Resistenza più semplice e affidabile. L'indicatore calcola le zone di Supporto/Resistenza in tempo reale senza alcun ritardo, rilevando i massimi e i minimi dei prezzi locali. Quindi, per confermare la nuova area SR formata, l'indicatore mostra un segnale speciale che segnala che la zona SR può essere presa in considerazione e utilizzata come un vero e proprio segna
ATTUALMENTE SCONTATO DEL 40% La soluzione migliore per ogni principiante o trader esperto! Questo indicatore è uno strumento di trading unico, di alta qualità e conveniente perché abbiamo incorporato una serie di caratteristiche proprietarie e una nuova formula. Con un solo grafico è possibile leggere la forza delle valute per 28 coppie Forex! Immaginate come migliorerà il vostro trading perché sarete in grado di individuare l'esatto punto di innesco di una nuova tendenza o di un'opportunità
Top Bottom Tracker è un indicatore basato su sofisticati algoritmi che analizza l'andamento del mercato ed è in grado di rilevare i massimi e i minimi del trend / Versione MT5 . Il prezzo aumenterà progressivamente fino a raggiungere i 500$. Prossimo prezzo --> 99$ Caratteristiche Nessuna riverniciatura Questo indicatore non cambia i suoi valori all'arrivo di nuovi dati Coppie di trading Tutte le coppie forex Timeframe Tutti i timeframe Parametri ==== Configurazione dell'indicatore ====
KURAMA GOLD SIGNAL PRO (MT4) — Filtro a 7 livelli · TP/SL automatico · Punteggio di qualità · Salvataggio dello storico dei segnali | Sistema di trading completo per XAUUSD Nessun ridisegno (repaint) in tempo reale. Nell'istante in cui appare un segnale, freccia, ingresso, TP e SL vengono bloccati sul posto e non si spostano mai più. Ciò che fai tradare è proprio questo segnale in tempo reale. E nella v7.20, ogni segnale realmente inviato viene salvato automaticamente e ripristinato con esattez
Scalping Points Pro is an indicator that shows possible price reversal points on the chart and does not redraw its signals. Also, the indicator sends signals to the trader via Email and Push. The accuracy of the signals of this indicator is approximately 92-94% on the M5 timeframe and more than 95% on the H1 timeframe. Thus, this indicator allows the trader to accurately open trades and predict further price movement. The indicator does not redraw its signals.  The indicator works on timeframe
SISTEMA DI REVERSAL IN SOTTOFINESTRA ARTEMIS è un potente indicatore Forex senza repaint, progettato per identificare operazioni di inversione ad alta probabilità utilizzando una combinazione di Smart Money Concepts (concetti di denaro intelligente) e analisi del momentum stocastico. Sviluppato per trader che cercano ingressi precisi, questo indicatore combina la rilevazione dei liquidity sweep, i cambiamenti della struttura di mercato e la conferma del momentum in un unico strumento di trading
Currency Strength Matrix
Raymond Gilmour
4.5 (26)
THE ONLY CURRENCY STRENGTH INDICATOR BUILT ON PRICE ACTION Most currency strength meters average an oscillator, or measure how far price has travelled. But these are not accurate measures of trend, Currency Strength Matrix measures trend strength, not just if a currency price has gone up or down. Currency Strength Matrix reads market structure . For each of the 28 major pairs it finds the confirmed cycle highs and lows, and decides whether that pair is in an uptrend, a downtrend, or neither. A
ATTUALMENTE SCONTATO DEL 40%! La soluzione migliore per ogni principiante o trader esperto! Questo indicatore è uno strumento di trading unico, di alta qualità e conveniente perché abbiamo incorporato una serie di caratteristiche proprietarie e una formula segreta. Con un solo grafico fornisce avvisi per tutte le 28 coppie di valute. Immaginate come migliorerà il vostro trading perché sarete in grado di individuare l'esatto punto di innesco di una nuova tendenza o opportunità di scalping! Co
Domina l'apertura del mercato con l'indicatore definitivo Opening Range Breakout (ORB) per MT4! L' Opening Range Breakout (ORB) è una delle strategie di day trading più potenti e collaudate utilizzate dai trader professionisti di tutto il mondo. Questo indicatore automatizza completamente il processo di identificazione, mappatura e tracciamento dei range di apertura per le tre principali sessioni forex (Asiatica, Londra e New York), offrendoti un enorme vantaggio nel catturare movimenti giornali
Introduction Harmonic Patterns are best used to predict potential turning point. Traditionally, Harmonic Pattern was identified manually connecting peaks and troughs points in the chart. Manual harmonic pattern detection is painfully tedious and not suitable for everyone. You are often exposed under subjective pattern identification with manual pattern detection. To avoid these limitations, Harmonic Pattern Plus was designed to automate your harmonic pattern detection process. The functionality
Altri dall’autore
Screener Breakout Congestion
CARLO FINANCIAL SOFTWARE TECHNOLOGY LLC
5 (2)
Screener Breakout Congestion: Vi è mai capitato di perdere un'opportunità di trading perché non stavate osservando il grafico di quel mercato in quello specifico time frame? Ecco questo screener vi aiuterà a identificare i breakout delle congestioni nei mercati che volete seguire nei diversi time frame richiesti. Una volta identificati i mercati (forex, indici, CFDs) e i diversi time frame (1M, 5M, 15M, 30M, 1H, 4H, Daily), lo screener è rappresentato da diversi bottoni che cambiano colore quand
FREE
Candles trading panel
CARLO FINANCIAL SOFTWARE TECHNOLOGY LLC
Candles Trading Panel Take the training wheels off and start pedaling when inserting orders! Using the Candlestick Trading Panel you can trade with one click from the chart and place your order at a precise point on the chart with different take profits for efficient money management through lots differentiation. The effective trailing stop loss strategy will enable you to keep risk management under control, and the innovative trailing profit strategy will maximize your profits by following tren
Congestion Breakout MT5
CARLO FINANCIAL SOFTWARE TECHNOLOGY LLC
3 (1)
Vi proponiamo "Congestion Breakout MT5", l'indicatore che vi aiuta a identificare le zone di congestione nel vostro grafico e vi avvisa quando il prezzo le attraversa. I trader sanno che le zone di congestione possono essere aree chiave dell'azione dei prezzi e indicare potenziali punti di svolta nel mercato. Tuttavia, individuare queste zone e anticipare i breakout può essere un compito difficile e dispendioso in termini di tempo. È qui che entra in gioco "Congestion Breakout".   Questo potente
Super Trend Plus
CARLO FINANCIAL SOFTWARE TECHNOLOGY LLC
Super Trend Plus   L'indicatore descritto è un sistema di trading che utilizza quattro Supertrend settati con diversi parametri. L'idea alla base di questo sistema è che quando tre Supertrend si muovono nella stessa direzione, si ha una forte conferma del trend, ma l'ingresso avviene solo quando anche il quarto Supertrend si muove nella stessa direzione degli altri tre. Ad esempio, si potrebbe utilizzare il primo Supertrend con un coefficiente moltiplicatore della volatilità di 3 e un periodo d
Filtro:
Bruno Tanzi
274
Bruno Tanzi 2023.03.20 19:50 

L'utente non ha lasciato alcun commento sulla valutazione.

Rispondi alla recensione