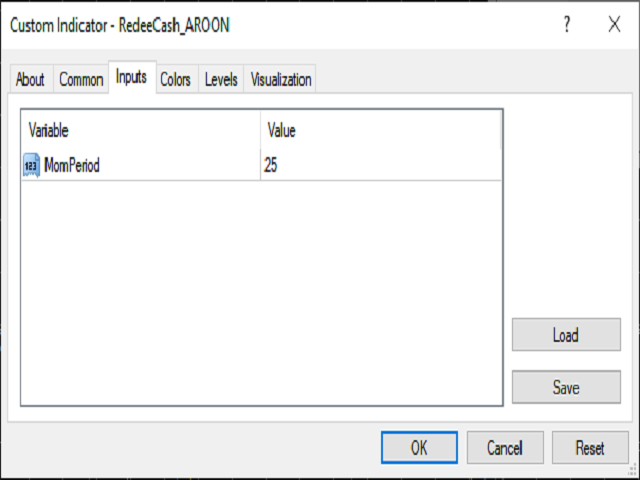
• Panoramica
  • Recensioni
  • Commenti

RedeeCash AROON

Version History

Date Version Changes
07/08/2022 1.00 Initial Release

Description

The Aroon indicator is a technical indicator that is used to identify trend changes in the price of an asset, as well as the strength of that trend. In essence, the indicator measures the time between highs and the time between lows over a time period. The idea is that strong uptrends will regularly see new highs, and strong downtrends will regularly see new lows. The indicator signals when this is happening, and when it isn't.

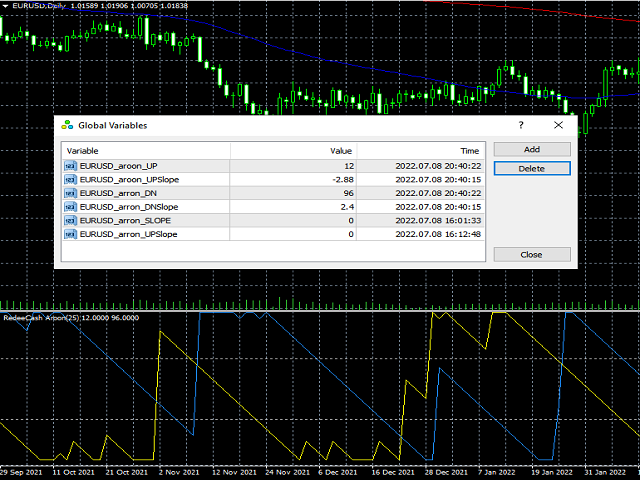
The RedeeCash AROON technical indicator adds global variables for the current strength of the UP TREND and DOWN TREND as well as the slope of the UP TREND and DOWN TREND AROON indicator lines.

Code Sample

To invoke this indicator from an EA or script, call the iCustom metatrader function,

iCustom(Symbol(),PERIOD_D1,"Market/RedeeCash AROON",25,1,0);

string AroonUpTrendVarName = StringConcatenate(Symbol(),"_aroon_UP");
string AroonDownTrendVarName = StringConcatenate(Symbol(),"_arron_DN");
string AroonUpTrendSlopeVarName = StringConcatenate(Symbol(),"_aroon_UPSlope");
string AroonDownTrendSlopeVarName = StringConcatenate(Symbol(),"_arron_DNSlope");

double upAroon = GlobalVariableGet(AroonUpTrendVarName);
double dnAroon = GlobalVariableGet(AroonDownTrendVarName);
double upSlope = GlobalVariableGet(AroonUpTrendSlopeVarName);
double dnSlope = GlobalVariableGet(AroonDownTrendSlopeVarName);

double maShort = iMA(Symbol(),PERIOD_D1,50,0,MODE_SMA,PRICE_CLOSE,0);
double maLong  = iMA(Symbol(),PERIOD_D1,200,0,MODE_SMA,PRICE_CLOSE,0);             

if (upAroon > dnAroon && upAroon < 70 && maShort > maLong && upSlope > 0) {
  OrderSend(Symbol(),OP_BUY,0.01,Ask,0,0,0);
} else if (upAroon < dnAroon && dnAroon < 70 && maShort < maLong && dnSlope > 0) {
  OrderSend(Symbol(),OP_SELL,0.01,Bid,0,0,0);
}

Usage

When the Moving Averages crosses indicate a DOWN trend, use the RedeeCash AROON indicator to confirm the entry point when the AROON DOWN TREAND value is greater than the AROON UP TREND value, while the AROON DOWN TREND value is less than 70 and the AROON DOWN TREND slop is positive (non-zero).


Prodotti consigliati
KFX Symbol Changer
Peter Kariuki Thande
4.67 (3)
KFX SMA: Symbol Changer + Moving Average (3x) + ATR + RSI + Candle Timer. This indicator allows you to create a Symbol list and change between symbols of the current chart or Timeframe by selecting the appropriate button. On Chart there are three(3) multi timeframe Moving Averages shown (selected by you), ATR Value MTF ( selected by you -  helps with setting SL and TP), RSI Value MTF (selected by you) and a Candle Timer.   Features: - Symbol Changer : Change Symbol and Timeframe of Chart.   (
FREE
MQLTA Support Resistance Lines is an indicator that calculates the historical levels of Support and Resistance and display them as Lines on chart. It will also Alert you if the price is in a Safe or Dangerous zone to trade and show you the distance to the next level. The indicator is ideal to be used in other Expert Advisor through the iCustom function. This DEMO only works with AUDNZD, the full product can be found at https://www.mql5.com/en/market/product/26328 How does it work? The indicato
FREE
UPD1 Fibo Levels
Vitaliy Kuznetsov
5 (3)
L'indicatore analizza il numero di candele specificato e costruisce i livelli di Fibonacci in base al massimo e al minimo. Poiché i livelli vengono ricostruiti, siamo interessati al lato destro dell'intervallo. Il prezzo è magnetico rispetto ai livelli e reagisce a un tocco. Utilizzate questo strumento per trovare un punto di ingresso nel trend dopo una correzione. Se a sinistra vediamo che i livelli sono perfettamente al rialzo, allora possiamo presumere di aver trovato la fine del movimento ne
FREE
This indicator is based on Mr. Mark Fisher's ACD strategy, based on the book "The Logical Trader." - OR lines - A lines - C lines - Daily pivot range - N days pivot range - Customizable trading session - Drawing OR with the desired time Drawing levels A and C based on daily ATR or constant number - Possibility to display daily and last day pivots in color zone - Displaying the status of daily PMAs (layer 4) in the corner of the chart - Show the order of daily pivot placement with multi-day
FREE
This free version can only be used for GBPUSD M15 chart . To use on all time frames and pairs , Get Pro Version The swing continuation pattern happens in a trend direction after a short reversal / pull back . As the name suggests , these patterns occurs along the swing high and swing lows of a trend , this makes the patterns very low risk patterns with potential high rewards . The swing continuation indicator also combines Currency Meter as a filter for its execution. The idea is to go with
FREE
Fibo Linear Channel
Igor Semyonov
4 (1)
Colored indicator of the linear channel based on the Fibonacci sequence. It is used for making trading decisions and analyzing market sentiment. The channel boundaries represent strong support/resistance levels, as they are the Fibonacci proportion levels. Users can select the number of displayed lines of channel boundaries on the chart by means of the input parameters. Attaching multiple instances of the indicator to the chart with different calculation periods leads to displaying a system of c
UPD1 Pivot Levels
Vitaliy Kuznetsov
5 (3)
L'indicatore mostra i classici livelli di pivot sul grafico, calcolati sulla base del giorno precedente. È possibile scegliere da quale ora calcolare la formula. Scambiate in un mercato piatto per l'inversione. In un mercato in trend, utilizzateli come target. Combinateli con le vostre strategie per un trading di successo. I livelli vengono costruiti utilizzando i buffer e visualizzati sull'intero storico delle quotazioni disponibili. Parametri di input. Start Hour - da quale ora considerar
FREE
SR indicator
Alexander Chertnik
SR is a support and resistance indicator, it shows major highs and lows by different colors. The color of a level is changing if the last high or low are touching it. After the closing of a bar above or below level, it will delete it. extern inputs: loop for candles / colors / drawing time *This indicator signal is not perfect and have to be used with other market analysis and confirmations.
FREE
Grapic ByArrowTrend Pro
Truong Cong Truc
1 (1)
Indicator support for only: Entry Point to Trend Pro Link indicator  support   :   https://www.mql5.com/en/market/product/70867 Supports all currency pairs declared in the definition. Help investors do not need to open many charts. Notice the DEAL:  multiple time frames confluence   M15, H1, H4. Entry Point to Trend Pro The indicator helps investors to identify the earliest and perfect reversal point. Easy to make decision to trade with the trend   Price action trading. support resistance
FREE
Double Price Channel   Price channel indicator for a certain number of bars specified in the settings. Indicator lines represent dynamic support or resistance levels. The upper limit is the price maximum for a certain number of periods, the lower one is the minimum. Unlike moving averages, which are based on close prices, the indicator is not “distracted” by small fluctuations. It will be recalculated only if the boundaries change. If the latter happens, then it is worth seriously thinking abou
FREE
MQLTA Support Resistance Lines
MQL4 Trading Automation
4.43 (14)
MQLTA Support Resistance Lines is an indicator that calculates the historical levels of Support and Resistance and display them as Lines on chart. It will also Alert you if the price is in a Safe or Dangerous zone to trade and show you the distance to the next level. The indicator is ideal to be used in other Expert Advisor through the iCustom function. This indicator can be tested LIVE on AUDNZD with the following DEMO https://www.mql5.com/en/market/product/26572 How does it work? The indicat
FREE
Download the free version   here. Divergence Divergence refers to when the price of a currency pair moves in one direction while the trend indicator is moving in the opposite direction. With divergence, there can be positive and negative signals. Divergences in Forex trading are quite common signals of technical analysis. These are basic early Forex signals indicating the trend reversal and filter false signals. Application of this indicator It is usually not easy to detect divergences by the t
FREE
Awesome Pivot Indicator
Komang Putra Riswanjaya
The Pivot Indicator is a vital tool for technical analysis used by traders in the financial markets. Designed to assist in identifying potential reversal points or trend changes, this indicator provides valuable insights into key levels in the market. Key features of the Pivot Indicator include: Automatic Calculations: The Pivot Indicator automatically calculates Pivot Point, Support, and Resistance levels based on the previous period's high, low, and close prices. This eliminates the complexity
FREE
The SFT Fibo Smart Pivot indicator is a powerful trading tool based on the Fibonacci Golden Ratio, designed to identify key support and resistance levels in the forex market. This indicator has the ability to pinpoint significant price levels that can serve as entry and exit points for trades. It enables traders to analyze the market more effectively and make well-informed decisions. The indicator uses the Fibonacci Golden Ratio to accurately determine support and resistance levels. These levels
FREE
MP Demark Pivot Levels
Pierre Ksachikian
5 (1)
This indicator is stand alone version from  MP Pivot Levels  (All in one) containing Demark's Pivots. Calculations:     PP = X / 4     R1 = X / 2 - LOWprev     S1 = X / 2 - HIGHprev Uses: When the pair currency price may change the direction of movement. Possible constraints of support and resistance that creates plateaus for the currency pair prices. Tendency identification by comparing the present prices according to current day's pivot point and also the prior day's pivot points. ___________
FREE
SR levels true mql4
Egidijus Bikulcius
5 (1)
Indicator SR levels true in small time frames is very useful for scalping while in bigger ones it is good for day or position trading. SR levels true can draw 4 support/resistance levels based on defined maximum rebouds from price level. Indicator scans  defined number of bars in time axis and defined number of pips in price axis (both sides - up and down) and calculates how much times price was rejected from scanned price levels. At the price levels where maximum rebounds are counted, support
FREE
Limit Map AM
Andriy Matviyevs'kyy
This indicator is a system of channels based on the minimum and maximum price values. The task of the indicator is to visualize the trend direction and support/resistance lines. The indicator is designed to be used in combination with indicators of the "Signal" or "Candles" series (a lot of free indicators of this type can be found on my page). At the same time, the indicator can be used independently according to the following rules: Buy/Sell signals are used to open a position only in the dire
FREE
!!! In [CodeBase] ho pubblicato il codice indicatore Mql4. Scarica il codice gratuitamente!!! (Devi adattare il codice quando aggiorni il terminale). Questo indicatore è lo strumento di un trader. Su tutti i periodi e simboli, mostra il movimento degli stocastici М1, М5, М15, М30, Н1, Н4 ogni minuto (la scala temporale da quella attuale a -240 minuti è delle ultime 4 ore). Step_Stoch elimina la mancanza di stocastico - lag. Ad esempio, il fatto che H1 (o M30) dopo l'aumento ha iniziato a s
FREE
The Icarus Reversals(TM) FREE Indicator is a powerful tool to identify high-probability reversal points, across all instruments.  The Reversals Indicator provides traders and investors with a simple-to-use and highly dynamic insight into points of likely price-action reversals.  Generated by a unique proprietary code-set, the Reversals Indicator (FREE version) generates long and short trade signals, which can be customised for key inputs and colourisation. Settings of the Icarus Reversals FREE h
FREE
PointsVsBars
Stanislav Korotky
This indicator provides a statistical analysis of price changes (in points) versus time delta (in bars). It calculates a matrix of full statistics about price changes during different time periods, and displays either distribution of returns in points for requested bar delta, or distribution of time deltas in bars for requested return. Please, note, that the indicator values are always a number of times corresponding price change vs bar delta occurred in history. Parameters: HistoryDepth - numbe
FREE
Pivot SR
Wartono
5 (1)
It identifies the pivot, support, and resistance price levels of the selected timeframe and then draws lines onto the chart. FEATURES: Option to specify the Timeframe Period in the PivotSR calculation. Option to display the PivotSR of the last candle, of every candle, or of the current candle. Options for displaying labels, line thickness, and line color. PivotSR can be interpreted as reversal levels or past price reactions that can be used as the basis for current price analysis. Some traders b
FREE
Gets
Andrey Kozak
Gets is a smart trading system with complex market analysis mechanism. The operation principle of Gets is based on neural networks and diversified collection of information from various market analyzers. Then the system analyzes the statistical databases to create a general idea of the current market situation and the further price movement. The information is displayed on the screen in a simple and intuitive way - in the form of buy and sell arrows. Also, the information on the current trend st
Indicator Support and Resistence plain in your chart seven lines; Red line=Resistence 3. Red line=Resistence 2. Red line=Resistence 1. Yellow line= Pivot. Green line= Support 1. Green line= Support 2. Green line= Support 3. adattable in all timeframe (minute 1, minute   5, minute   15, minute   30, Hour 1, Hour 4,Day 1,Week 1,Mounth 1); Buy under support and sell over the resistence;
TLM Map AM
Andriy Matviyevs'kyy
TLM Map AM (Trend Line Momentum Map) is an indicator developed based on a set of digital technical analysis indicators described in the article by Vladimir Kravchuk: " Digital indicators in the technical analysis of financial markets ". The indicator displays in a separate window a complex of digital technical analysis indicators such as FTLM and STLM. Recommended for use in conjunction with the RTL Map AM (Reference Trend Line Map) indicator. The indicator has no customizable parameters.
FREE
Angle Dashboard
Taras Slobodyanik
5 (1)
This is a multicurrency and multitimeframe indicator that calculates the angle between two points. Points for measuring the angle can be taken from the ZigZag (the last two points), or from the Moving Average (between two given bars), or it can be the closing prices of bars. Angle measurement is possible in degrees or in radians. You can select the scale for the calculation. For a better understanding of the indicator, you can study the free Angle High Low indicator. In the parameters you can
Trend arrow Indicator
NGUYEN NGHIEM DUY
3.23 (13)
Trend arrow Indicator is an arrow Indicator used as an assistant tool for your trading strategy. The indicator analyzes the standard deviation of bar close for a given period and generates a buy or sell signals if the deviation increases. It good to combo with Martingale EA to follow Trend and Sellect Buy Only/Sell Only for EA work Semi-Automatic. You can use this  Indicator with any EAs in my Products.
FREE
FRAMA macd 2 AM
Andriy Matviyevs'kyy
Technically, the indicator represents the difference between two fractal adaptive moving averages. Fractal Adaptive Moving Average (FRAMA) is a smart adaptive moving average developed by John Ehlers. FRAMA takes price changes into account and closely follows the price level, remaining straight during price fluctuations. FRAMA takes advantage of the fact that markets are fractal and dynamically adjusts the lookback period based on this fractal geometry. The indicator has the ability to send notif
FREE
Il Trova Livelli di Supporto e Resistenza: Il Trova Livelli di Supporto e Resistenza è uno strumento avanzato progettato per migliorare l'analisi tecnica nel trading. Dotato di livelli dinamici di supporto e resistenza, si adatta in tempo reale man mano che nuovi punti chiave si sviluppano nel grafico, fornendo così un'analisi dinamica e reattiva. La sua capacità unica di multi-timeframe consente agli utenti di visualizzare i livelli di supporto e resistenza da diversi timeframes su qualsiasi
FREE
Trend Ray
Andriy Sydoruk
The indicator shows the potential trend direction by cyclical-wave dependence. Thus, all the rays of the intersection will be optimal rays, in the direction of which the price is expected to move, taking into account the indicator period. Rays can be used as a direction for potential market movement. But we must not forget that the approach must be comprehensive, the indicator signals require additional information to enter the market.
Magic Pivot
Evgeny Belyaev
Magic Pivot is a professional indicator for finding the support and resistance lines; it has been developed by a group of professional traders. The indicator plots three support lines and three resistance lines, where a price reversal is highly probable. Magic Pivot is an excellent tool for scalping and intraday trading.   Advantages High accuracy of signals. Suitable for scalping and intraday trading. The indicator does not redraw. Simple indicator setup, minimum parameters. Works on any finan
Gli utenti di questo prodotto hanno anche acquistato
Gann Made Easy
Oleg Rodin
4.92 (53)
Gann Made Easy è un sistema di trading Forex professionale e facile da usare che si basa sui migliori principi del trading utilizzando la teoria di mr. WD Gann. L'indicatore fornisce segnali ACQUISTA e VENDI accurati, inclusi i livelli di Stop Loss e Take Profit. Puoi fare trading anche in movimento utilizzando le notifiche PUSH. Vi prego di contattarmi dopo l'acquisto! Condividerò i miei consigli di trading con te e fantastici indicatori bonus gratuitamente! Probabilmente hai già sentito parlar
ATTUALMENTE SCONTATO DEL 26% La soluzione migliore per ogni principiante o trader esperto! Questo indicatore è uno strumento di trading unico, di alta qualità e conveniente perché abbiamo incorporato una serie di caratteristiche proprietarie e una nuova formula. Con un solo grafico è possibile leggere la forza delle valute per 28 coppie Forex! Immaginate come migliorerà il vostro trading perché sarete in grado di individuare l'esatto punto di innesco di una nuova tendenza o di un'opportunit
Atomic Analyst
Issam Kassas
5 (3)
Innanzitutto, vale la pena sottolineare che questo indicatore di trading non è repaint, non è ridisegno e non presenta ritardi, il che lo rende ideale sia per il trading manuale che per quello automatico. L'Analista Atomico è un indicatore di azione del prezzo PA che utilizza la forza e il momentum del prezzo per trovare un miglior vantaggio sul mercato. Dotato di filtri avanzati che aiutano a rimuovere rumori e segnali falsi, e aumentare il potenziale di trading. Utilizzando più strati di in
TPSproTREND PrO
Roman Podpora
5 (15)
TPSpro TRENDPRO  - is a trend indicator that automatically analyzes the market and provides information about the trend and each of its changes, as well as giving signals for entering trades without redrawing! The indicator uses each candle, analyzing them separately. referring to different impulses - up or down impulse. Exact entry points into transactions for currencies, crypto, metals, stocks, indices!  -  Version MT5               DETAILED DESCRIPTION        /       TRADING SETUPS           
TPSpro RFI Levels
Roman Podpora
5 (13)
A key element in trading is zones or levels from which decisions to buy or sell a trading instrument are made. Despite attempts by major players to conceal their presence in the market, they inevitably leave traces. Our task was to learn how to identify these traces and interpret them correctly. Reversal First Impulse levels (RFI)   -  Version MT5                INSTRUCTIONS                 RUS                 ENG                                       R ecommended to use with an indicator   -  
Gold Stuff
Vasiliy Strukov
4.89 (250)
Gold Stuff è un indicatore di tendenza progettato specificamente per l'oro e può essere utilizzato anche su qualsiasi strumento finanziario. L'indicatore non ridisegna e non è in ritardo. Periodo consigliato H1. Su di esso l'indicatore funziona in modo completamente automatico Expert Advisor EA Gold Stuff. Lo trovi nel mio profilo. Contattami subito dopo l'acquisto per avere le impostazioni e un bonus personale!   IMPOSTAZIONI Disegna freccia - acceso spento. disegnando frecce sul grafi
Scopri il segreto per il trading Forex di successo con il nostro indicatore MT4 personalizzato! Ti sei mai chiesto come raggiungere il successo nel mercato Forex, guadagnando costantemente profitti minimizzando il rischio? Ecco la risposta che hai cercato! Permettici di presentare il nostro indicatore MT4 proprietario che rivoluzionerà il tuo approccio al trading. Versatilità unica Il nostro indicatore è appositamente progettato per gli utenti che preferiscono le formazioni di candele Ren
Innanzitutto, vale la pena sottolineare che questo Strumento di Trading è un Indicatore Non-Ridipingente, Non-Ridisegnante e Non-Laggante, il che lo rende ideale per il trading professionale. L'Indicatore Smart Price Action Concepts è uno strumento molto potente sia per i nuovi che per i trader esperti. Racchiude più di 20 utili indicatori in uno solo, combinando idee di trading avanzate come l'Analisi del Trader del Circolo Interno e le Strategie di Trading dei Concetti del Denaro Intelligen
Scalper Vault
Oleg Rodin
5 (27)
Scalper Vault è un sistema di scalping professionale che ti fornisce tutto il necessario per scalping di successo. Questo indicatore è un sistema di trading completo che può essere utilizzato dai trader di forex e opzioni binarie. L'intervallo di tempo consigliato è M5. Il sistema fornisce segnali di freccia accurati nella direzione della tendenza. Ti fornisce anche i segnali più alti e più bassi e i livelli di mercato di Gann. Gli indicatori forniscono tutti i tipi di avvisi, comprese le notifi
FX Power MT4 NG
Daniel Stein
5 (9)
Ricevi il tuo aggiornamento quotidiano sul mercato con dettagli e schermate tramite il nostro Morning Briefing qui su mql5 e su Telegram ! FX Power MT4 NG è la nuova generazione del nostro popolare misuratore di forza delle valute, FX Power. Cosa offre questo misuratore di forza di nuova generazione? Tutto ciò che avete amato dell'FX Power originale IN PIÙ Analisi della forza di ORO/XAU Risultati di calcolo ancora più precisi Periodi di analisi configurabili individualmente Limite di calcolo pe
Trend Screener
STE S.S.COMPANY
4.83 (86)
Indicatore di tendenza, soluzione unica rivoluzionaria per il trading di tendenze e il filtraggio con tutte le importanti funzionalità di tendenza integrate in un unico strumento! È un indicatore multi-timeframe e multi-valuta al 100% non ridipingibile che può essere utilizzato su tutti i simboli/strumenti: forex, materie prime, criptovalute, indici e azioni. Trend Screener è un indicatore di tendenza che segue un indicatore efficiente che fornisce segnali di tendenza a freccia con punti nel gra
Presentazione       Quantum Trend Sniper Indicator   , l'innovativo indicatore MQL5 che sta trasformando il modo in cui identifichi e scambi le inversioni di tendenza! Sviluppato da un team di trader esperti con un'esperienza di trading di oltre 13 anni,       Indicatore Quantum Trend Sniper       è progettato per spingere il tuo viaggio di trading verso nuove vette con il suo modo innovativo di identificare le inversioni di tendenza con una precisione estremamente elevata. *** Acquista Quant
Advanced Supply Demand
Bernhard Schweigert
4.92 (310)
CURRENTLY 26% OFF !! Best Solution for any Newbie or Expert Trader! This indicator is a unique, high quality and affordable trading tool because we have incorporated a number of proprietary features and a new formula. With this update, you will be able to show double timeframe zones. You will not only be able to show a higher TF but to show both, the chart TF, PLUS the higher TF: SHOWING NESTED ZONES. All Supply Demand traders will love it. :) Important Information Revealed Maximize the potenti
Break and Retest
Mohamed Hassan
5 (7)
‍You can visually backtest Break & Retest to see how it behaved in the past!     Manual guide:   Click here $59  for only 2  copies left! Next price is $120 .  This Indicator only places quality trades when the market is really in your favor with a clear break and retest. Patience is key with this price action strategy! After many months of hard work and dedication, we are extremely proud to present you our  Break and Retest price action indicator created from scratch. One o
Currency Strength Wizard è un indicatore molto potente che ti fornisce una soluzione all-in-one per un trading di successo. L'indicatore calcola la potenza di questa o quella coppia forex utilizzando i dati di tutte le valute su più intervalli di tempo. Questi dati sono rappresentati in una forma di indice di valuta facile da usare e linee elettriche di valuta che puoi utilizzare per vedere il potere di questa o quella valuta. Tutto ciò di cui hai bisogno è collegare l'indicatore al grafico che
Scalper Inside PRO
Alexey Minkov
4.7 (56)
SALE NOW! Limited Time Offer! An exclusive indicator that utilizes an innovative algorithm to swiftly and accurately determine the market trend. The indicator automatically calculates opening, closing, and profit levels, providing detailed trading statistics. With these features, you can choose the most appropriate trading instrument for the current market conditions. Additionally, you can easily integrate your own arrow indicators into Scalper Inside Pro to quickly evaluate their statistics and
Market Reversal Alerts
LEE SAMSON
4.21 (121)
Il profitto dalla struttura del mercato cambia quando il prezzo si inverte e si ritira. L'indicatore di avviso di inversione della struttura del mercato identifica quando una tendenza o un movimento di prezzo si sta avvicinando all'esaurimento e pronto a invertire. Ti avvisa dei cambiamenti nella struttura del mercato che in genere si verificano quando stanno per verificarsi un'inversione o un forte pullback. L'indicatore identifica inizialmente i breakout e lo slancio del prezzo, ogni volta
Presentazione dell'indicatore Miraculous Forex: Libera il potere del trading preciso Sei stanco di cercare il miglior indicatore Forex che fornisca risultati eccezionali su tutti i timeframe? Non cercare oltre! L'indicatore Miraculous Forex è qui per rivoluzionare la tua esperienza di trading e portare i tuoi profitti a nuove vette. Basato su tecnologia all'avanguardia e anni di sviluppo accurato, l'indicatore Miraculous Forex si distingue come l'apice di potenza e precisione nel mercato delle v
Advanced Currency IMPULSE with ALERT
Bernhard Schweigert
4.91 (494)
ATTUALMENTE SCONTATO DEL 31%! La soluzione migliore per ogni principiante o trader esperto! Questo indicatore è uno strumento di trading unico, di alta qualità e conveniente perché abbiamo incorporato una serie di caratteristiche proprietarie e una formula segreta. Con un solo grafico fornisce avvisi per tutte le 28 coppie di valute. Immaginate come migliorerà il vostro trading perché sarete in grado di individuare l'esatto punto di innesco di una nuova tendenza o opportunità di scalping!
Attualmente 20% di sconto! La soluzione migliore per ogni principiante o trader esperto! Questo software per cruscotti funziona su 28 coppie di valute. Si basa su 2 dei nostri indicatori principali (Advanced Currency Strength 28 e Advanced Currency Impulse). Offre un'ottima panoramica dell'intero mercato Forex. Mostra i valori di forza delle valute avanzate, la velocità di movimento delle valute e i segnali per 28 coppie Forex in tutti i (9) timeframe. Immaginate come migliorerà il vostro t
PZ Harmonacci Patterns
PZ TRADING SLU
3.43 (7)
This is arguably the most complete harmonic price formation auto-recognition indicator you can find for the MetaTrader Platform. It detects 19 different patterns, takes fibonacci projections as seriously as you do, displays the Potential Reversal Zone (PRZ) and finds suitable stop-loss and take-profit levels. [ Installation Guide | Update Guide | Troubleshooting | FAQ | All Products ] It detects 19 different harmonic price formations It plots primary, derived and complementary Fibonacci pro
FX Volume
Daniel Stein
4.6 (35)
Ricevi il tuo aggiornamento quotidiano sul mercato con dettagli e schermate tramite il nostro Morning Briefing qui su mql5 e su Telegram ! FX Volume è il PRIMO e UNICO indicatore di volume che fornisce una visione REALE del sentiment del mercato dal punto di vista del broker. Fornisce informazioni straordinarie su come gli operatori di mercato istituzionali, come i broker, sono posizionati sul mercato Forex, molto più velocemente dei rapporti COT. Vedere queste informazioni direttamente sul vo
How to use Pair Trading Station Pair Trading Station is recommended for H1 time frame and you can use it for any currency pairs. To generate buy and sell signal, follow few steps below to apply Pair Trading Station to your MetaTrader terminal. When you load Pair Trading Station on your chart, Pair Trading station will assess available historical data in your MetaTrader platforms for each currency pair. On your chart, the amount of historical data available will be displayed for each currency pai
AW Trend Predictor
AW Trading Software Limited
4.74 (39)
La combinazione di trend e livelli di rottura in un unico sistema. Un algoritmo di indicatore avanzato filtra il rumore del mercato, determina la tendenza, i punti di ingresso e i possibili livelli di uscita. I segnali indicatori sono registrati in un modulo statistico, che permette di selezionare gli strumenti più adatti, mostrando l'efficacia dello storico dei segnali. L'indicatore calcola i segni Take Profit e Stop Loss. Manuale e istruzioni ->   Qui   / Versione MT5 ->   Qui Come fare tradi
TrendMaestro
Stefano Frisetti
5 (2)
nota: questo indicatore e' per METATRADER4, se vuoi la versione per  METATRADER5 questo e' il link:  https://www.mql5.com/it/market/product/108123 TRENDMAESTRO riconosce un nuovo TREND sul nascere, non sbaglia mai. La sicurezza di identificare un nuovo TREND non ha prezzo. DESCRIZIONE TRENDMAESTRO identifica un nuovo TREND sul nascere, questo indicatore prende in esame la volatilita' i volumi ed il momentum per identificare il momento in cui c'e' un'esplosione di uno  opiu' di questi dati
GOLD Impulse with Alert
Bernhard Schweigert
4.56 (9)
Questo indicatore è una super combinazione dei nostri 2 prodotti Advanced Currency IMPULSE with ALERT  +   Currency Strength Exotics . Funziona per tutti i time frame e mostra graficamente l'impulso di forza o debolezza per le 8 valute principali più un simbolo! Questo indicatore è specializzato nel mostrare l'accelerazione della forza delle valute per qualsiasi simbolo come oro, coppie esotiche, materie prime, indici o futures. Primo nel suo genere, qualsiasi simbolo può essere aggiunto
Quantum Breakout Indicator PRO
Bogdan Ion Puscasu
4.96 (26)
Presentazione       Quantum Breakout PRO   , l'innovativo indicatore MQL5 che sta trasformando il modo in cui scambi le zone di breakout! Sviluppato da un team di trader esperti con un'esperienza di trading di oltre 13 anni,   Quantum Breakout PRO   è progettato per spingere il tuo viaggio di trading a nuovi livelli con la sua strategia innovativa e dinamica della zona di breakout. Quantum Breakout Indicator ti fornirà frecce di segnalazione sulle zone di breakout con 5 zone target di prof
Innanzitutto, è importante sottolineare che questo sistema di trading è un indicatore non repainting, non redrawing e non lagging, il che lo rende ideale per il trading professionale. Il "Sistema di Trading di Supporto e Resistenza Intelligente" è un indicatore avanzato progettato per trader nuovi ed esperti. Permette ai trader di ottenere precisione e fiducia sul mercato forex. Questo sistema completo combina più di 7 strategie, 10 indicatori e varie approcci di trading, tra cui strategie di
TrendDecoder Premium
Christophe, Pa Trouillas
5 (3)
Identificare i range e le prossime mosse probabili   |  Ottenere i primi segnali e la forza delle tendenze   |  Ottenere uscite chiare prima dell'inversione   |  Individuare i livelli di Fibo che il prezzo testerà Indicatore non tracciante e non ritardato - ideale per il trading manuale e automatizzato - adatto a tutti gli asset e a tutte le unità temporali Offerta limitata nel tempo >>   50% OFF Dopo l'acquisto, contattatemi su questo canale  per le impostazioni personalizzate. Versione   MT5 :
Price Action Entry Alerts
Stephen Sanjeeve Sahayam
5 (3)
Questo indicatore controlla ogni barra per la pressione di acquisto o vendita e identifica 4 tipi di modelli di candele con il volume più alto. Queste candele vengono quindi filtrate utilizzando diversi filtri lineari per mostrare segnali di acquisto o vendita. I segnali funzionano meglio, in combinazione con una direzione temporale più elevata e quando scambiati durante le ore ad alto volume. Tutti i filtri sono personalizzabili e funzionano in modo indipendente. Può visualizzare i segnali di
Altri dall’autore
Les opportunités d'arbitrage triangulaire RedeeCash montrent les triades de devises disponibles et chaque configuration de position commerciale de devise en tant que variable globale, sous la forme de AAA/BBB, CCC/AAA, CCC/BBB : AAA/BBB -1|0|1 AAA/BBB, CCC/AAA, CCC/BBB : CCC/AAA -1|0|1 AAA/BBB, CCC/AAA, CCC/BBB : CCC/BBB -1|0|1 où la valeur est la direction commerciale de OP_BUY ou OP_SELL. Si la direction du commerce indique -1, alors aucun commerce ne devrait avoir lieu pour cette pai
FREE
Version History : Date Version Changes 6/20/2022 1.00 Initial release 6/21/2022  1.10 Add global variables for Minimum (SYMBOL_volume_min) and Maximum (SYMBOL_volume_max) History Volumes  Description : RedeeCash Volumes Indicator is the Volumes indicator that you have come to trust for market entry and exit with the added benefit of exposing key metrics as global variables. Including global variables in an indicator permits easier interaction with expert advisors (EA) and scripts. When attaching
FREE
RedeeCash TimeZones
Patrick Odonnell Ingle
Questo indicatore mostrerà le sessioni di trading attive e inattive e imposterà variabili globali a seconda che la sessione di trading sia attiva (1) o inattiva (0). Utilizzando la funzione della libreria iCustom, puoi richiamare questo indicatore da un Expert Advisor o da uno script, come segue, // Richiama l'indicatore personalizzato iCustom ( Symbol (), PERIOD_D1 , "Market/RedeeCash_TimeZone" , 0 , 0 ,Blue,Red); // ottenere i valori delle variabili globali double NewYorkSessionIsActive = Glob
FREE
RedeeCash Rate of Change
Patrick Odonnell Ingle
Tasso di cambio In base alla formula, ROC = (Close[n] - Close[n-lookback]) / Close[n-lookback] * 100 per tracciare il tasso di variazione dell'azione del prezzo di una coppia di valute in un periodo di ricerca e fornisce due variabili globali, SYMBOL_ROC e SYMBOL_ROC_LOOKBACK, che rappresentano l'ultimo valore del tasso di variazione e il tasso di variazione nel periodo di ricerca precedente. Invocando l'indicatore utilizzando la funzione iCustom, iCustom ( "Market/RedeeCash_Rate_of_Change.ex
FREE
RedeeCash WilliamsX50
Patrick Odonnell Ingle
Basato sulla strategia identificata su https://tradingstrategyguides.com/williams-percent-range-strategy/ ma automatizzato per supportare più valute da un'unica istanza di consulente esperto. Utilizza anche gli incroci lenti e veloci SMA per determinare la direzione del trend. La base della strategia esterna è aprire un'operazione ACQUISTA quando Williams %R attraversa il -50 in un trend rialzista e apre un'operazione VENDITA in un trend ribassista. Hai il controllo sul periodo di tendenza
FREE
RedeeCash Multime XMA
Patrick Odonnell Ingle
Incrocio di medie mobili su più intervalli di tempo. Mentre una strategia di tendenza tradizionale sarebbe quella di scegliere un intervallo di tempo come il quotidiano per stimare la tendenza, questo consulente esperto aprirà un'operazione nella direzione della tendenza quando TUTTI i periodi di tempo da 5 mesi a mensile mostrano la stessa tendenza.       SINGLE_CURRENCY = true, consente operazioni su una singola valuta, quando disabilitata (FALSE), scambierà le valute selezionate nella fi
FREE
RedeeCash Interest
Patrick Odonnell Ingle
Questo Expert Advisor (EA) è come un conto di risparmio ad alto rendimento perché si verificherà uno scambio su coppie di valute che pagano (guadagnano) interessi overnight. Le posizioni di entrata e di uscita si basano sui prezzi minimo/massimo e massimo/minimo del periodo di ricerca rispettivamente per gli ordini di acquisto e di vendita. Ingressi comuni, SINGLE_CURRENCY = true, consente operazioni su una singola valuta, quando disabilitata (FALSE), scambierà le valute selezionate nella f
FREE
RedeeCash Statistics
Patrick Odonnell Ingle
1 (1)
Version History Date Version Changes 07/10/2022 1.00 Initial release Description A collection of modern statistical functions that can be integrated into your own strategy. The included functions are, Mean Median Range Skew Max Min IRange Deviations AbsoluteDeviations MAD StandardDeviation Variance GetCorrelation SamplingDistributionStandardDeviation ZScore CorrelationCoefficient CoVariance Beta Confidence SNormInv PercentOfValue ValueOfPercent MQL Header (mqh) The required header is //+--------
FREE
RedeeCash RSI
Patrick Odonnell Ingle
Version History Date Version Changes 07/09/2022 1.10 Initial released Description The RedeeCash RSI is your typical RSI indicator with the three latest RSI calculations exposed as global variables for easier integration with scripts and expert advisors. Code Sample To invoke this indicator from an EA or script, call the iCustom metatrader function, iCustom ( Symbol (), PERIOD_CURRENT , "Market/RedeeCash RSI" , 14 , 1 , 0 ); string RSIVarName = StringConcatenate ( Symbol (), "_rsi" ); string RSIP
FREE
RedeeCash 4XLOTS
Patrick Odonnell Ingle
La libreria RedeeCash 4XLOTS è una libreria di gestione del rischio localizzata basata sull'algoritmo WEB API di 4xlots.com. Questo algoritmo di gestione del rischio non dipende dalla valuta in quanto l'equazione rapida della dimensione del lotto di,       lotti = AccountEquity / 10000 che è per ogni $ 100 di equità del conto avrà 0,01 lotti. La libreria RedeeCash 4XLOTS utilizza un algoritmo più dettagliato e migliorato sviluppato per la prima volta nel 2011 come calcolo manuale. Redee
Filtro:
Nessuna recensione
Rispondi alla recensione