Rsi Border Search Multi Symbol Scanner448
- Indicatori
-
Shin Kojima
 MT4 indicator developer with 10+ years of live trading experience.
Specializing in alert tools and scanners for ICT-based traders.
Zero complaints. Reliable tools. Real support. - Versione: 1.0
RSI Border Search scans up to 64 symbols across 7 timeframes (448 combinations) in real time, detecting when RSI reaches overbought or oversold levels on confirmed bars.
═══ KEY FEATURES ═══
- Multi-Symbol Scanner: Monitor up to 64 symbols x 7 timeframes = 448 cells simultaneously.
- RSI Boundary Detection: Detects when RSI crosses above or below your specified boundary level on confirmed (closed) bars.
- No Repaint: Only confirmed bars are evaluated. The forming bar is never used, so signals never appear or disappear.
- Color-Coded Dashboard: Matching cells are highlighted with distinct colors for bullish, bearish, new alert, and no-signal states.
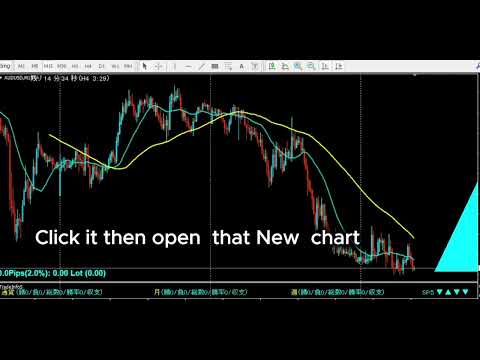
- One-Click Chart Open: Click any timeframe cell on the panel to instantly open that symbol and timeframe chart.
- Per-Timeframe Alerts: Enable or disable alerts independently for each timeframe (M1 to W1).
- Push & Email Notifications: Supports MT4 popup alerts, smartphone push notifications, and email alerts.
- Spread Filter: Optionally exclude symbols when spread exceeds your defined maximum.
- Universal Compatibility: Works with Forex pairs, Gold, indices, crypto — anything visible in MT4 Market Watch.
═══ HOW IT WORKS ═══
RSI Border Search uses a single boundary parameter (default 30). The indicator automatically mirrors it: with a border of 30, the upper threshold becomes 70 and the lower threshold becomes 30.
- RSI >= 70 (100 - Border): Detected as an overbought / bullish extreme condition.
- RSI <= 30 (Border): Detected as an oversold / bearish extreme condition.
Adjust the border to suit your strategy. Setting 20 gives thresholds at 80/20. Setting 40 gives 60/40.
All detection uses confirmed (closed) bars only — no repaint, no flickering signals.
═══ DASHBOARD COLORS ═══
- Bullish Color: RSI is above the upper threshold (overbought zone active).
- Bullish Alert Color: A new bullish signal has just confirmed.
- Bearish Color: RSI is below the lower threshold (oversold zone active).
- Bearish Alert Color: A new bearish signal has just confirmed.
- Neutral Color: No signal active.
- Neutral Alert Color: A previously active signal has just ended.
Alert colors appear briefly when the condition changes, then revert to the normal color on the next scan. The symbol name temporarily turns red when an alert fires.
═══ SYMBOL CONFIGURATION ═══
Symbols are specified in the UseSymbols parameter. You can use currency codes, direct symbol names, or a mix of both.
Currency codes (e.g., "EUR USD JPY") auto-generate all pair combinations: EURUSD, EURJPY, USDJPY.
Direct names (e.g., "XAUUSD") add that exact symbol.
Mixed (e.g., "XAUUSD USD EUR JPY") combines both methods.
Only symbols present in MT4 Market Watch are scanned. Default: 29 symbols x 7 timeframes.
═══ PARAMETERS ═══
RSI Settings:
- RSIPeriod: RSI calculation period (default 14)
- RSIBorder: Boundary level (default 30). Upper threshold = 100 - RSIBorder
Timeframe Display:
- bUseM1 / bUseM5 / bUseM15 / bUseM30 / bUseH1 / bUseH4 / bUseD1 / bUseW1: Show or hide each timeframe on the panel
Alert Settings:
- bAlertOnce: Fire alert only once per signal
- bFindAlert / bLostAlert: Alert on new signal detection / signal end
- bAlertM1 ~ bAlertW1: Enable alerts per timeframe independently
Spread Settings:
- bUseSpread: Display spread column
- MaxSpread: Exclude symbols exceeding this spread (displayed in red)
Notifications:
- bMail: Email notification (requires MT4 SMTP setup)
- bPush: Push notification (requires MetaQuotes ID)
Symbol Settings:
- UseSymbols: Currency codes and/or direct symbol names
- AddSymbol: Broker-specific suffix (e.g., ".m" or "pro")
Display Settings:
- ATRCorner / TxtXBase / LineMax / FontSize / TxtXPos / TxtXSpace / TxtYPos: Panel position, font size, spacing, and layout
═══ INSTALLATION ═══
1. Copy the .mq4 file to: MQL4/Indicators
2. Copy AllSearch_en.mqh to: MQL4/Include
3. Restart MT4
4. Drag & drop onto any chart
Note: The indicator will not compile without AllSearch_en.mqh in the Include folder.
On first launch, if history data is missing for a symbol/timeframe, a message will appear: "Please load [Symbol][Timeframe] chart once." Simply open that chart once to load the data.
═══ USAGE TIPS ═══
- RSI extremes alone are not trade signals. Always open the chart and confirm with trend direction, support/resistance, and price action.
- RSI works for both reversal setups (overbought/oversold) and trend continuation (pullback entries in a trend).
- When multiple timeframes show RSI at extreme levels for the same symbol, the signal carries more weight.
- Disable unused timeframes to improve scanning speed.
- When running multiple scanner instances, assign a different AddText value to each.
═══ All-Currency Monitoring Series ═══
Tools that monitor all currency pairs at once become an incredibly powerful weapon once mastered ? a trading tool for life.
The key is to match the right tool to your trading strategy.
Here are the hottest tools available right now:
- IFVG All-Currency Scanner
The most effective tool for catching ICT fake-out moves.
Especially powerful for targeting AMD movement setups.
- MA + Pin Bar All-Currency Scanner
A precision tool that finds pin bars bouncing off moving averages to catch pullback entries.
The ultimate edge comes from knowing [what was swept]. Works perfectly with ICT methodology.
- AutoLineSaver
An almost essential companion for all-currency monitoring.
Automatically saves and restores your drawn lines even after closing charts ? an extremely
convenient tool that dramatically improves the efficiency of multi-pair chart analysis.