UPD1 Semaphore 123 Dashboard MT5
- Indicatori
-
Vitaliy Kuznetsov
 UPD1 MT4 Indicators - https://www.mql5.com/en/market/mt4/indicator?filter=UPD1
Levels
Patterns
Volume
Money Management - Versione: 2.96
- Aggiornato: 1 gennaio 2025
- Attivazioni: 20
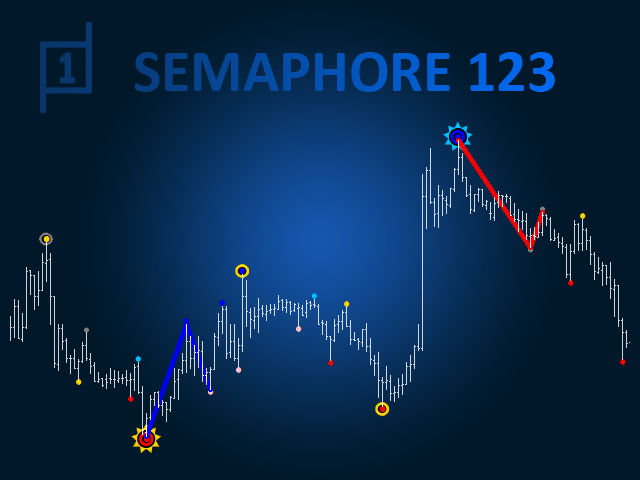
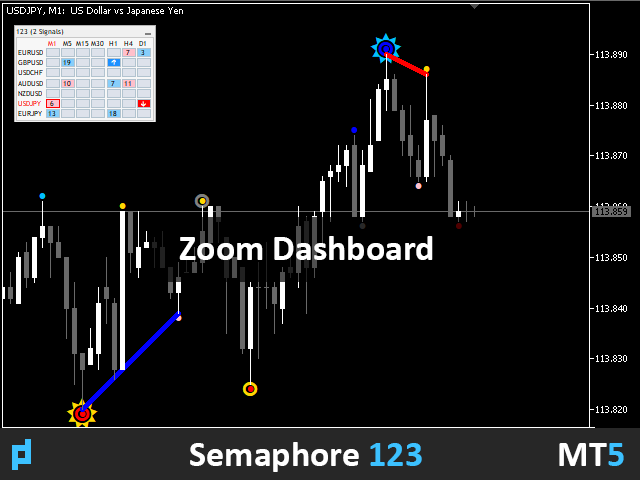
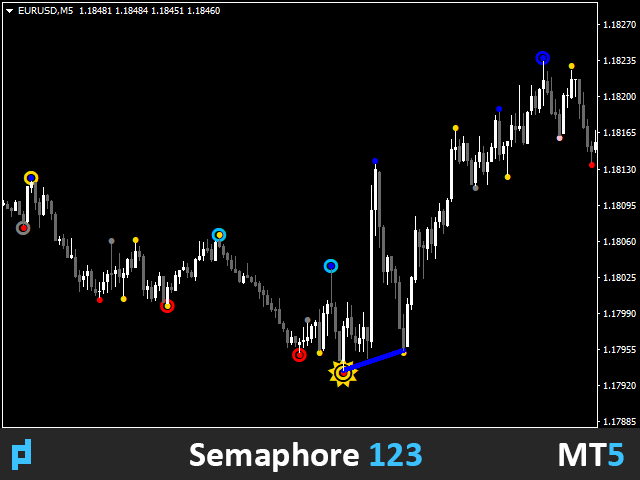
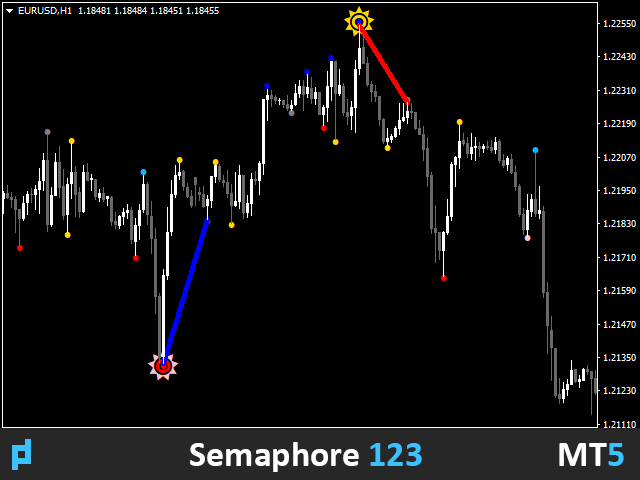
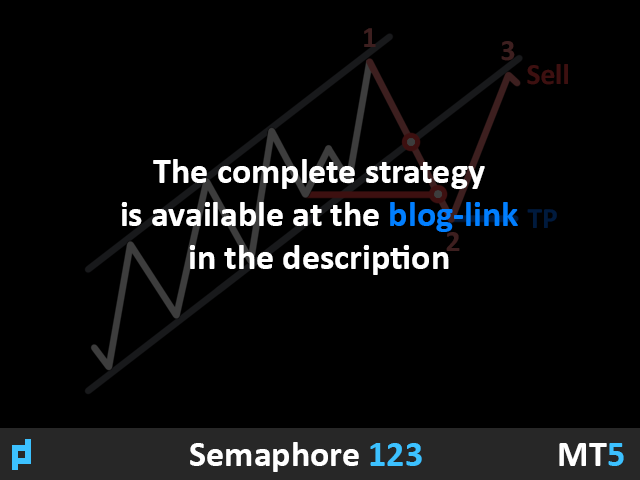
L'indicatore costruisce un semaforo a tre periodi e un pattern di inversione 123 dall'estremo. Il segnale arriva all'apertura della seconda candela.
Questo pattern può essere negoziato in diversi modi (test point 3, breakout e altri). L'uscita dal canale o il breakout della trendline è il principale fattore scatenante per trovare un punto di ingresso.
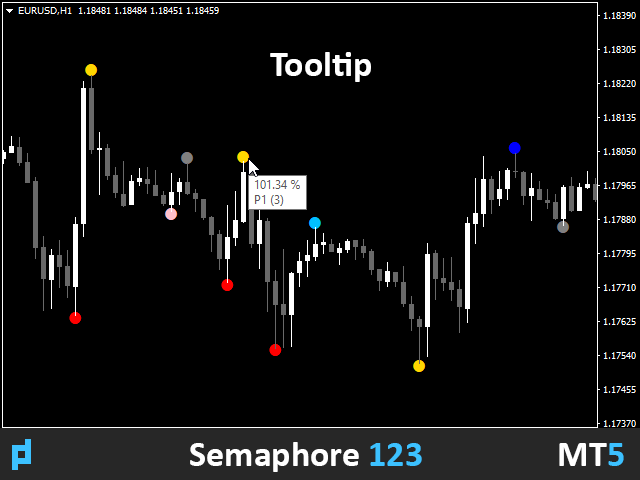
Le icone sono colorate in base ai livelli di Fibonacci. Le icone gialle indicano il test di un livello al quale il segnale è amplificato.
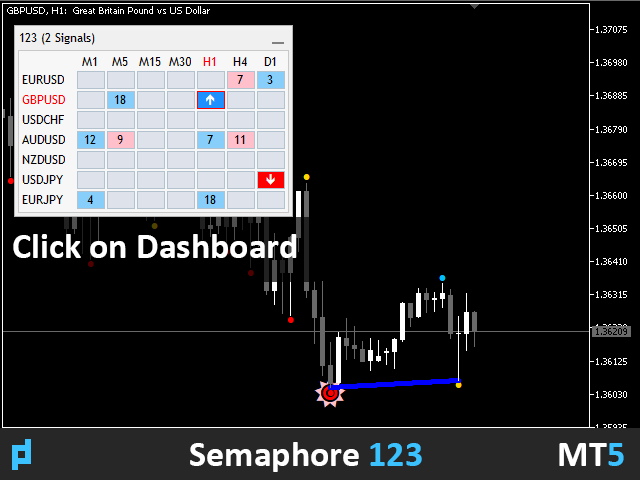
Utilizzando il cruscotto multivaluta, è possibile tenere traccia delle coppie di valute in cui è stato individuato il pattern 123 e del numero di barre che lo hanno seguito.
Parametri di input.
Bars Count – cronologia da visualizzare.
Tooltip – se mostrare o meno i tooltip quando si passa il mouse su un oggetto.
Show Semaphore – abilita o disabilita il semaforo.
Show 123 – abilita o disabilita la visualizzazione del modello 123.
Period 1, 2, 3 - periodo del semaforo.
Period 1, 2, 3 Visual – attiva o disattiva la visualizzazione di un periodo separato.
Arrow Coeff Period – numero di barre per il calcolo.
Arrow Coeff – coefficiente del valore medio delle candele per formare la rientranza delle icone.
Period 1, 2, 3 Arrow Code – codice dell'icona del font wingdings.
Period 1, 2, 3 Arrow Size - dimensione delle frecce.
(<50; 50-76,4; 76,4 -123,6; 123,6-150) UP, DN – colore per livelli di Fibonacci per le frecce.
Draw Line Objects - selezionare la modalità di disegno del modello (1-3, 1-2-3, 1-2-3-4).
123 UP, DN Color - il colore della linea del motivo 123.
123 UP, DN Width - lo spessore della linea del motivo 123.
Dashboard - abilita o disabilita il cruscotto multicurrency.
Scan Bars to 123 - quante barre della cronologia seguire dopo la fine di 123.
Dashboard Zoom % (0 - auto) - dimensione del cruscotto in percentuale.
Color Theme - selezione automatica o manuale del tema colore del pannello (chiaro e scuro).
Symbol Lyst - inserire le coppie di valute da monitorare.
View M1-MN - inserire i periodi di tempo da monitorare.
Alert - impostazione principale che abilita l'allarme (Grafico corrente, Elenco cruscotto).
Alert Work Time - Tempo di lavoro dell'avviso 00:00-23:59 (modificabile).
Alert Pop Up - abilita, disabilita la finestra pop-up.
Alert Push - abilita, disabilita la notifica in-app.
Alert Email - abilita, disabilita l'avviso via e-mail.
Alert Sound - abilita o disabilita il suono.
Alert Sound Name - il file del suono.
Indicator ID – inserire un nuovo valore se si desidera utilizzare più di un indicatore su un grafico.

It is hard to give a negative review for an indicator priced for all people. However, I have used it several days and I am not liking the way it works. All I see are colored dots. I would rather see a line or something designating it is time to take a trade and targets. Or maybe an arrow? This is my fourth 123 indicator I have tried. I dont know about other traders, but I have colors assigned in my head for Fibonacci numbers. And Fibonacci numbers are generally the same wherever I go. The Vendor uses colored bubbles to identify levels. Too confusing for me to have a bunch of repeating bubbles. Plus, using a yellow for designating 50 to 76.4 is confusing to me. Does that mean it goes to 50 or 76.4? The Vendor did allow for adding different equations for the 123. If you want to see only the 1, or the 2 or the 3, you can add or remove each step of the process. I dont regret purchasing it, but it isnt my cup of tea. It seems like it was more designed to show his skills/abilities, but not so much for me to trade by. .