Trade Journal Box
- Utilità
- Versione: 1.26
- Aggiornato: 6 novembre 2026
- Attivazioni: 5

Trade Journal Box puts your trading journal on the chart, where the trade happens. With one click you tag your emotion, type why you entered, and the indicator saves your notes and a chart screenshot when each trade opens and closes. Later, the report lets you compare your results by emotion, symbol and date.
It is a non-trading utility indicator that watches your positions and journals them for you:
Automatic chart screenshots. The moment a position opens, and the moment it closes, Trade Journal Box captures the chart -- optionally with entry and exit arrows drawn on the shot. Weeks later you do not just read that you went long, you SEE the exact chart you traded.
Click-and-type notes, right there. The on-chart panel has two fields that matter: Reason (why you entered) -- filled while the trade is live, when you still remember; and Lesson (after close) -- filled when the result is in. Click the field, type, hit Save note to attach it to the trade. No dialogs, no other windows.
Idea log. A separate note box in the panel for ideas and rules that belong to no single trade; they appear in their own Ideas section of the report.
Emotion tags -- the discipline layer. Five one-click buttons: Calm, Confident, Fear, Greed, Revenge. Tag the state you traded in and it is stored with the trade. After a few weeks, pick an emotion in the report filter and the summary bar and charts recalculate for just those trades, so you can compare your Calm trades with your Revenge trades side by side -- something a manual spreadsheet only gives you if you build and maintain it yourself.
Reports you can read. One button generates an HTML report (open in any browser, print to PDF with Ctrl+P) and a CSV export -- entries, exits, profit, emotion, reason/lesson and the screenshots, in one table. The Extra settings panel filters the report: This chart only or All symbols, plus date-range spinners.
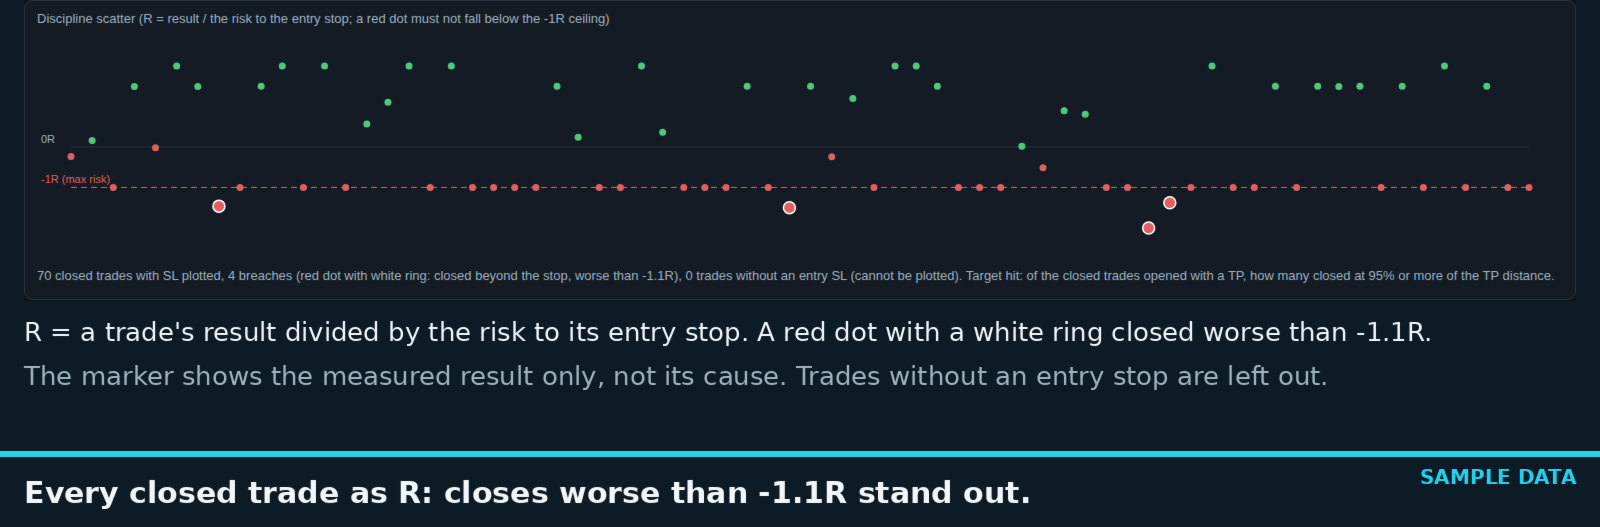
Report metrics that show discipline, not only profit. The summary adds the payoff ratio (average win / average loss), the longest losing streak, how many trades reached their target (TP), and a discipline scatter plot: every closed trade as R, its result divided by the risk to your entry stop. A close worse than -1.1R is marked with a white-ringed red dot; the marker shows the measured result only, not its cause (gaps, slippage, costs or a moved stop can also push a close past -1.1R). Entry SL and TP are recorded when a position opens, trades without a stop are left out of the scatter, and every figure recalculates with the symbol and date filters.
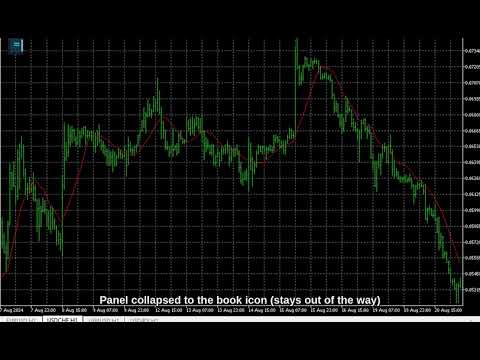
Stays out of your way. The panel collapses to a small book icon when you do not need it. It never trades, never touches your orders, and coexists with any EA running on the same account. Journal data is stored locally in an SQLite database via MetaTrader 5's built-in database engine -- pure MQL5, zero DLLs, zero external dependencies, nothing leaves your terminal.
Three themes (Night Cyan, Graphite Gold, Clean Light), draggable panel, configurable corner and width.
Why you will like it
- You will actually use it. The journal is one click away, on the chart, at the moment of the trade -- not a spreadsheet you open "later".
- Auto screenshots on open and close, with optional entry/exit arrows -- visual memory of every trade.
- Reason and Lesson fields -- capture the why before you forget it and the takeaway after the close.
- Idea log for rules and ideas that are not tied to one trade.
- Five emotion tags including Revenge -- see your discipline in the data, not in your memory of it.
- HTML + CSV reports with symbol scope and date filters -- browser-readable, PDF-printable, spreadsheet-importable.
- Discipline in numbers: payoff ratio, longest losing streak, TP hit rate and an R-scatter that marks closes worse than -1.1R of the entry risk.
- Safe by design. Does not trade, coexists with your EAs, all data stays local, no DLLs.
How to use
- Attach Trade Journal Box to the chart you trade from (one instance journals the whole account if you enable All symbols).
- Trade as usual -- screenshots happen automatically on open and close.
- While the position is live, click Reason and type why you entered; tag the emotion with one click.
- After the close, add the Lesson and hit Save note.
- Any time: press the HTML or CSV button for the full report; use Extra settings for scope and date filters.
From the makers of the free Live Tuning family (CCI, RSI, Bollinger and more classic indicators with on-chart live sliders) -- same brand, same rule: transparent tools that respect your workflow.
Tip: If the panel ever looks transparent, your chart has "Chart on foreground" enabled (F8 -> Common) and the candles are drawn over it; untick the option and the panel renders solid. While the panel is on a chart, keyboard chart shortcuts and Quick Navigation are switched off so that your typing goes into the note box; removing the panel switches them back on.
Self-contained, no DLLs. Works on any symbol and timeframe. It does not trade for you -- it is a journaling tool; keeping a journal supports discipline but does not by itself guarantee any trading result.