Professional SpreadMonitor
- Utilità
-
Musa Khunarikov
 Trader professionista dal 2014 (oltre 10 anni di esperienza). Mercati: Forex, azioni, MOEX, metalli.
Sviluppatore MQL4-MQL5. Specializzazione: analisi dei volumi, analisi dei cluster, footprints, delta, profilo dei volumi.
Esperienza e approccio: - Versione: 1.0
📊 SpreadMonitor
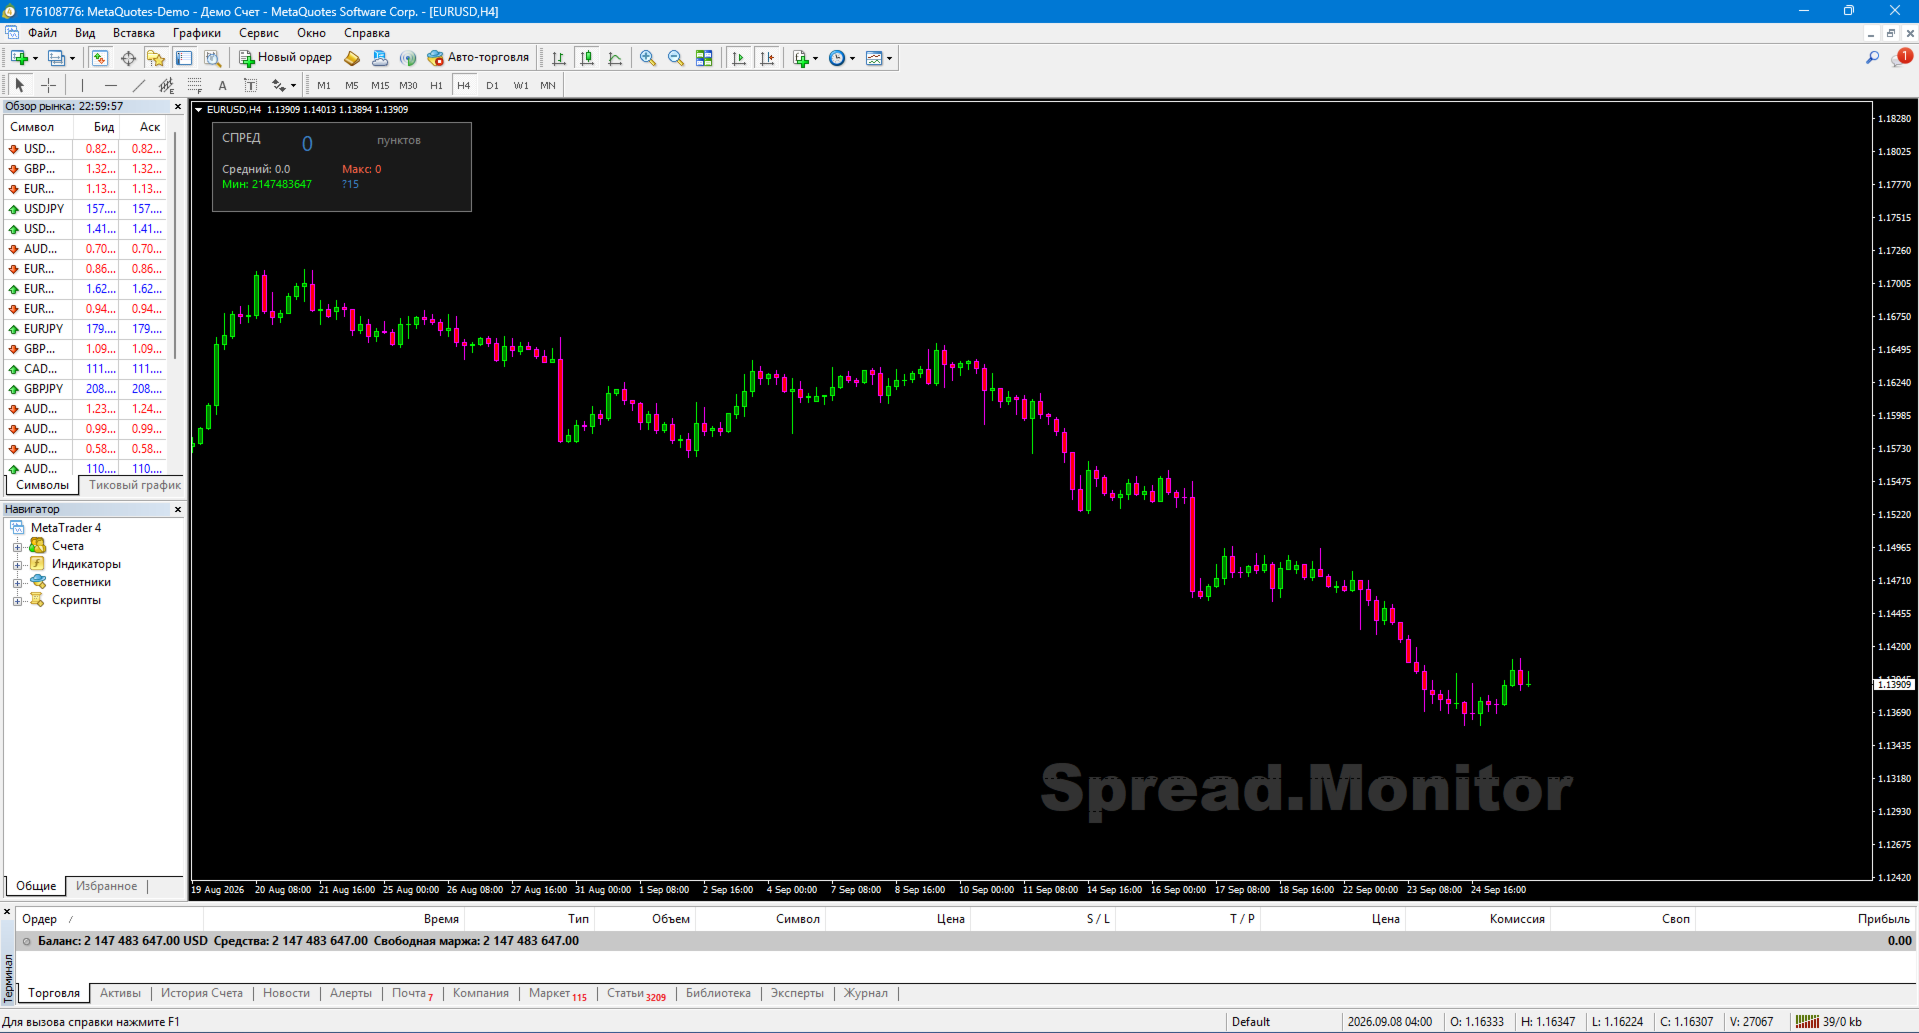
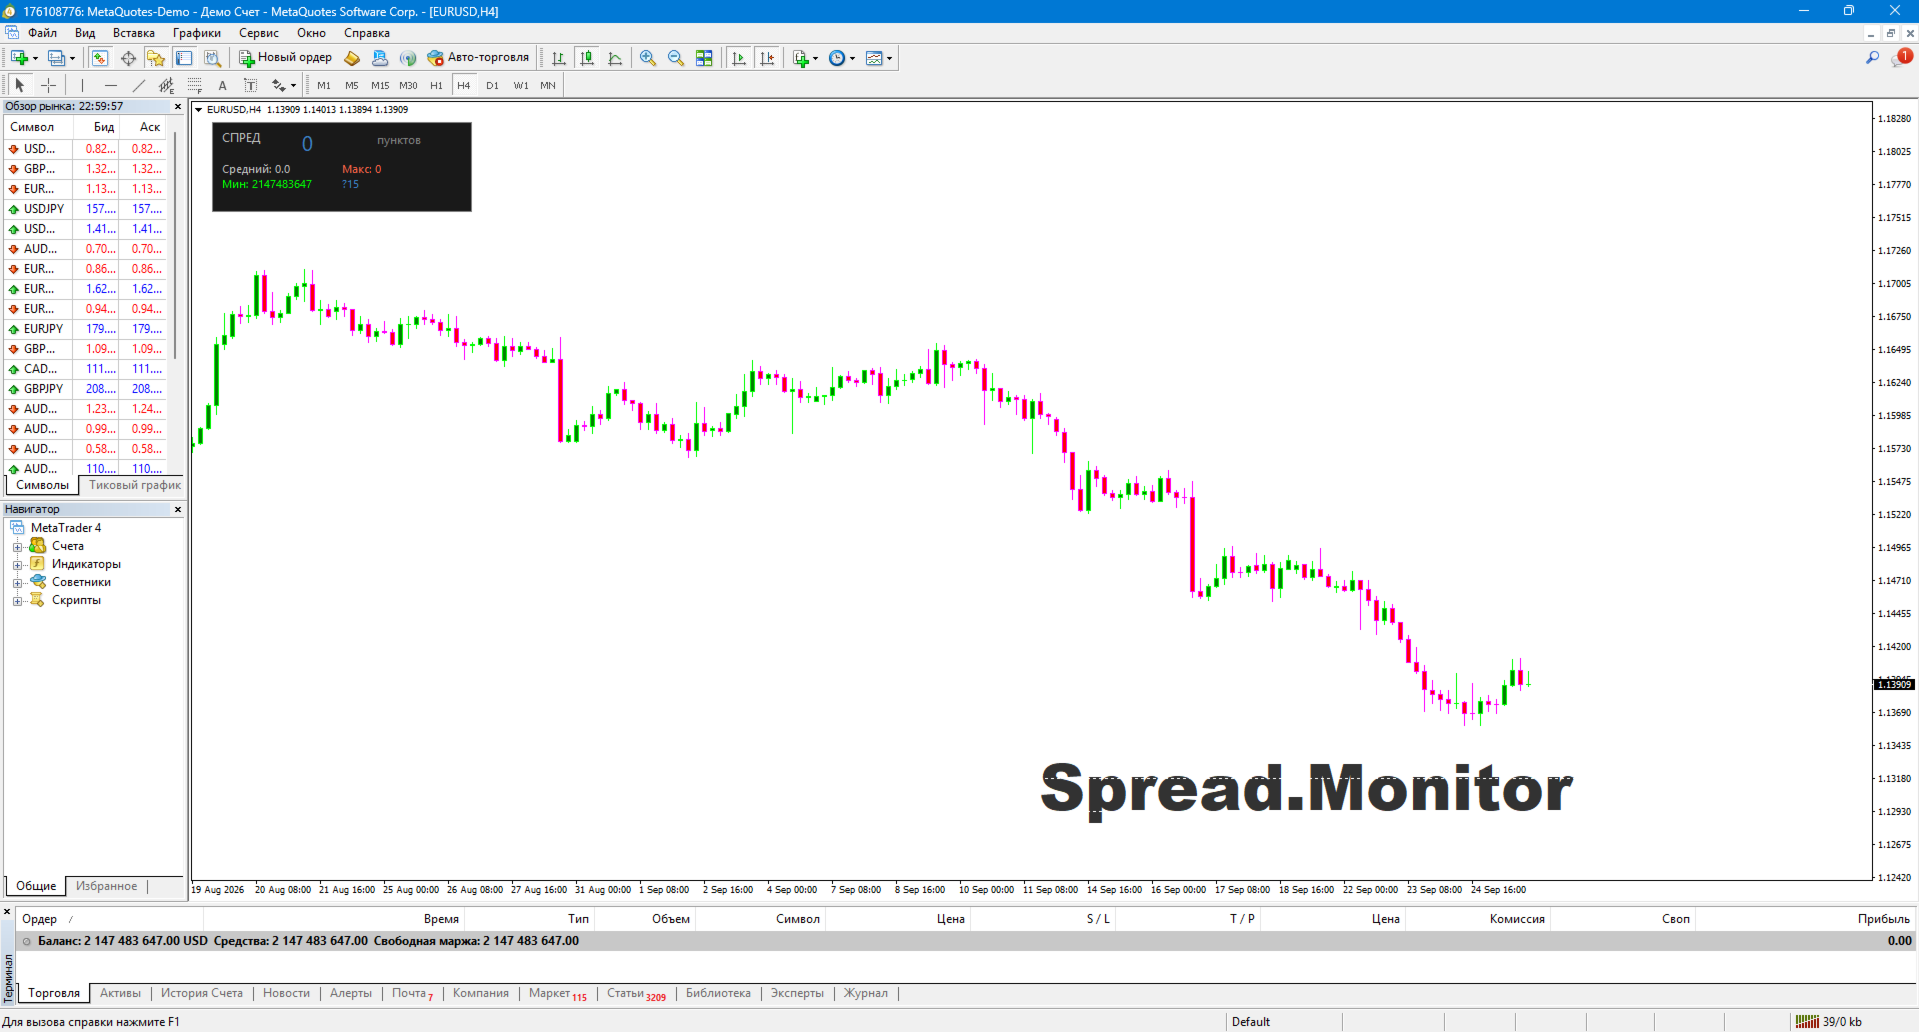
SpreadMonitor is a professional indicator for MetaTrader 4 that color-codes candlesticks based on spread levels and displays a monitoring panel on the chart showing the current value, statistics, and history.
The indicator was created by an active trader with 12 years of experience. It helps you avoid entering the market when the spread is abnormally high and allows you to see actual trading costs at any given moment.
⚠️ MetaTrader 4 Limitation: MT4 does not provide access to historical spread data for individual bars. Therefore, the indicator begins accumulating history only from the moment it is attached to the chart. Closed bars are colored based on the spread recorded at the time of their closure. If you remove and re-attach the indicator, the history starts over.
🎯 What the indicator displays
Candlestick coloring based on spread levels:
🟦 Blue — normal spread
🟧 Orange — elevated
⬜ Gray — high (do not trade)
Monitoring panel with the current spread value in large font
Statistics: average, maximum, and minimum spread over N bars
Spread history — a real-time mini-histogram of recent bars
Watermark — a semi-transparent "Spread.Monitor" label on the chart
✨ Key features
🎨 Visualization in the style of professional trading terminals
Candlesticks are colored based on spread levels rather than open/close prices. This allows you to instantly see where the broker widened the spread. In MT4, the current bar is colored in real-time, and subsequent closed bars are colored as data arrives. 📊 Comprehensive Statistics
The panel displays:
Current spread value (in points)
Average spread over the observation period
Maximum value
Minimum value
📈 Spread History
A mini-histogram shows the last N bars, allowing you to see when the spread widened and when it was normal. The color of each bar corresponds to the spread level. History tracking begins when the indicator is launched.
🌍 Automatic Language Detection (11 languages)
The indicator automatically adjusts to your terminal's language: Russian, English, German, Spanish, French, Portuguese, Italian, Turkish, Chinese, Japanese, Korean.
⚙️ Flexible Settings
Spread thresholds (normal / elevated / high)
Colors for each level
Panel position and size
Watermark text and color
Option to disable any element
🛠️ How to Use
1. Installation
Copy SpreadMonitor.ex4 to the MQL4/Indicators/ folder
Restart MT4
Drag onto the chart
2. Threshold Configuration
InpNormalMax — upper limit for normal spread (default: 15 points)
InpElevatedMax — upper limit for elevated spread (default: 30 points)
Anything above this is considered high spread (gray)
Thresholds depend on the instrument:
Instrument Normal Elevated
EURUSD 10 20
GBPUSD 15 30
XAUUSD 20 50
Crypto 50 150
3. Trading Applications
Check the panel before entering a trade. If spread > Elevated → wait
During news events — gray candles indicate that trading should be avoided
At night / during the Asian session — spread widening is immediately apparent
Historical analysis — see when the broker "widens" the spread (usually before news releases)
Scalping — critical for strategies involving frequent entries
📋 Implementation features
Recalculation on every tick — the current bar updates in real-time
History accumulates based on closed bars — starting from the moment of installation
Pure MQL4 — no DLLs or external dependencies
Works on any instrument — Forex, metals, indices, stocks, crypto
No repainting — the color does not change after the bar closes
Supports all timeframes — from M1 to MN
⚠️ Important warning
SpreadMonitor is not a trading system; it is a cost-monitoring tool. The indicator does not provide buy or sell signals; instead, it displays the actual cost of entering the market at any given moment.
Using the indicator does not guarantee profit. All trading decisions are made by the trader.
🏆 About the developer
The indicator was created by Musa Khunarikov, a practicing trader with 12 years of experience trading live accounts (Forex, stocks, MOEX, metals). He holds 51 certificates from the Finam Training Center covering trading, algorithmic trading, and MetaTrader 5.
Services: development of Expert Advisors (EAs), indicators, and panels; trading system audits
📞 Support
30 days of free support after publication.
Bug fixes — within 48 hours.