ATS Lot Sizer

  • Utilità
  • Andrea Michelon
    Andrea Michelon
    5 (2)
    Andy Trading Solutions (ATS). MetaTrader 5 indicators, dashboards and Expert Advisors for XAUUSD and other symbols. Live in the MQL5 Market: free tools, indicators, statistics panels and a risk-management utility.
  • Versione: 1.0

THE LOT FROM YOUR STOP. FREE.

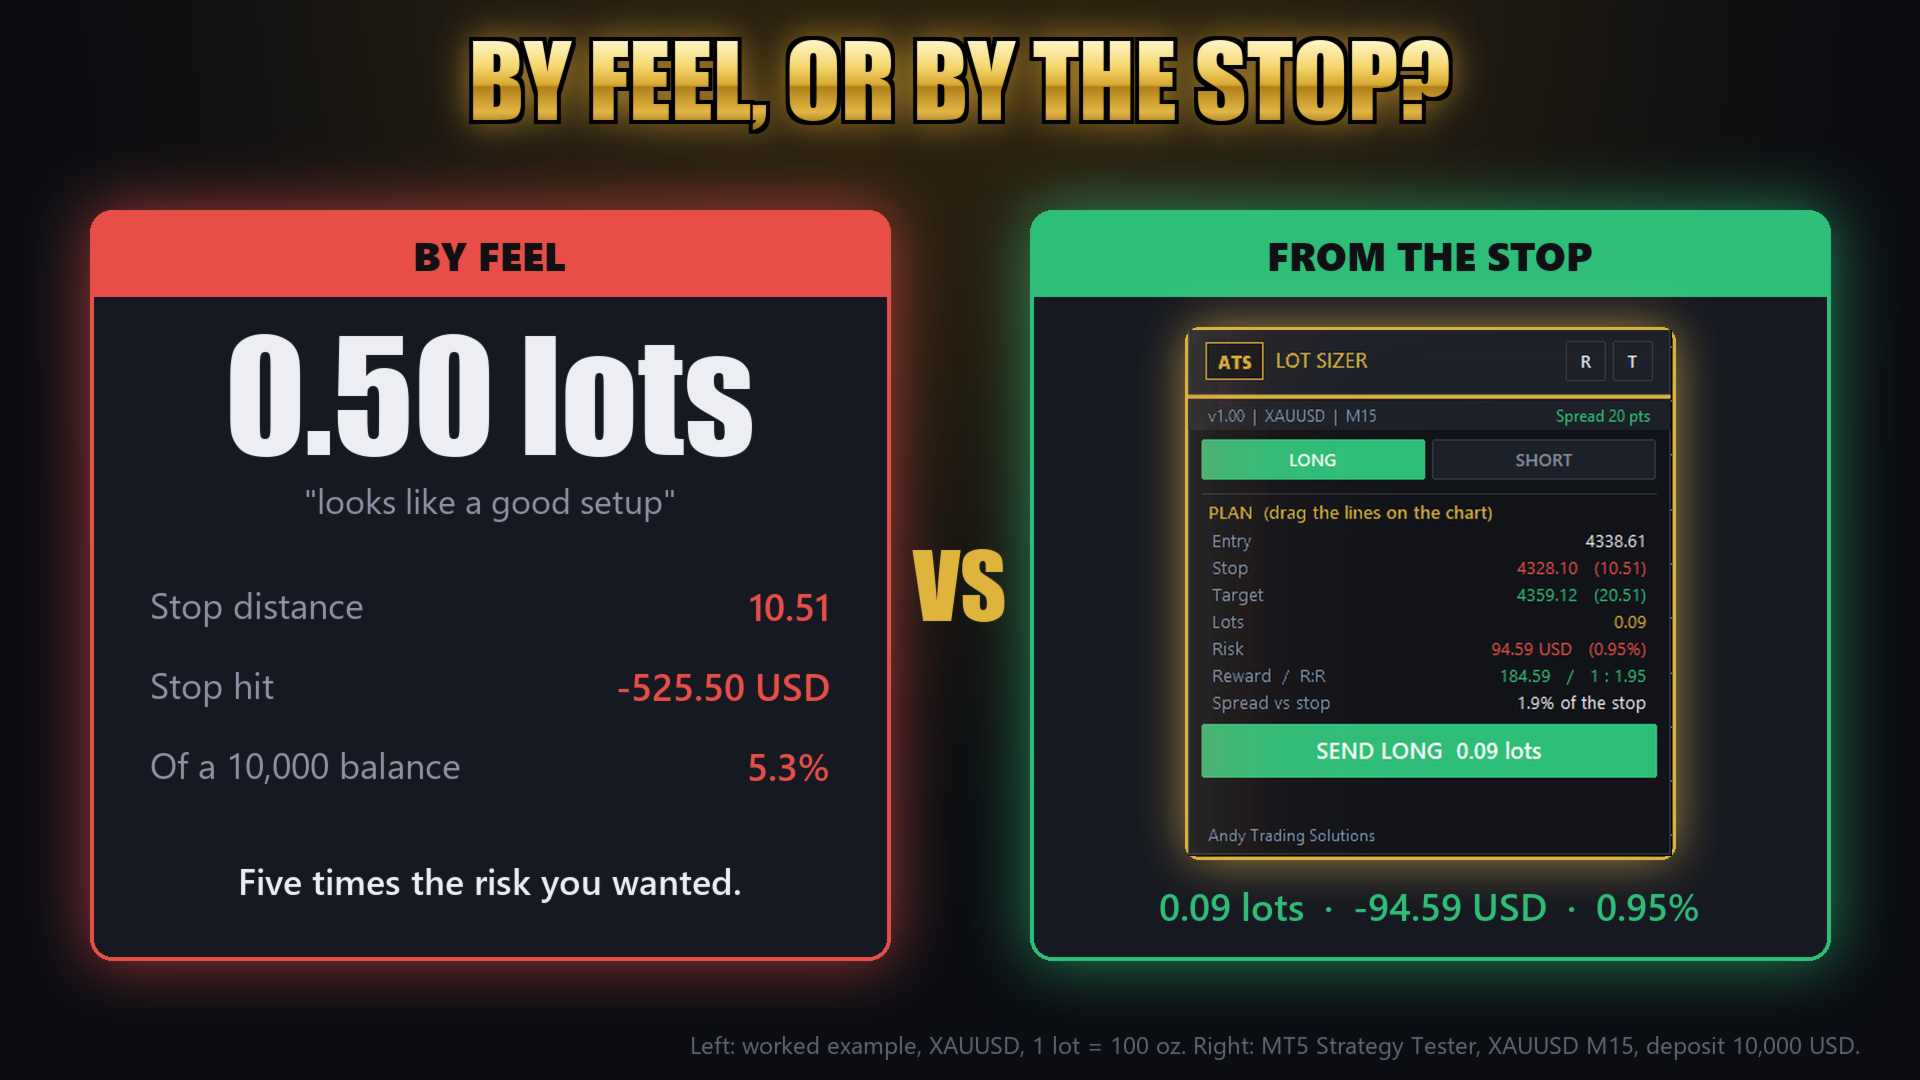
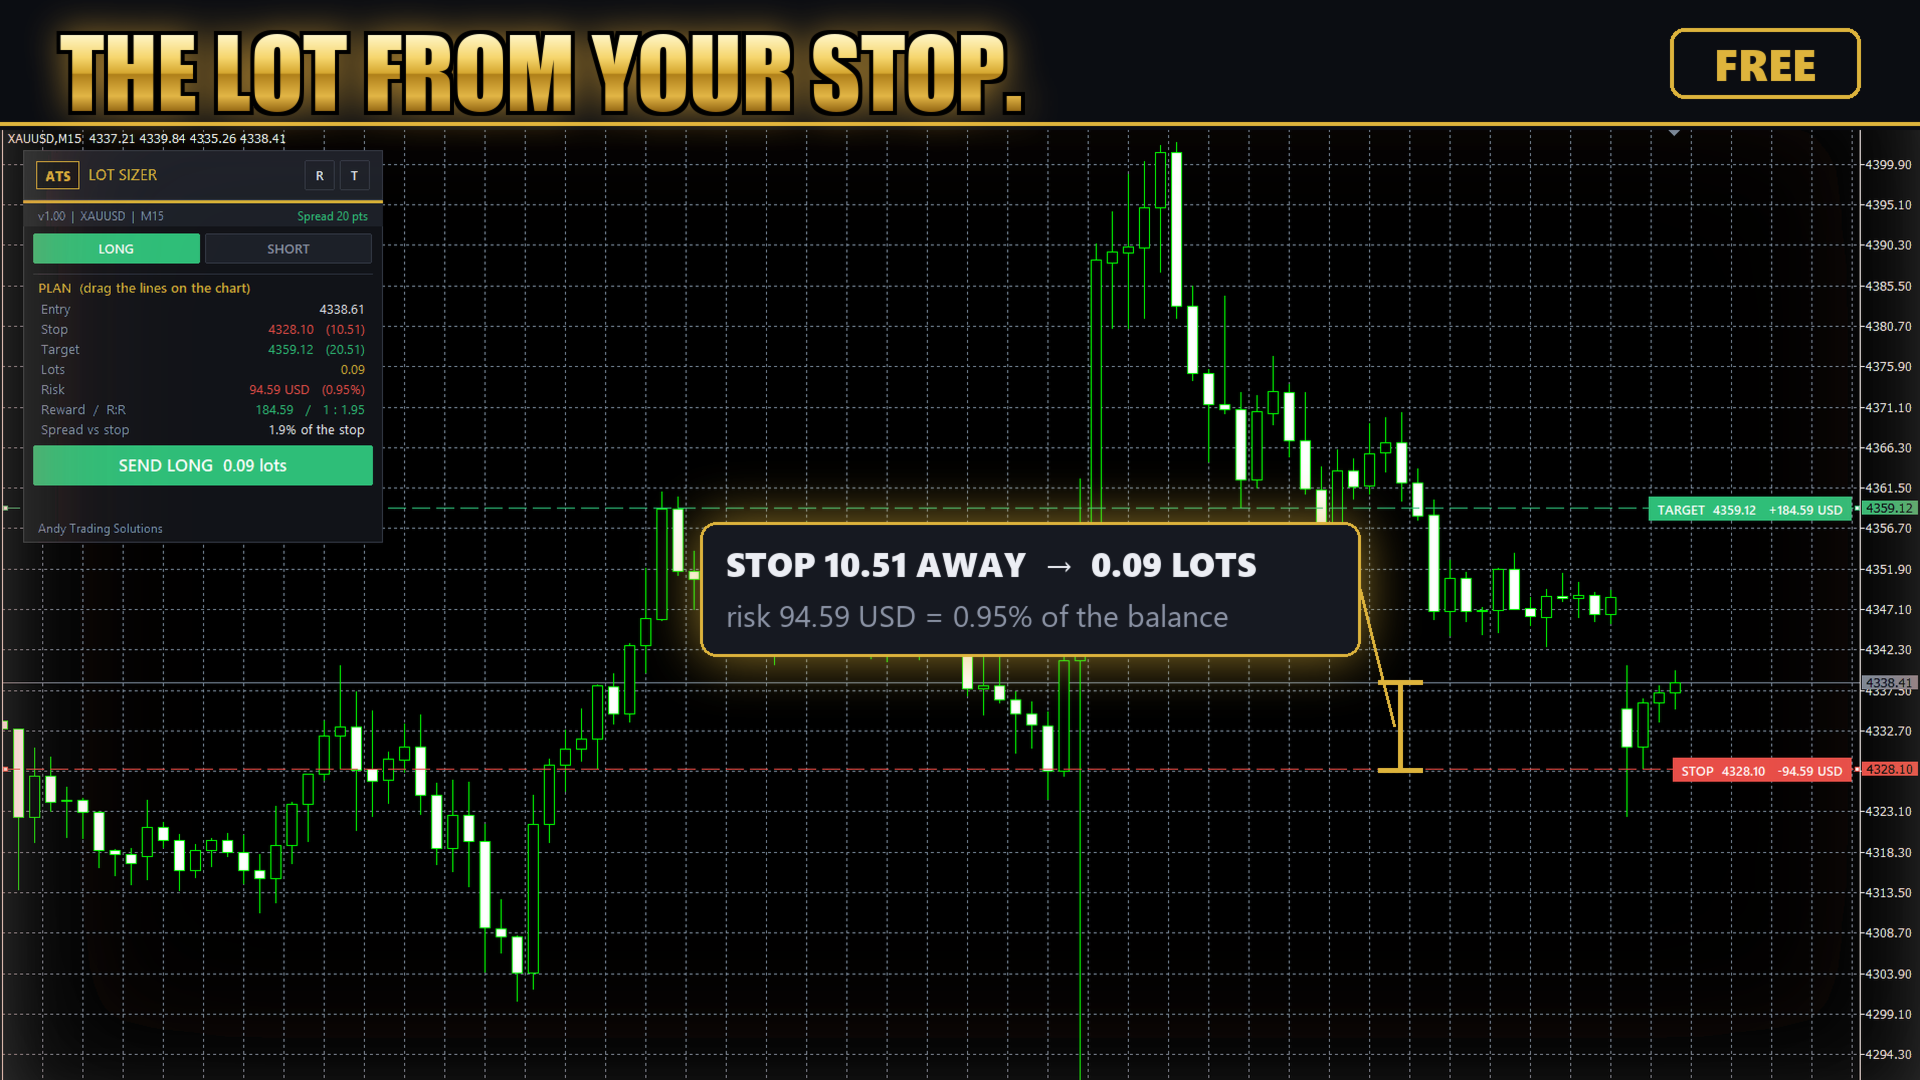
Picking a lot size by feel is how a normal loss becomes a bad day. ATS Lot Sizer puts two lines on your chart, a stop and a target. Drag them, and the panel tells you the lot size that fits your risk and the money that lot really puts on the line. One click sends the trade with the stop and target attached.

HOW IT WORKS

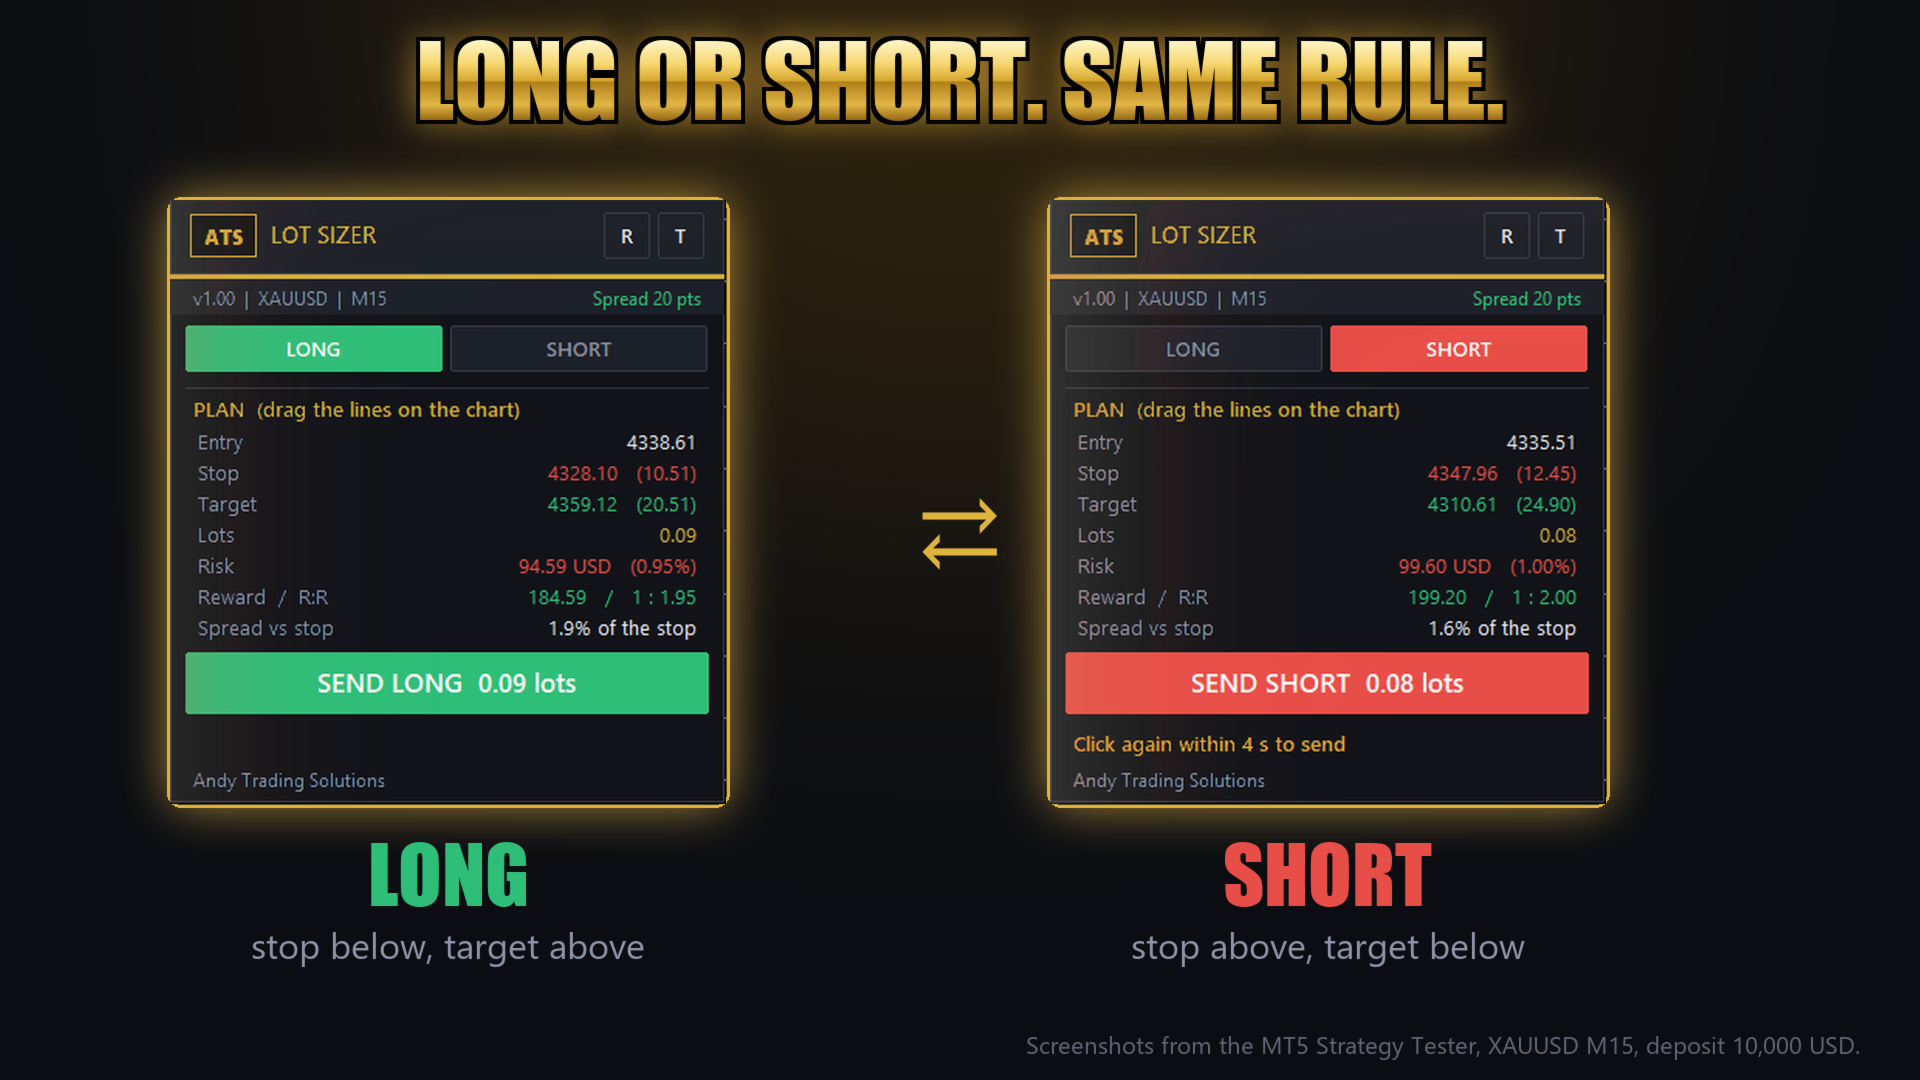
  • Pick LONG or SHORT. A stop line and a target line appear on the chart. Drag them.
  • Lots = your risk (percent of balance, percent of equity, or a fixed sum) divided by the stop distance, floored to the lot step, never rounded up.
  • The panel shows what that lot really loses, not the budget you asked for.
  • The target follows your stop at the R you set until you drag it yourself.
  • Boxed tags on the right edge show STOP and TARGET with the money at stake.
  • SEND arms on the first click and confirms on the second, so a slip of the finger sends nothing (can be switched off).

THE PLAN

Entry, stop and target with their distances, lots, risk in money and in percent, reward and R:R, and how much of your stop the spread eats. If the plan cannot work (stop on the wrong side, closer than the broker minimum, lot below the minimum, not enough margin), the button says NOT READY and the panel tells you why.

THE PANEL

Symbol, timeframe and spread in the header. The R button switches the risk between 0.25, 0.5, 1, 1.5 and 2 percent. Dark, light and automatic themes, draggable, sharp on high resolution monitors.

WORKS ON

Any symbol, hedging or netting accounts. Nothing here decides what to trade: no signals, no strategy.

WANT MORE?

ATS Risk Desk, the full edition from the same author, adds break-even, partial close, close all, auto break-even and trailing, the risk of all your open trades, and a daily loss lock that blocks the send button for the rest of the day.

GOOD TO KNOW

  • Stops and targets go to the broker with the order; the broker's minimum distance and freeze level apply.
  • Distances are in price units (on gold, 3.0 means 3 USD).
  • Test it on a demo account first. In the Strategy Tester use the visual mode: the panel works there.
  • Trading involves risk. This tool helps you size a trade; it does not remove the risk.

SETTINGS

Risk source and value, lot cap, default stop (fixed or 1.5 x ATR 14) and target in R, confirm step, spread warning, magic number, slippage, panel position and theme.

Andy Trading Solutions
Altri dall’autore
ATS Fibonacci Golden Zones draws Fibonacci retracements the way a discretionary trader would, without the guesswork: it finds the last significant swing on your chart timeframe by itself and marks the levels that matter. No repaint. A swing high or low is accepted only after a fixed number of confirming bars on each side (8 by default). Once a swing is confirmed, the levels stay where they were. What you see on the chart: Automatic swing detection, with the A (impulse start) and B (impulse end)
FREE
ATS Daily Volume Profile shows where the market actually traded today and yesterday: a horizontal volume histogram for each day, the POC (the most traded price) and the value area. WHAT YOU SEE - Daily volume profile for today and yesterday, drawn behind the candles - Heat colours: cold blue where little was traded, gold and red where most of the volume was - 3D depth shadow on every row (can be switched off) - POC as a thick gold line, value area high and low as dotted lines, rows outside the v
FREE
ATS Daily Performance shows your profit and loss day by day for the last 30 days, as bars and numbers on a compact dashboard on your chart. Open it and see at a glance which days made money, which lost, and how your month is going. WHAT YOU SEE - One bar per day: green for a winning day, red for a losing one - Net result of the last 30 days, today's result and the profit or loss of the trades still open - Win rate, winning days, profit factor, best day and worst day - The last 7 days listed wit
FREE
BASTA SCOMMETTERE. INIZIA A CALCOLARE. Sei stanco di grafici disordinati, indicatori che ridipingono (repaint) e segnali falsi che ti fanno entrare quando il mercato è laterale?  Andy Universal Sniper Pro  non è il solito indicatore magico. È un  Sistema di Trading Algoritmico  completo, progettato per lo scalping manuale su Oro (Gold), Indici e Forex. La filosofia è semplice:  Pulizia e Precisione.  L'indicatore nasconde il rumore di fondo e ti mostra solo due cose: DOVE ANDARE (La Mappa):
Titolo: Gold Liquidity Matrix - SMC & Z-Score Volume Descrizione: La maggior parte degli indicatori SMC (Smart Money Concepts) fallisce per un semplice motivo: disegna troppe zone, creando rumore a grafico e confusione. Gold Liquidity Matrix (GLM) è diverso. È un sistema di trading ibrido, quantitativo e pragmatico, costruito specificamente per XAUUSD. Non si limita a guardare la price action; combina la logica Istituzionale SMC con un'avanzata Analisi Volumetrica Z-Score per filtrare i falsi mo
ATS Indicator
Andrea Michelon
AndyTrading SMC - Professional Market Structure & Order Blocks Smetti di inseguire il prezzo. Inizia a leggere le impronte delle istituzioni. Nel trading, la semplicità è l'ultima sofisticazione. Mentre gli altri indicatori riempiono il grafico di sigle incomprensibili, AndyTrading SMC parla la lingua del profitto: Continuazione o Inversione. AndyTrading SMC è un indicatore di livello istituzionale progettato per isolare i movimenti reali del mercato, automatizzando l'analisi della Price Action
ATS Gold Command is an all-in-one decision-support indicator for XAUUSD. It was built with a simple philosophy: only include tools whose rules survived systematic backtesting and walk-forward validation on two years of Gold data. Everything works on closed bars only - no repainting, no signal that appears and then disappears. WHAT YOU GET - 5 MODULES IN ONE PANEL 1. SESSION EDGE WINDOWS (A/B/C badge) The indicator grades the trading day for Gold. Window A = London hours on M15. Window B = New Yo
ATS Fibonacci Zones Multi Timeframe finds the last significant swing by itself, draws the retracement levels that matter as zones, and tells you how many lots your stop allows. It is the full edition of the free ATS Fibonacci Golden Zones. No repaint. A swing high or low is only accepted after a fixed number of confirming bars on each side (default 8). Once a swing is confirmed it stays where it was: levels never move backwards to fit the chart. MULTI-TIMEFRAME SWING Take the swing from a higher
Every trading session leaves a high and a low, and those two prices become the liquidity targets of the following hours. ATS Killzones Liquidity Statistics draws them for you and, above all, tells you how often they are really taken, so you know whether you are looking at a target or at a wall. WHAT IT DRAWS - Session boxes (killzones) for Asia, London, New York AM and New York PM, with times set in GMT. The broker server offset is detected automatically, or you can set it by hand - The high and
ATS Volume Profile Statistics shows where the market actually traded, day by day, and measures how the key volume levels behaved on YOUR symbol and broker. It is the full edition of the free ATS Daily Volume Profile. WHAT YOU SEE - Daily volume profiles for the last 1 to 30 days, drawn behind the candles - Heat colours: cold blue where little was traded, gold and red where most of the volume was - 3D depth shadow on every row (can be switched off) - POC (most traded price) as a thick gold line,
SIX CHECKS. ONE GRADE. Most breakout signals on gold lose money. This one is graded. Every XAUUSD breakout on M15 is scored against six objective checks and gets a grade: A, B or C. You see the full trade plan (entry, stop, target, lot size), the six checks one by one, and how every past signal ended, written on your chart. WHY A GRADE We tested the same breakout on XAUUSD M15, May 2024 to September 2026, with the broker's real spread, a 2R target and one position at a time. Taken on every signa
ATS Gold Bias
Andrea Michelon
WHICH SIDE IS OPEN? You trade gold on M5 or M15, but the trend that matters is on H1. ATS Gold Bias puts the H1 picture on the chart you trade, so you never have to switch timeframes to know which side is open. THE H1 BIAS LINE The H1 EMA 50 drawn on your chart, bar by bar Green while the last closed H1 bar is above it: longs allowed Red while it is below: shorts allowed A dot where the bias turned, plus an optional popup or push alert THE PANEL The side that is open, and since when (date, hour
FREE
ATS Risk Desk
Andrea Michelon
SIZE FROM THE STOP. LOCK THE DAY. Most losing days do not start with a bad setup. They start with a lot size picked by feel, then a second trade to win the first one back. ATS Risk Desk sizes every trade from your stop, sends it in one click, manages it, and locks you out when the day's limit is gone. HOW IT WORKS Pick LONG or SHORT. A stop line and a target line appear on the chart. Drag them. Lots = your risk (percent of balance, percent of equity, or a fixed sum) divided by the stop distance,
Filtro:
Nessuna recensione
Rispondi alla recensione