ATS Round Number Cascade Stats

ATS Round Number Cascade Stats misura cosa ha fatto il prezzo dopo aver attraversato i livelli tondi sul tuo simbolo, usando lo storico prezzi del tuo broker. Il risultato compare in un pannello nell'angolo del grafico. I livelli sono disegnati come linee sul grafico.

Molti trader guardano i prezzi tondi come possibili livelli di reazione. Questo indicatore non dà per scontato che contino. Conta cosa è successo dopo ogni attraversamento e lo confronta con livelli scelti a caso.

Cosa misura

  • Ogni primo attraversamento di un livello tondo dopo che il prezzo è stato ad almeno 1 ATR dall'altra parte nelle 3 ore precedenti, senza attraversamenti nel frattempo. Un livello così si chiama "armed".
  • ATR significa Average True Range: l'ampiezza tipica di una barra da 15 minuti. Tutte le distanze sono in questa unità, così si possono confrontare simboli diversi.
  • Dove si trovava il prezzo 15, 30 e 60 minuti dopo l'attraversamento, nella direzione dell'attraversamento.
  • Quante volte il prezzo ha fatto 1 ATR nella direzione dell'attraversamento prima di fare 1 ATR contro.
  • Gli stessi numeri per livelli casuali: la griglia dei livelli spostata ogni giorno di una parte casuale del passo, in 5 serie diverse.
  • Una statistica t per la differenza tra livelli tondi e casuali a 60 minuti, con gli attraversamenti raggruppati per giorno. La statistica t confronta la differenza con la sua variazione tipica. Più è lontana da zero (circa 2 o più, in una delle due direzioni), meno la differenza sembra una variazione casuale. Non dimostra che i livelli si possano tradare.

Il verdetto in cima al pannello

  • LEVELS MATTER: t è 2 o più. Dopo un attraversamento il prezzo si è mosso più lontano nella direzione dell'attraversamento rispetto ai livelli casuali.
  • NO MEASURABLE EFFECT: t è tra -2 e 2. I livelli tondi si sono comportati come quelli casuali.
  • LEVELS REJECT: t è -2 o meno. Dopo un attraversamento il prezzo si è mosso in media meno lontano nella direzione dell'attraversamento rispetto ai livelli casuali.
  • SAMPLE TOO SMALL: trovati meno di 60 attraversamenti. Usa uno storico più lungo o un passo più piccolo.

I risultati dipendono dal simbolo, dal passo e dal periodo. Tutti i numeri descrivono il passato. Non sono una previsione, non sono un risultato di trading e non includono spread o altri costi.

Cosa vedi

  • Livelli tondi disegnati sopra e sotto il prezzo, con i livelli armed evidenziati
  • Statistiche separate per gli attraversamenti verso l'alto e verso il basso
  • Barre di confronto tra livelli tondi e casuali a 15, 30 e 60 minuti
  • Numero di attraversamenti, anni coperti, passo, barre di base (5 minuti o 1 minuto) e lo spread tipico come quota dell'ATR
  • Avviso e notifica push facoltativi quando un livello armed viene attraversato. Gli avvisi partono quando sono stati misurati almeno 60 attraversamenti.

Note

  • L'indicatore non apre, modifica o chiude mai un ordine. Non dà segnali di acquisto o vendita.
  • Le statistiche richiedono uno storico lungo. Imposta "Max bars in chart" nel terminale (Tools > Options > Charts) su un valore alto.
  • I numeri vengono dai dati passati del tuo broker. Broker e periodi diversi danno numeri diversi.
  • Le statistiche usano solo barre chiuse. L'avviso reagisce alla barra corrente.
  • Se +1 ATR e -1 ATR vengono toccati entrambi nella stessa barra, il caso conta come contro. Gli attraversamenti in cui nessuno dei due è raggiunto entro 60 minuti non contano in nessuno dei due gruppi.
  • Il calcolo pesante viene fatto all'avvio e poi ogni 7 giorni.
  • Esportazione facoltativa di ogni attraversamento misurato in un file di testo separato da virgole (CSV, nella cartella Common\Files), per controllare i numeri da solo.
  • Due buffer di sola lettura per il tuo Expert Advisor: buffer 0 = statistica t (vuoto sotto i 60 attraversamenti), buffer 1 = numero di attraversamenti.

Impostazioni

Passo tondo (0 = automatico, circa l'1,2% del prezzo), timeframe di base per le statistiche, numero massimo di barre, numero di livelli sopra e sotto, avvisi e notifiche push, colori dei livelli, esportazione in file di testo separato da virgole, dimensione e posizione del pannello.

Funziona su qualsiasi simbolo e timeframe. Dimensione del pannello da 0,6 a 1,2 (predefinita circa 330 x 575 pixel), posizione impostata negli input.

Andy Trading Solutions

Prodotti consigliati
L'indicatore costruisce le quotazioni attuali, che possono essere confrontate con quelle storiche e su questa base fanno una previsione del movimento dei prezzi. L'indicatore ha un campo di testo per una rapida navigazione fino alla data desiderata. Opzioni: Simbolo - selezione del simbolo che visualizzerà l'indicatore; SymbolPeriod - selezione del periodo da cui l'indicatore prenderà i dati; IndicatorColor - colore dell'indicatore; HorisontalShift - spostamento delle virgolette disegnate d
Deriv Synthetic HTF Candle Projection GMT2 Higher Timeframe Candle Projection & Previous Levels Tool for Deriv Synthetic Indices (MT5) Overview Deriv Synthetic HTF Candle Projection GMT2 is a professional MetaTrader 5 indicator built specifically for Deriv Synthetic indices . It projects the current forming Higher Timeframe (HTF) candle onto the chart and automatically draws key reference levels from previous candles. This indicator is designed to help traders maintain higher timeframe context
FREE
Smart Volume Profile
Mattia Impicciatore
4.73 (15)
Smart Volume Profile è un indicatore professionale di profilo volumetrico che calcola e visualizza in tempo reale la distribuzione dei volumi tra due linee verticali, con segmentazione compratori venditori e livelli POC VAH VAL. Progettato per operatività discrezionale e sistematica, consente di leggere dove il mercato ha scambiato di più e come si è distribuita la pressione tra acquisti e vendite nel periodo selezionato. Perché questo indicatore Controllo totale del periodo di analisi grazie a
FREE
MultiSession Volume Profile is a professional volume profile indicator for MetaTrader 5 that builds separate POC, VAH, VAL and volume histograms for multiple custom trading sessions on the same chart. It helps you see where volume truly concentrated in each part of the day (RTH, Globex, Asia, London, etc.), so you can identify key intraday levels, ranges, and magnets that many standard tools miss. ​ Main advantages Multi-session profiles Build up to 5 fully independent sessions with custom times
Smart Currency Strength is a powerful yet simple indicator that measures the strength of individual currencies. It features a graphic panel that lists the main currencies and their strength in each timeframe, ranging from 0 (most oversold) to 100 (most overbought). The strength for all currencies in the current timeframe is also shown in a separate window as a multi-line graph, where each currency is represented with a different color, this allows you to monitor the evolution of strength trend
VR Grid Mt5
Vladimir Pastushak
3.25 (8)
L'indicatore Griglia VR è progettato per creare una griglia grafica con impostazioni definite dall'utente. A differenza della griglia standard , VR Grid viene utilizzata per costruire livelli circolari . A seconda della scelta dell'utente, il passaggio tra i livelli rotondi può essere arbitrario. Inoltre, a differenza di altri indicatori e utilità, VR Grid mantiene la posizione della griglia anche quando cambia l'intervallo di tempo o si riavvia il terminale. È possibile ottenere impostazioni, f
FREE
NeuronQuant is a premium quant analytics indicator for MetaTrader 5 from Neuron Systems. It reads the chart with the kind of statistical tools common in quantitative analysis: a forward expected-move range, realized volatility, a market-regime read and a standardized z-score. It is an indicator for chart analysis only: it does not place, modify or close trades, it does not send orders, and it does not manage positions or accounts. Native MQL5, no DLLs, non-repainting closed-bar logic. Works on a
Moving Spread
Jose Maria Molina Sanchez
Moving Spread – Monitor dei Costi di Mercato in Tempo Reale Monitora lo spread medio in tempo reale ed evita di operare durante periodi ad alto costo. Cosa fa questo indicatore Moving Spread misura lo spread medio (in punti) del mercato in tempo reale, mostrando come varia nel tempo. È uno strumento essenziale per i trader che vogliono capire quando il costo d'ingresso è troppo elevato, poiché può erodere i profitti anche prima che un'operazione abbia inizio. Perché è importante? Uno spre
FREE
Price Magnet — Price Density and Attraction Levels Indicator Price Magnet is a professional analytical tool designed to identify key support and resistance levels based on statistical Price Density. The indicator analyzes a specified historical period and detects price levels where the market spent the most time. These zones act as “magnets,” attracting price action or forming a structural base for potential reversals. Unlike traditional Volume Profile tools, Price Magnet focuses on price-time d
SMART EXIT Currency Strength Meter is a professional Forex currency strength indicator designed to identify the strongest and weakest currencies in real time. The indicator analyzes 27 major Forex pairs and ranks the 8 major currencies according to their relative strength. By combining EMA momentum analysis with volatility-adjusted calculations, traders can quickly identify market leaders and laggards without manually reviewing dozens of charts. Main Features • Real-time ranking of the 8 major c
EUR/USD Trade Plan Assistant Manual EUR/USD entry and risk-planning indicator for MetaTrader 5. It displays confirmed trade plans with entry, stop, target, position volume, time limit and combined account risk in a clear chart interface. Product description EUR/USD Trade Plan Assistant is designed for traders who want structured EUR/USD trade plans without automatic order execution. The indicator continuously evaluates EUR/USD and can display up to three independent trade plans based on differen
Candle Time Phases Et Indicator - Split any candle into three time-based phases and control the sequential development of the candle in real time. Candle Time Phases is a precision timing indicator that divides the current candle into three time-based phases as a percentage of its total duration. The indicator determines and clearly separates the initial uncertainty phase, the main movement, and the completion phase, while also analyzing the structure and sequential development of the candle in
FREE
Metis Hurst Regime
Victor Gomez Sanchez
Metis Hurst Regime — is the market trending, mean-reverting or just random? This indicator estimates the Hurst exponent of the recent price series — a statistical measure of memory. It tells you whether moves have tended to continue (trending), to reverse (mean-reverting) or to show no memory at all (random walk), and how much confidence that reading deserves. Knowing the current regime helps you choose the right kind of strategy: trend-following logic suffers in mean-reverting conditions and vi
FREE
Koryu Delta Koryu Delta è un indicatore MetaTrader 5. Identifica i punti di inversione di tendenza utilizzando l'analisi dei punti pivot e i dati del volume delta. Rileva i pattern di Market Shift e mostra segnali basati sulle dinamiche di mercato. Questo strumento può essere utilizzato dai trader che fanno scalping, swing trading o investimenti a lungo termine. Analizza fino a 500 barre storiche per individuare pattern passati. Utilizza la logica a barre chiuse per i segnali. Caratteristiche d
FREE
Symbol Cost Info
Opeyemi Fuad Anokwu
Introducing the “Symbol Cost Info MT5” indicator – your ultimate tool for staying ahead in the forex market! This innovative indicator is designed to empower traders with real-time cost information, directly on their charts. Here’s why every trader needs the “Symbol Cost Info MT5” in their arsenal: Real-Time Spread Monitoring : Keep a close eye on the spread for any currency pair, ensuring you enter the market at the most cost-effective times. Pip Value at Your Fingertips : Instantly know the v
FREE
Paid release: Cumulative Delta Flow MT5 is a paid MetaCoderStore indicator. Use the product comments for setup questions, feature requests, and feedback for future updates. Cumulative Delta Flow MT5 is a separate-window tick-volume flow oscillator for MetaTrader 5. It estimates signed buying and selling pressure from candle position, candle direction, and tick volume, then plots a cumulative delta line with a signal line and divergence markers. Use it to spot: Positive and negative tick-volume p
Gold Venamax MT5
Sergei Linskii
3.5 (2)
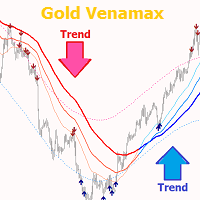
Gold Venamax : questo è il miglior indicatore tecnico azionario. L'algoritmo dell'indicatore analizza il movimento dei prezzi di un asset e riflette la volatilità e le potenziali zone di ingresso. Caratteristiche dell'indicatore: Questo è un super indicatore con Magic e due blocchi di frecce di tendenza per un trading comodo e redditizio. Sul grafico viene visualizzato il pulsante rosso per cambiare blocco. Magic è impostato nelle impostazioni dell'indicatore, in modo da poter installare l'indi
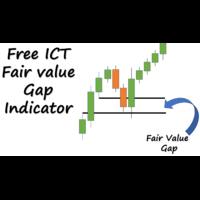
An ICT fair value gap is a trading concept that identifies market imbalances based on a three-candle sequence. The middle candle has a large body while the adjacent candles have upper and lower wicks that do not overlap with the middle candle. This formation suggests that there is an imbalance where buying and selling powers are not equal. Settings Minimum size of FVG (pips) -> FVGs less than the indicated pips will be not be drawn Show touched FVGs Normal FVG color -> color of FVG that hasn't
FREE
This is a multi timeframe version of the  Supply and Demand indicator . It allows you to analyze a chart using the law of supply and demand on three different timeframes at a time. You will see zones of sales and purchases and determine the most profitable points to open positions. The indicator is based on the principle of market fractality. Supply and demand zones show places where a strong buyer or seller has made the price reverse and change its direction. The indicator has several types of
FREE
Professional Overview: AMD MODEL PRO PLUS v4 + Uptrick Flow Expansion Trend (Combined) Executive Summary This is an institutional-grade trading indicator that merges two powerful methodologies into a single, dual-confirmation system: · AMD Model Pro Plus v4 - ICT-style Power of 3 (PO3) session-based market structure analysis · Uptrick Flow Expansion Trend - Adaptive flow midline with trend detection The combination creates a system where macro session structure (AMD) aligns with micro price
The   Pairs Spread indicator   has been developed for the popular strategy known as pairs trading, spread trading, or statistical arbitrage. This indicator measures the distance (spread) between prices of two directly (positively) correlated instruments and shows the result as a curve with standard deviations. So, traders can quickly identify when the instruments are too far apart and use this information for trade opportunities.  How to use the Pairs Spread indicator Best results are attained
Italian Questo indicatore funge da assistente avanzato per l'analisi dei grafici per i trader che amano operare con i Pattern Grafici (Chart Patterns). È progettato per ridurre il carico dell'analisi visiva e aumentare la precisione nell'ottenere profitti. Caratteristiche principali di questo indicatore dal punto di vista dell'utilizzo pratico: 1. Rilevamento automatico dei pattern (Automated Pattern Detection) Risparmia tempo e riduce le distorsioni (Bias): Non è necessario tracciare manualment
PivotWave
Jeffrey Quiatchon
Introducing PivotWave – your ultimate trading companion that redefines precision and market analysis. Designed with traders in mind, PivotWave is more than just an indicator; it’s a powerful tool that captures the pulse of the market, identifying key turning points and trends with pinpoint accuracy. PivotWave leverages advanced algorithms to provide clear visual signals for optimal entry and exit points, making it easier for traders to navigate volatile market conditions. Whether you are a begin
Bookmap pro
Ahmed Mohammed Bakr Bakr
FREE Bookmap Volume Heatmap Indicator Overview The   Bookmap Volume Heatmap   is a custom MetaTrader 5 (MQL5) indicator that creates a visual heatmap of trading volume distribution across price levels, similar to professional trading platforms like Bookmap. It provides traders with a clear visualization of where significant trading activity has occurred within a specified price range. Key Features 1.   Volume Distribution Visualization Creates color-coded rectangles on the chart representing vol
FREE
Real-Time Spread Display Tool A   real-time spread display tool   is a specialized software or application designed to provide traders and investors with instant, live data on the   spread —the difference between the bid price (the price at which buyers are willing to purchase an asset) and the ask price (the price at which sellers are willing to sell it)—for various financial instruments. This tool is critical in markets such as forex (FX), stocks, futures, and cryptocurrencies, where price f
Symbol: EURUSD Timeframe: 30 minutes (M30) For other symbols or timeframes, adjust the settings to match the market. Volume Profile POC Breakout builds a volume profile from recent candles, finds the Point of Control (POC) and marks clean breakouts of that level. Each breakout is shown as a complete trade plan with entry, stop loss and three take profit levels, filtered by the higher timeframe trend and rated by a quality score. The indicator does not open trades. It is a visual and analysis to
RFX5 Forex Strength Meter
Rasoul Mojtahedzadeh
5 (1)
RFX Forex Strength Meter is a powerful tool to trade 8 major currencies in the Forex market, U.S. Dollar ( USD ) European Euro ( EUR ) British Pound ( GBP ) Swiss Franc ( CHF ) Japanese Yen ( JPY ) Australian Dollar ( AUD ) Canadian Dollar ( CAD ) New Zealand Dollar ( NZD ) The indicator calculates the strength of each major currency using a unique and accurate formula starting at the beginning of each trading day of your broker. Any trading strategy in the Forex market can be greatly improved b
Buyer Seller Arrows – Opera con fiducia! Scopri uno strumento rivoluzionario per l’analisi visiva della forza di acquirenti e venditori su tutti i timeframe – da M1 fino a MN1. Questo indicatore ti offre una panoramica immediata della dinamica del mercato grazie a percentuali e frecce codificate a colori. Funzionalità principali: Frecce verdi verso l’alto = predominanza degli acquirenti Frecce rosse verso il basso = predominanza dei venditori Percentuale di forza per ogni timeframe (M1, M5
BoxChart MT5
Evgeny Shevtsov
5 (7)
The market is unfair if only because 10% of participants manage 90% of funds. An ordinary trader has slim changes to stand against these "vultures". This problem can be solved. You just need to be among these 10%, learn to predict their intentions and move with them. Volume is the only preemptive factor that faultlessly works on any timeframe and symbol. First, the volume appears and is accumulated, and only then the price moves. The price moves from one volume to another. Areas of volume accumu
VolumeDeltaBars
Stanislav Korotky
This indicator is a conventional analytical tool for tick volumes changes. It calculates tick volumes for buys and sells separately, and their delta on every bar, and displays volumes by price clusters (cells) within a specified bar (usually the latest one). The algorithm used internally is the same as in the indicator VolumeDeltaMT5 , but results are shown as cumulative volume delta bars (candlesticks). Analogous indicator for MetaTrader 4 exists - CumulativeDeltaBars . This is a limited substi
Gli utenti di questo prodotto hanno anche acquistato
Trend Sniper X
Sarvarbek Abduvoxobov
4.9 (42)
Trend Sniper X è un indicatore trend-following multi-timeframe per MetaTrader 5 che aiuta i trader a identificare la direzione del trend e i potenziali punti di inversione con chiarezza e precisione. per MT4: https://www.mql5.com/en/market/product/193245 Informazioni sul prezzo: Il prezzo attuale è promozionale ed è soggetto a modifiche con il rilascio di futuri aggiornamenti e nuove funzionalità. Offerta Bonus: Per ricevere GRATIS l'Auto-Trade Assistant EA per questo indicatore, invia un messa
Smart Trend Trading System — MetaTrader 5 Dopo l'acquisto, inviami un messaggio su MQL5 per ricevere GRATUITAMENTE Smart Universal Expert Advisor, insieme al corso online, al manuale PDF e all'accesso al gruppo privato. STTS riunisce la direzione del trend, i segnali di entrata e uscita, le zone di inversione e i livelli di prezzo importanti direttamente sul grafico. Segui il sistema manualmente oppure collega un EA compatibile separato per eseguire le operazioni automaticamente con le impostazi
SMC Intraday Formula
VividMind Digital Solutions
5 (26)
Cominciamo con la verità. Nessun indicatore da solo ti renderà profittevole. Se qualcuno ti dice il contrario, ti sta vendendo un sogno. Qualsiasi indicatore che mostra frecce perfette di acquisto/vendita può essere reso impeccabile — basta ingrandire la giusta sezione della storia e catturare solo i trade vincenti. Noi non lo facciamo.  SMC Intraday Formula è uno strumento. Legge la struttura del mercato per te, identifica le zone a più alta probabilità e ti mostra esattamente come appare la t
SuperScalp Pro
Van Minh Nguyen
4.56 (36)
SuperScalp Pro - Professional Multi-Layer Confluence Scalping System SuperScalp Pro è un indicatore avanzato per lo scalping che migliora il Supertrend classico attraverso diversi filtri intelligenti di conferma. Aiuta a identificare opportunità di Buy/Sell con una probabilità maggiore, riducendo significativamente i falsi segnali. Le frecce Buy e Sell vengono visualizzate direttamente sul grafico, mentre i livelli di Stop Loss e Take Profit basati sull’ATR vengono calcolati automaticamente in t
Un nuovo Re in città - Indicatore + Gestione ordini (TP1 + TP2 + TP3) + Invio opzionale di segnali Telegram INCLUSO (GRATIS) (SISTEMA COMPLETO DI TRADING e SEGNALI) Il nostro miglior EA per l’Oro: Gold Slayer Questo indicatore include una strategia avanzata, un sistema di trading con gestione ordini personalizzabile e un sistema mean reversion che combina estensioni di envelope, supportato da molteplici filtri intelligenti di conferma come RSI per individuare ingressi di inversione ad alta proba
M5 Sniper
MeanFX
5 (3)
Porta il tuo vantaggio nel trading sotto i riflettori! M5 Sniper è un nuovo indicatore di MeanFX. Combina segnali di trading precisi con livelli TP/SL adattivi , creando così le migliori operazioni statistiche possibili! Il prezzo aumenta ogni 5 acquisti, il prossimo prezzo è di 69$ Scrivimi dopo l'acquisto per ricevere consigli/guida e un EA bonus Cosa lo rende diverso? Performance statistica comprovata su Gold XAUUSD ( funziona su quasi ogni asset , concentrandosi sulla padronanza di un singol
Boba Analysis Suite
Trade Ready Solutions LLC
5 (1)
Boba Analysis Suite Boba Analysis Suite è un indicatore di analisi per MetaTrader 5. Riunisce la struttura del mercato, le zone di prezzo rilevanti e il contesto generale del mercato in un’unica visualizzazione del grafico. Sviluppato sulla base dell’esperienza pratica come trader e formatore di trading, supporta un processo di analisi strutturato: valutare la direzione del mercato, individuare livelli importanti e analizzare congiuntamente più intervalli temporali. Analisi nel contesto del merc
La leggenda ritorna: Entry Points Pro 10. Il rilancio del leggendario indicatore che per 3 anni è rimasto nella Top-3 del MQL5 Market. Centinaia di recensioni entusiaste (589 su due versioni), migliaia di trader lo usano ogni giorno per operare, 31.000+ download della demo   MT4+MT5 . Ho letto ogni vostra recensione degli ultimi cinque anni — e invece di promesse ho inserito nella versione 10 le risposte. Dall'autore che opera sui mercati dal 1999 e tiene all'onestà, alla propria reputazione e a
M1 Sniper MT5
Oleg Rodin
5 (7)
M1 SNIPER   è un sistema di indicatori di trading facile da usare. Si tratta di un indicatore a freccia progettato per l'intervallo temporale M1. L'indicatore può essere utilizzato come sistema autonomo per lo scalping sull'intervallo temporale M1 e come parte del tuo sistema di trading esistente. Sebbene questo sistema di trading sia stato progettato specificamente per il trading sull'intervallo temporale M1, può comunque essere utilizzato anche con altri intervalli temporali. Inizialmente ho p
Auto Optimized SpeedAngle è un sistema di vettorizzazione del momento di livello istituzionale che elimina l'overfitting ( curve-fitting ) attraverso l'ottimizzazione continua Walk-Forward (WFO). Invece di affidarsi a input statici che si degradano quando i regimi di mercato cambiano, l'indicatore recalibra dinamicamente i suoi parametri utilizzando la validazione Out-of-Sample (OOS), assicurando che i segnali visualizzati rappresentino reali vantaggi statistici anziché anomalie storiche. Quadro
Neuro Poseidon MT5
Daria Rezueva
4.75 (52)
Neuro Poseidon is a new indicator by Daria Rezueva. It combines precise trading signals with adaptive TP/SL levels - creating best possible trades as a result! Message me and get  Neuro Poseidon Assistant  as a gift to automize your trading process! What makes it stand out? 1. Proven profitability on all assets and timeframes 2. Only confirmed BUY and SELL signals present on the chart 3. Adaptive TP & SL levels generated by the software for each trade 4. Easy to understand - suitable for al
Adaptive Price Action Engine Acquista un indicatore, ricevi l'EA gratis Analisi Auto-Ottimizzata del Trend e dei Pattern Candlestick Multi-Timeframe I mercati cambiano continuamente e non tutti i pattern di Price Action hanno lo stesso valore in ogni condizione di mercato. Adaptive Price Action Engine è progettato per adattarsi alle condizioni di mercato in continua evoluzione, combinando struttura del trend, analisi Multi-Timeframe, pattern Candlestick e ottimizzazione statistica in un unico fr
ARIPoint
Temirlan Kdyrkhan
1 (4)
ARIPoint is a powerful trading companion designed to generate high-probability entry signals with dynamic TP/SL/DP levels based on volatility. Built-in performance tracking shows win/loss stats, PP1/PP2 hits, and success rates all updated live. Key Features: Buy/Sell signals with adaptive volatility bands Real-time TP/SL/DP levels based on ATR Built-in MA Filter with optional ATR/StdDev volatility Performance stats panel (Success, Profit/Loss, PP1/PP2) Alerts via popup, sound, push, or email Cu
Break and Retest Hunter is a powerful MetaTrader 5 indicator designed to automatically identify support and resistance levels, breakout structures, and potential retest opportunities in real time. Bonus Indicator: After purchasing Break and Retest Hunter , contact me to receive Trade Indicator Assistant EA completely free as a bonus utility. $65 for the next 10 copies . Next price is $120.  Combining adaptive market analysis, clear BUY/SELL signals, Fibonacci-based profit targets, and a premiu
Gann Made Easy è un sistema di trading Forex professionale e facile da usare che si basa sui migliori principi del trading utilizzando la teoria di mr. WD Gann. L'indicatore fornisce segnali ACQUISTA e VENDI accurati, inclusi i livelli di Stop Loss e Take Profit. Puoi fare trading anche in movimento utilizzando le notifiche PUSH. CONTATTAMI DOPO L'ACQUISTO PER RICEVERE GRATUITAMENTE LE ISTRUZIONI DI TRADING E OTTIMI INDICATORI EXTRA! Probabilmente hai già sentito parlare molte volte dei metodi d
FiboSniper Pro
Van Minh Nguyen
5 (4)
FiboSniper Pro – Multi-Filter Fibonacci System with Auto SL/TP and Control Panel FiboSniper Pro è un indicatore tecnico che combina Fibonacci Envelopes dinamici con diversi filtri di conferma per generare segnali Buy e Sell selezionati. I livelli di Fibonacci vengono calcolati sulla base di Moving Average e ATR e successivamente filtrati tramite ADX, EMA, RSI, ATR, Volume, Time e struttura delle candele. L’indicatore visualizza direttamente sul grafico i livelli automatici di Stop Loss e Take Pr
Tokyo mt5 Indicator
Vasiliy Strukov
5 (10)
Il Tokyo Indicator offre una chiara panoramica visiva della direzione del trend, dei potenziali segnali di trading e delle condizioni di mercato. La sua linea di trend a gradini, codificata a colori, distingue le fasi rialziste (in blu) da quelle ribassiste (in magenta). Frecce direzionali dedicate evidenziano potenziali opportunità di acquisto e vendita al variare del trend visualizzato. Una dashboard integrata riunisce in un'unica visualizzazione pratica il segnale corrente, il bias di mercato
Trend Catcher ind mt5
Ramil Minniakhmetov
5 (18)
INDICATORE TREND CATCHER L'indicatore Trend Catcher analizza i movimenti dei prezzi di mercato, utilizzando una combinazione di indicatori di analisi del trend proprietari dell'autore e personalizzati. Identifica la vera direzione del mercato filtrando il rumore a breve termine e concentrandosi sulla forza del momentum sottostante, sull'espansione della volatilità e sul comportamento della struttura dei prezzi. Utilizza inoltre una combinazione di indicatori personalizzati di smoothing e filtr
Entry In The Zone and SMC Multi Timeframe is a real-time market analysis tool based on Smart Money Concepts (SMC), designed to analyze market structure, price direction, and key trading zones. It supports both Single-Timeframe and Multi-Timeframe Analysis, providing a clearer view of overall market structure across multiple timeframes, with real-time BUY / SELL signals designed with a strict focus on No-Repaint principles. The signals are designed to help filter unclear setups and evaluate tradi
Unix Scalper
Issam Kassas
4 (4)
Unix Scalper — MetaTrader 5 Dopo l'acquisto, inviami un messaggio su MQL5 per ricevere GRATUITAMENTE Smart Universal Expert Advisor, insieme al corso online, al manuale PDF e all'accesso al gruppo privato. Individua il setup. Esamina il piano. Scegli come operare. UNIX Scalper riunisce analisi di mercato, indicazioni BUY/SELL/WAIT e livelli Entry, Stop Loss, TP1 e TP2 in un unico pannello organizzato. VISUALIZZA IL SEGNALE E IL PIANO • Indicazioni chiare: BUY, SELL o WAIT. • Livelli definiti: E
Apex Patterns PRO Acquista l'indicatore - Ottieni GRATUITAMENTE l'Expert Advisor basato su di esso. Intelligenza auto-ottimizzante per pattern grafici e breakout Gli scanner di pattern tradizionali si basano su input fissi, registrando spesso prestazioni inferiori quando la volatilità e le strutture del mercato cambiano. Apex Patterns PRO è progettato per adattarsi alle mutevoli condizioni di mercato combinando il riconoscimento dei pattern grafici strutturali, il filtraggio del momentum e l'au
Scalper Vault è un sistema di trading potente e completo, progettato per i trader che desiderano ottenere risultati costanti nel trading intraday. Questo indicatore ad alta precisione funge da sistema di trading autonomo, offrendo analisi di livello istituzionale sia per il mercato Forex che per le Opzioni Binarie. CONTATTAMI DOPO L'ACQUISTO PER RICEVERE I MIEI CONSIGLI DI TRADING E UN FANTASTICO BONUS! Eliminando le congetture e le complesse analisi manuali, Scalper Vault ti permette di concen
FX Trend MT5 NG
Daniel Stein
5 (6)
FX Trend NG: La Nuova Generazione di Intelligenza di Trend Multi-Mercato Panoramica FX Trend NG è uno strumento professionale di analisi del trend multi-timeframe e monitoraggio dei mercati. Ti consente di comprendere la struttura completa del mercato in pochi secondi. Invece di passare tra numerosi grafici, puoi identificare immediatamente quali strumenti sono in trend, dove il momentum sta diminuendo e dove esiste un forte allineamento tra i timeframe. Offerta di Lancio – Ottieni FX Trend NG
Atomic Analyst MT5
Issam Kassas
4.48 (62)
Atomic Analyst — MetaTrader 5 Dopo l'acquisto, inviami un messaggio su MQL5 per ricevere GRATUITAMENTE Smart Universal Expert Advisor, insieme al corso online, al manuale PDF e all'accesso al gruppo privato. Atomic Analyst riunisce l’azione del prezzo, la direzione del trend, i segnali di entrata e uscita, lo Stop Loss e diversi livelli di Take Profit direttamente sul grafico. INDIVIDUA IL SEGNALE. COMPRENDI IL CONTESTO OPERATIVO. Atomic Analyst organizza la sua analisi in informazioni visive ch
Market Structure Order Block Dashboard MT5 è un indicatore MT5 progettato per i trader che vogliono leggere la struttura di mercato e le principali zone di reazione del prezzo direttamente sul grafico. Combina BOS, ChoCH, Order Blocks, Fair Value Gaps (FVG), Liquidità, Kill Zones, Volume Profile e un pannello compatto per un'analisi rapida. Questo indicatore è rivolto ai trader che utilizzano la struttura di mercato, i concetti ICT e Smart Money come quadro decisionale. Può aiutare a individuare
Quantum TrendPulse
Bogdan Ion Puscasu
5 (26)
Ecco   Quantum TrendPulse   , lo strumento di trading definitivo che combina la potenza di   SuperTrend   ,   RSI   e   Stocastico   in un unico indicatore completo per massimizzare il tuo potenziale di trading. Progettato per i trader che cercano precisione ed efficienza, questo indicatore ti aiuta a identificare con sicurezza le tendenze di mercato, i cambiamenti di momentum e i punti di entrata e uscita ottimali. Caratteristiche principali: Integrazione SuperTrend:   segui facilmente l'andame
RangeXpert Plus
Steve Rosenstock
CLICCA QUI PER VEDERE TUTTI I MIEI PRODOTTI GRATUITI Quando un solo grafico non basta per valutare un breakout — perché il timeframe superiore potrebbe già raccontare un'altra storia — RangeXpert Plus ti mostra tutti i tuoi timeframe in una volta . Sviluppato da me come estensione multi-timeframe del mio indicatore gratuito RangeXpert, disegna sul tuo grafico il segnale, i livelli e le zone di RangeXpert e aggiunge un pannello con una riga per timeframe , ognuna calcolata in modo indipendente
PainX GainX Blue Spike Fusion AI Advanced Synthetic Index Spike Detection Indicator for MetaTrader 5 Discover potential spike setups with a clear, organized, and professional trading interface. PainX GainX Blue Spike Fusion AI is a specialized indicator designed for traders who monitor synthetic indices and want a structured way to observe potential price spike opportunities. The indicator combines signal monitoring, market-condition analysis, visual alerts, and event tracking in one convenient
Divergence Bomber
Ihor Otkydach
4.89 (94)
Ogni acquirente dell’indicatore riceverà inoltre gratuitamente: L’utilità esclusiva “Bomber Utility”, che gestisce automaticamente ogni operazione, imposta i livelli di Stop Loss e Take Profit e chiude le posizioni secondo le regole della strategia I file di configurazione (set file) per adattare l’indicatore a diversi asset I set file per configurare il Bomber Utility in tre modalità: “Rischio Minimo”, “Rischio Bilanciato” e “Strategia di Attesa” Una guida video passo-passo per installare, con
Btmm state engine pro
Garry James Goodchild
5 (4)
BTMM State Engine Pro by G-Labs — Beat The Market Maker indicator for MetaTrader 5. Asian session range, London and New York kill zones, level progression (L1/L2/L3), peak formation detection (PFH/PFL), entry signals, and a multi-pair scanner from one chart. Stop scanning charts one pair at a time. The State Engine tracks the BTMM daily cycle automatically — Asian box, room boundaries, level blocks, peak formations, and filtered entries — while the scanner dashboard shows level, peak status, d
Altri dall’autore
ATS Performance Statistics shows how your account really performed, day by day, week by week and month by month: profit and loss, worst drawdown and highest margin used. Bars and numbers, on a clean dashboard on your chart. The part most statistics tools cannot do: the drawdown and the margin of days you never watched. The indicator rebuilds the equity path of every past day from your deal history and the broker's own tick history, following each position tick by tick, including trades that were
ATS Fibonacci Golden Zones draws Fibonacci retracements the way a discretionary trader would, without the guesswork: it finds the last significant swing on your chart timeframe by itself and marks the levels that matter. No repaint. A swing high or low is accepted only after a fixed number of confirming bars on each side (8 by default). Once a swing is confirmed, the levels stay where they were. What you see on the chart: Automatic swing detection, with the A (impulse start) and B (impulse end)
FREE
ATS Daily Volume Profile shows where the market actually traded today and yesterday: a horizontal volume histogram for each day, the POC (the most traded price) and the value area. WHAT YOU SEE - Daily volume profile for today and yesterday, drawn behind the candles - Heat colours: cold blue where little was traded, gold and red where most of the volume was - 3D depth shadow on every row (can be switched off) - POC as a thick gold line, value area high and low as dotted lines, rows outside the v
FREE
ATS Trade Manager is the site foreman of your trades. Plan a trade on the chart with draggable lines and coloured zones, send it with the lot size worked out from your risk, and let the foreman look after it: break-even, trailing stop, up to three take-profit levels with a partial close at each, a daily loss lock and one panel to close groups of trades. It trades only when you press SEND. PLAN A TRADE ON THE CHART Press PLAN and the chart shows the trade before you take it: a blue line and zone
FREE
ATS Gold Bias
Andrea Michelon
WHICH SIDE IS OPEN? You trade gold on M5 or M15, but the trend that matters is on H1. ATS Gold Bias puts the H1 picture on the chart you trade, so you never have to switch timeframes to know which side is open. THE H1 BIAS LINE The H1 EMA 50 drawn on your chart, bar by bar Green while the last closed H1 bar is above it: longs allowed Red while it is below: shorts allowed A dot where the bias turned, plus an optional popup or push alert THE PANEL The side that is open, and since when (date, hour
FREE
ATS Scalping Cost Map mostra, ora per ora, quanto costa un'operazione completa (apertura e chiusura di un trade) sul tuo simbolo rispetto a quanto si muove di solito il prezzo in 15 minuti in quell'ora. Usa lo storico a 1 minuto del tuo broker e mostra il risultato su un quadrante di 24 ore. Il trading di breve periodo paga lo spread e la commissione a ogni trade. Lo stesso costo può essere piccolo in un'ora e grande in un'altra, perché in alcune sessioni il mercato si muove molto più che in alt
FREE
ATS Indicator
Andrea Michelon
ATS Indicator - Struttura di mercato (BOS / CHoCH) e Order Block Una lettura pulita della struttura di mercato per MetaTrader 5. L'indicatore segna ogni massimo e minimo di swing, etichetta ogni rottura come continuazione (BOS) o cambio di carattere (CHoCH) e disegna l'order block da cui e' partito il movimento, finche' il prezzo non lo mitiga. Cosa lo rende diverso Lo storico e' uguale al live. Uno swing viene confermato solo quando le candele ai suoi lati sono chiuse, con la stessa regola sull
FREE
ATS Daily Performance shows your profit and loss day by day for the last 30 days, as bars and numbers on a compact dashboard on your chart. Open it and see at a glance which days made money, which lost, and how your month is going. WHAT YOU SEE - One bar per day: green for a winning day, red for a losing one - Net result of the last 30 days, today's result and the profit or loss of the trades still open - Win rate, winning days, profit factor, best day and worst day - The last 7 days listed wit
FREE
ATS Lot Sizer
Andrea Michelon
THE LOT FROM YOUR STOP. FREE. Picking a lot size by feel is how a normal loss becomes a bad day. ATS Lot Sizer puts two lines on your chart, a stop and a target. Drag them, and the panel tells you the lot size that fits your risk and the money that lot really puts on the line. One click sends the trade with the stop and target attached. HOW IT WORKS Pick LONG or SHORT. A stop line and a target line appear on the chart. Drag them. Lots = your risk (percent of balance, percent of equity, or a fixe
FREE
Andy Universal Sniper Pro e' un indicatore di supporto alle decisioni per il trading manuale su MT4. Mette su un solo grafico tre cose: una freccia di ingresso filtrata , i target dai pivot del giorno prima e il lotto calcolato dal tuo rischio % . Non e' un sistema automatico e non opera al posto tuo. Come nasce una freccia La freccia compare solo se sulla stessa candela passano tutti questi controlli: Incrocio: EMA 5 incrocia EMA 34 (in su per BUY, in giu' per SELL). Forza: RSI 14 sopra 55 per
Gold Liquidity Matrix - Order Block con spinta, gap e rottura di struttura La maggior parte degli indicatori di order block disegna una zona su ogni piccolo swing e riempie il grafico. Gold Liquidity Matrix disegna una zona solo quando quattro condizioni sono d'accordo , e poi ti dice che tipo di zona e'. Le quattro condizioni Una candela d'origine contraria al movimento. Una candela di spinta con corpo maggiore di 0,8 x ATR. Un fair value gap a tre candele maggiore di 0,15 x ATR. Una rottura di
ATS Gold Command is an all-in-one decision-support indicator for XAUUSD. It was built with a simple philosophy: only include tools whose rules survived systematic backtesting and walk-forward validation on two years of Gold data. Everything works on closed bars only - no repainting, no signal that appears and then disappears. WHAT YOU GET - 5 MODULES IN ONE PANEL 1. SESSION EDGE WINDOWS (A/B/C badge) The indicator grades the trading day for Gold. Window A = London hours on M15. Window B = New Yo
ATS Fibonacci Zones Multi Timeframe finds the last significant swing by itself, draws the retracement levels that matter as zones, and tells you how many lots your stop allows. It is the full edition of the free ATS Fibonacci Golden Zones. No repaint. A swing high or low is only accepted after a fixed number of confirming bars on each side (default 8). Once a swing is confirmed it stays where it was: levels never move backwards to fit the chart. MULTI-TIMEFRAME SWING Take the swing from a higher
Every trading session leaves a high and a low, and those two prices become the liquidity targets of the following hours. ATS Killzones Liquidity Statistics draws them for you and, above all, tells you how often they are really taken, so you know whether you are looking at a target or at a wall. WHAT IT DRAWS - Session boxes (killzones) for Asia, London, New York AM and New York PM, with times set in GMT. The broker server offset is detected automatically, or you can set it by hand - The high and
ATS Volume Profile Statistics shows where the market actually traded, day by day, and measures how the key volume levels behaved on YOUR symbol and broker. It is the full edition of the free ATS Daily Volume Profile. WHAT YOU SEE - Daily volume profiles for the last 1 to 30 days, drawn behind the candles - Heat colours: cold blue where little was traded, gold and red where most of the volume was - 3D depth shadow on every row (can be switched off) - POC (most traded price) as a thick gold line,
SIX CHECKS. ONE GRADE. Most breakout signals on gold lose money. This one is graded. Every XAUUSD breakout on M15 is scored against six objective checks and gets a grade: A, B or C. You see the full trade plan (entry, stop, target, lot size), the six checks one by one, and how every past signal ended, written on your chart. WHY A GRADE We tested the same breakout on XAUUSD M15, May 2024 to September 2026, with the broker's real spread, a 2R target and one position at a time per grade, the same w
ATS Risk Desk
Andrea Michelon
SIZE FROM THE STOP. LOCK THE DAY. Most losing days do not start with a bad setup. They start with a lot size picked by feel, then a second trade to win the first one back. ATS Risk Desk sizes every trade from your stop, sends it in one click, manages it, and locks you out when the day's limit is gone. HOW IT WORKS Pick LONG or SHORT. A stop line and a target line appear on the chart. Drag them. Lots = your risk (percent of balance, percent of equity, or a fixed sum) divided by the stop distance,
Filtro:
Nessuna recensione
Rispondi alla recensione