Edge Radar Pro MT4
- Indicatori
-
Do Thi Phuong Anh
 I am PA, a 33-year-old Forex trader with eight years of market experience and three years of experience developing tools on MQL5.
I create calculation tools and indicators designed to help traders manage risk. These tools are for educational purposes only and do not constitute financial advice. - Versione: 1.0
- Attivazioni: 5
Edge Radar Pro MT4 — every pair, scored by edge.
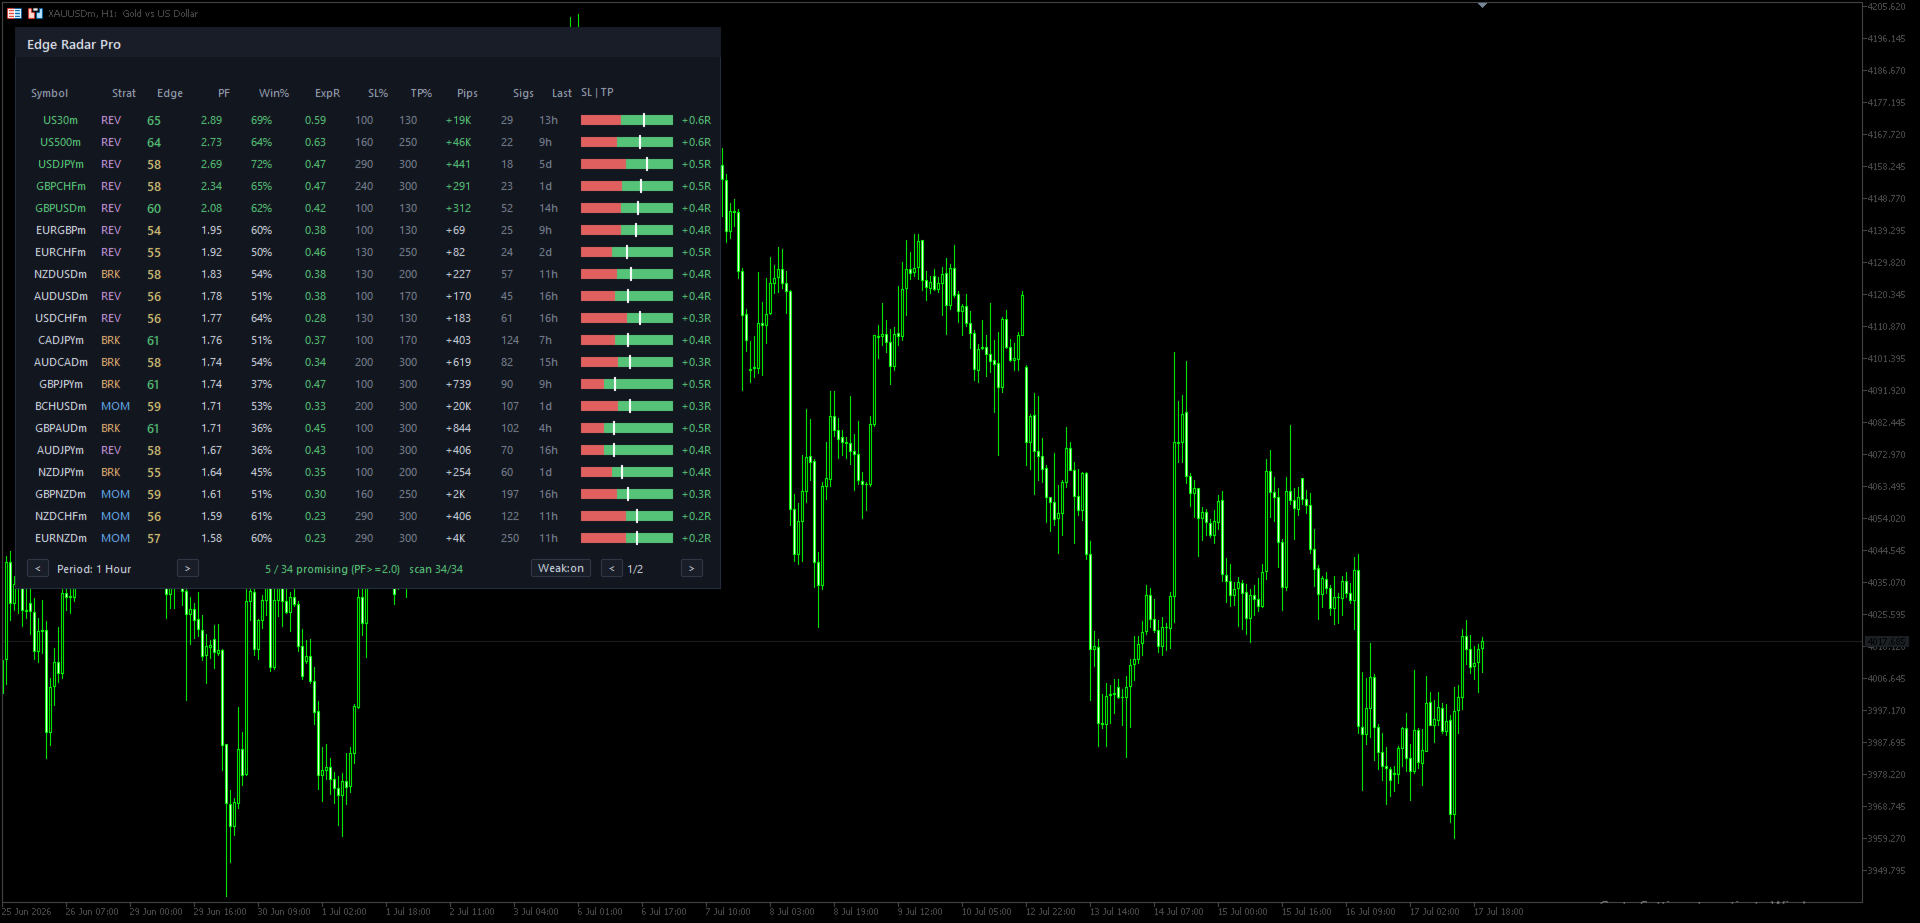
Edge Radar Pro scans your entire Market Watch and, for every symbol, auto-optimizes three price-action strategies — Momentum, Reversal and Breakout — across a grid of signal strengths and ATR-based SL/TP pairs. Each combination is backtested on closed bars only (non-repaint), and the winner is ranked by a single honest number: the Edge Score.
Most scanners rank by raw Profit Factor — which flatters tiny samples. The Edge Score is a confidence-adjusted expectancy built on the Wilson statistical bound: a setup with 120 trades is trusted more than one with 15, exactly the way a professional desk weighs an edge. What you see already survived scrutiny.
What you get:
- Stop chart-hopping — the strongest setups across Forex, Metals, Indices and Crypto surface on one dark, sortable panel.
- Read risk instantly — win rate, profit factor, expectancy in R, sample size, and a true risk : reward bar per symbol.
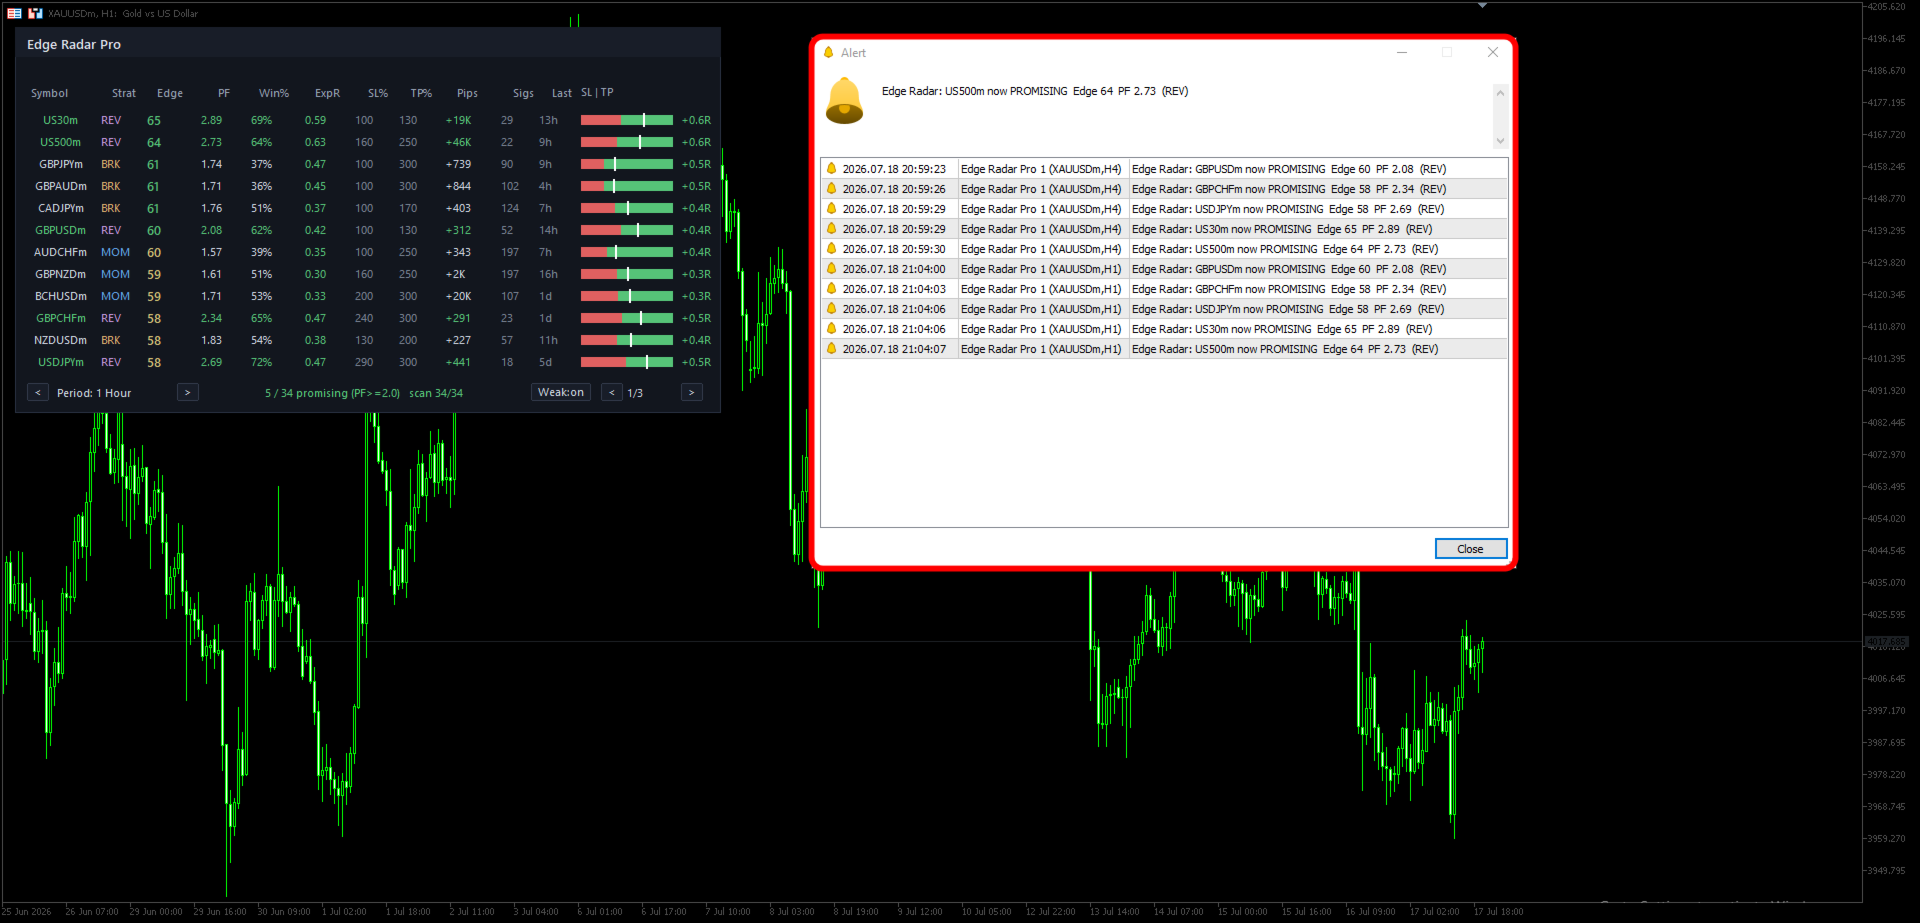
- Never miss a shift — multi-channel alerts (popup, push, email, sound) on new promising symbol and fresh signal.
- One click jumps your chart to any symbol · switchable timeframe · pagination for large watchlists.
Edge Radar Pro shows you where the edge is — you decide how to trade it.
Recommended: H1–H4. Works on any symbol in Market Watch. Research & discovery tool; not a signal guarantee.
=================
▸ Additional details
| Type | Multi-symbol scanner / dashboard (indicator, no trading) |
| Markets | Forex, Metals, Indices, Crypto — anything in Market Watch |
| Timeframes | M15 · M30 · H1 · H4 · D1 · W1 (switchable in-panel) |
| Strategies analyzed | Momentum · Reversal · Breakout, auto-optimized per symbol |
| Ranking metric | Edge Score — confidence-adjusted expectancy (Wilson bound) |
| Repaint | No — every statistic is computed on closed bars only |
| Alerts | Popup · Push · Email · Sound — on new promising & fresh signal |
| Recommended | H1–H4 · 20+ symbols in Market Watch · Edge ≥ 60 & Sigs ≥ 30 |
=================
▸ How to read the panel
| Column | Meaning |
|---|---|
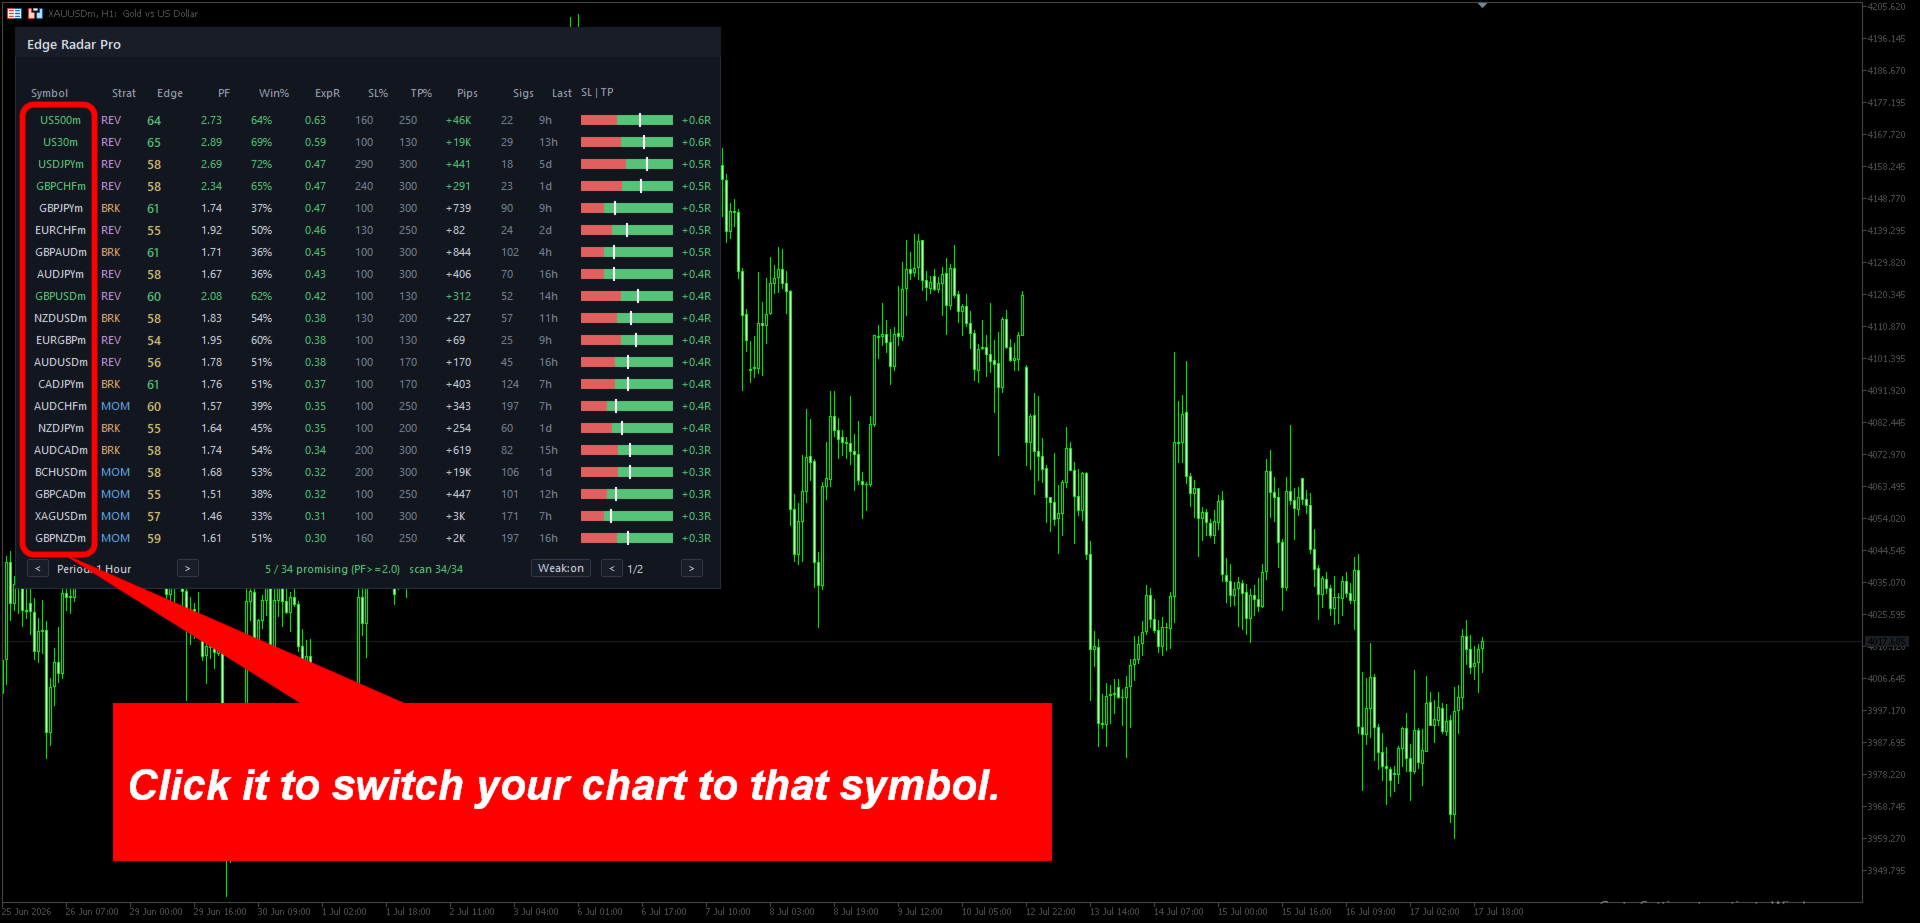
| Symbol | Instrument. Click it to switch your chart to that symbol. |
| Strat | Winning strategy: MOM momentum · REV reversal · BRK breakout. |
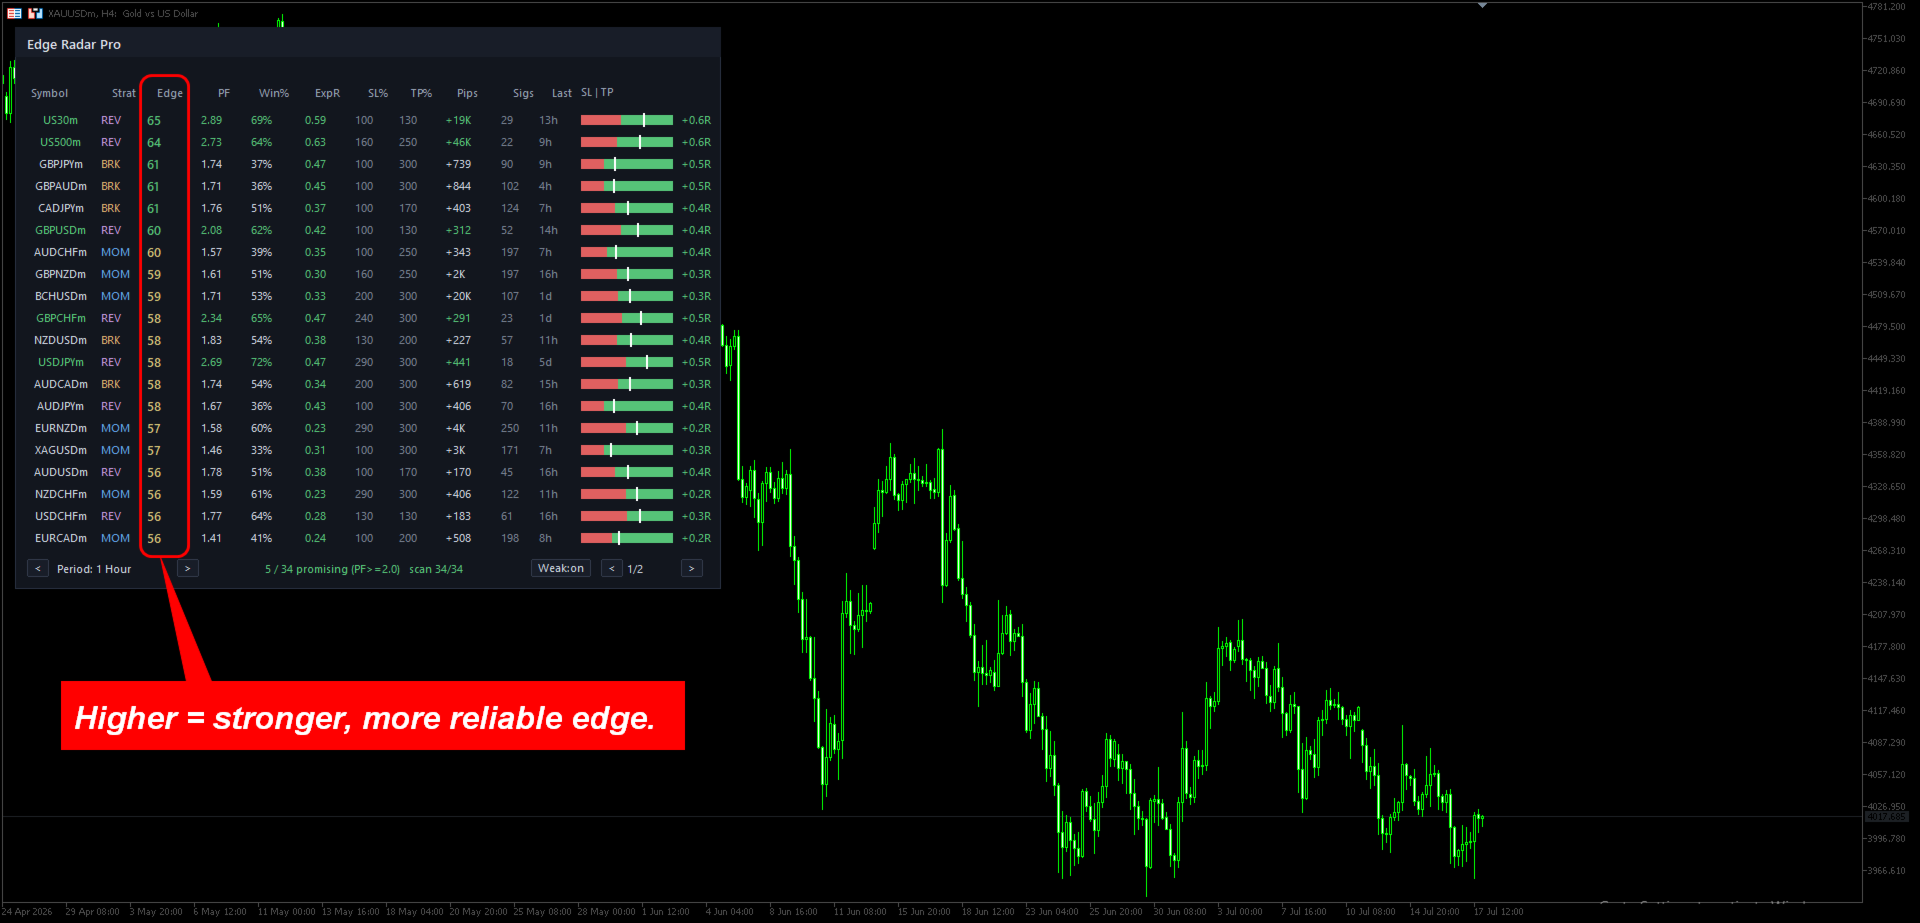
| Edge | The headline score (0–100). Confidence-adjusted expectancy — trusts large samples, discounts small ones. Higher = stronger, more reliable edge. |
| PF | Profit Factor of the optimized setup (gross win ÷ gross loss). |
| Win% | Win rate of the optimized configuration. |
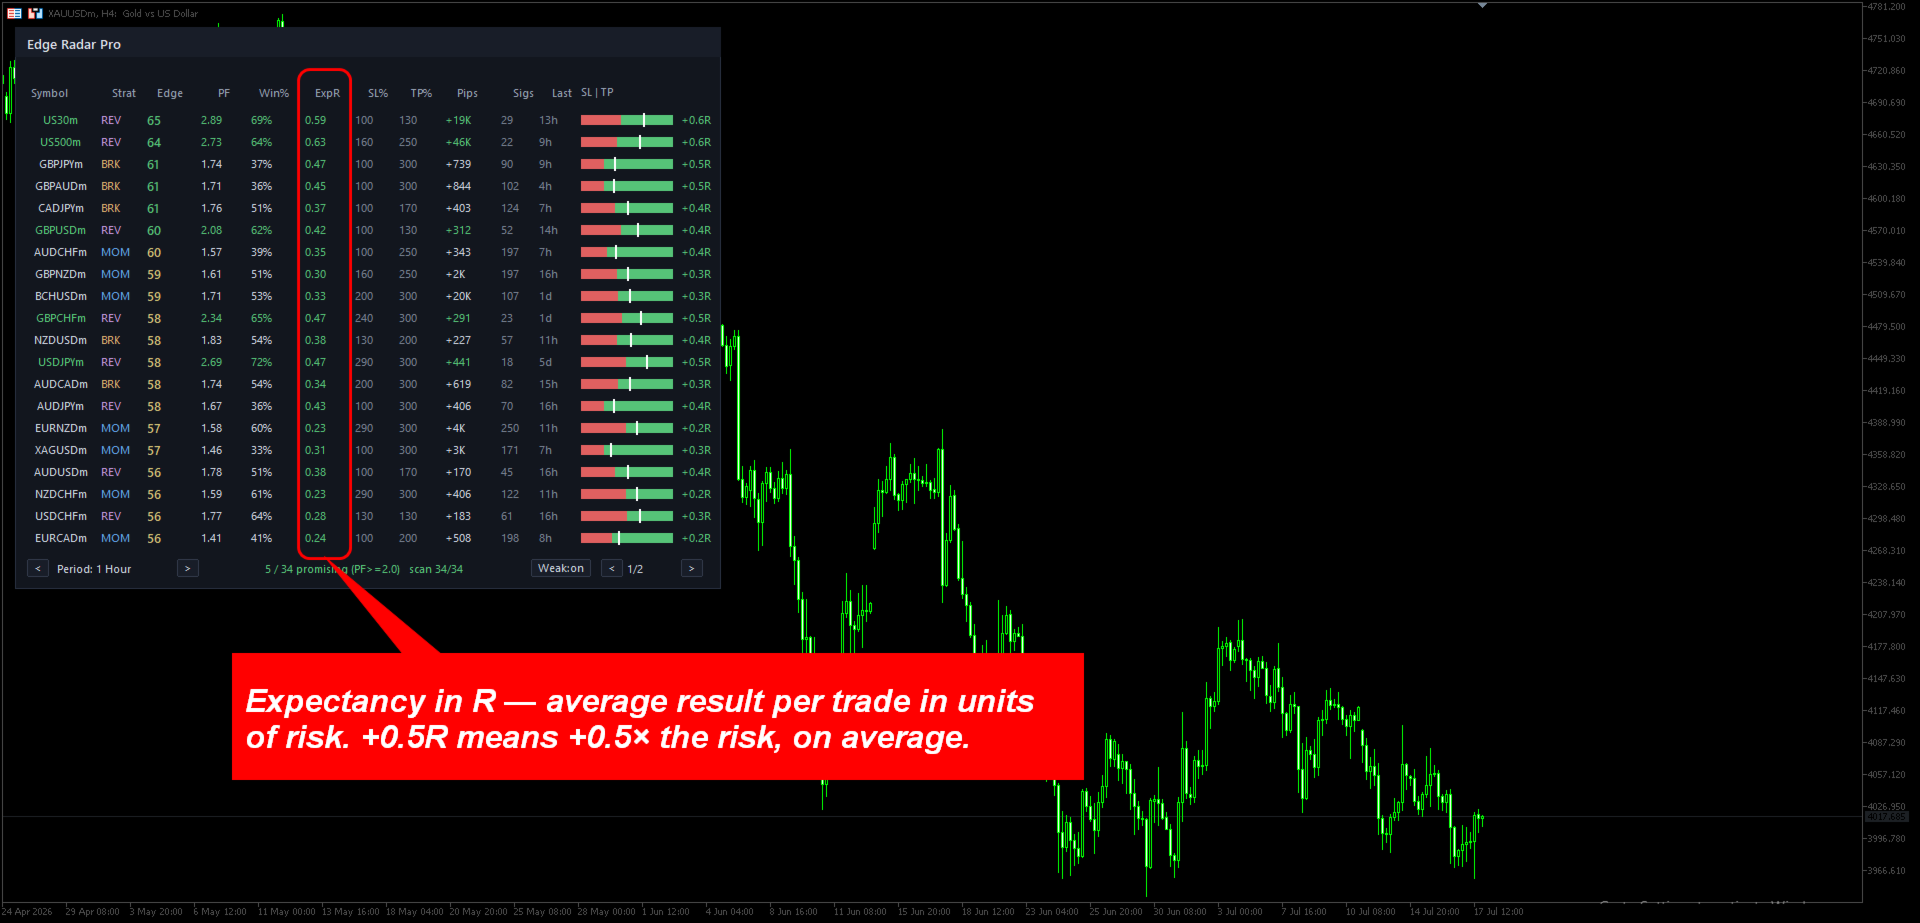
| ExpR | Expectancy in R — average result per trade in units of risk. +0.5R means +0.5× the risk, on average. |
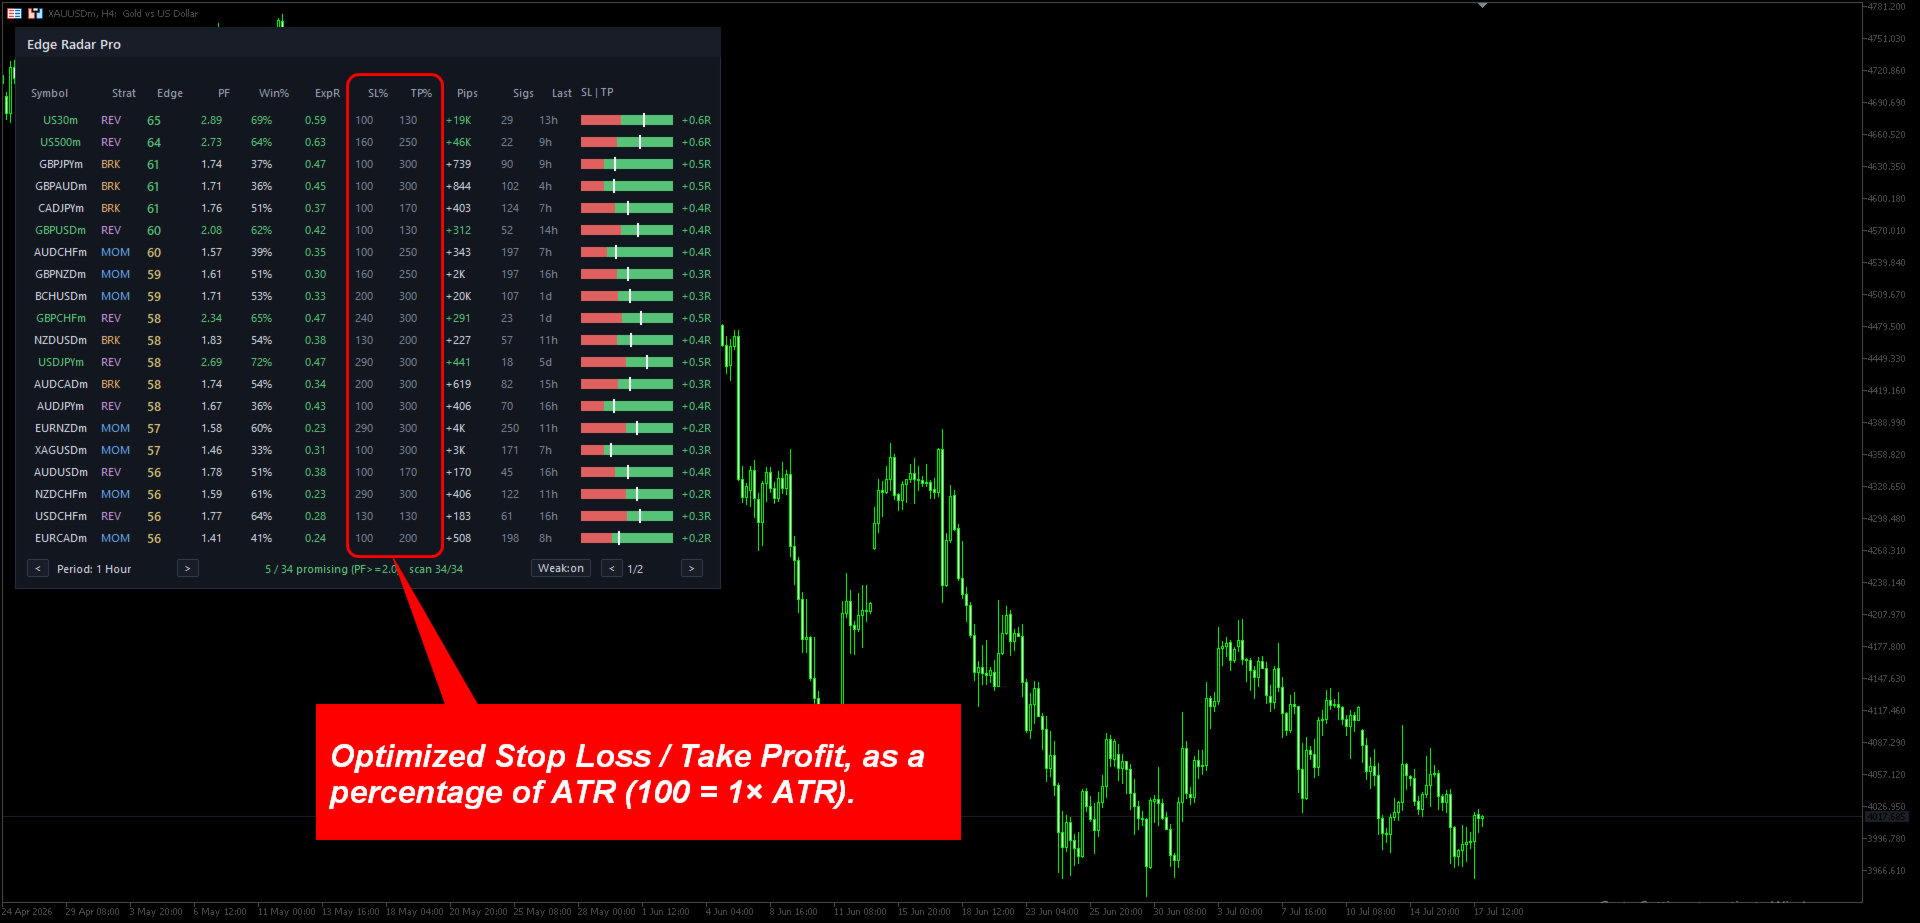
| SL% / TP% | Optimized Stop Loss / Take Profit, as a percentage of ATR (100 = 1× ATR). |
| Pips | Net pips across the backtest sample. |
| Sigs | Sample size — how many trades the stats are based on. More = more reliable. |
| Last | Time since the most recent signal (e.g. 4h, 1d). |
| SL | TP bar | Visual risk : reward. Red = risk, green = reward; the white marker shows expectancy — a marker inside the green zone means a positive edge. The +0.6R value is the expectancy per trade. |
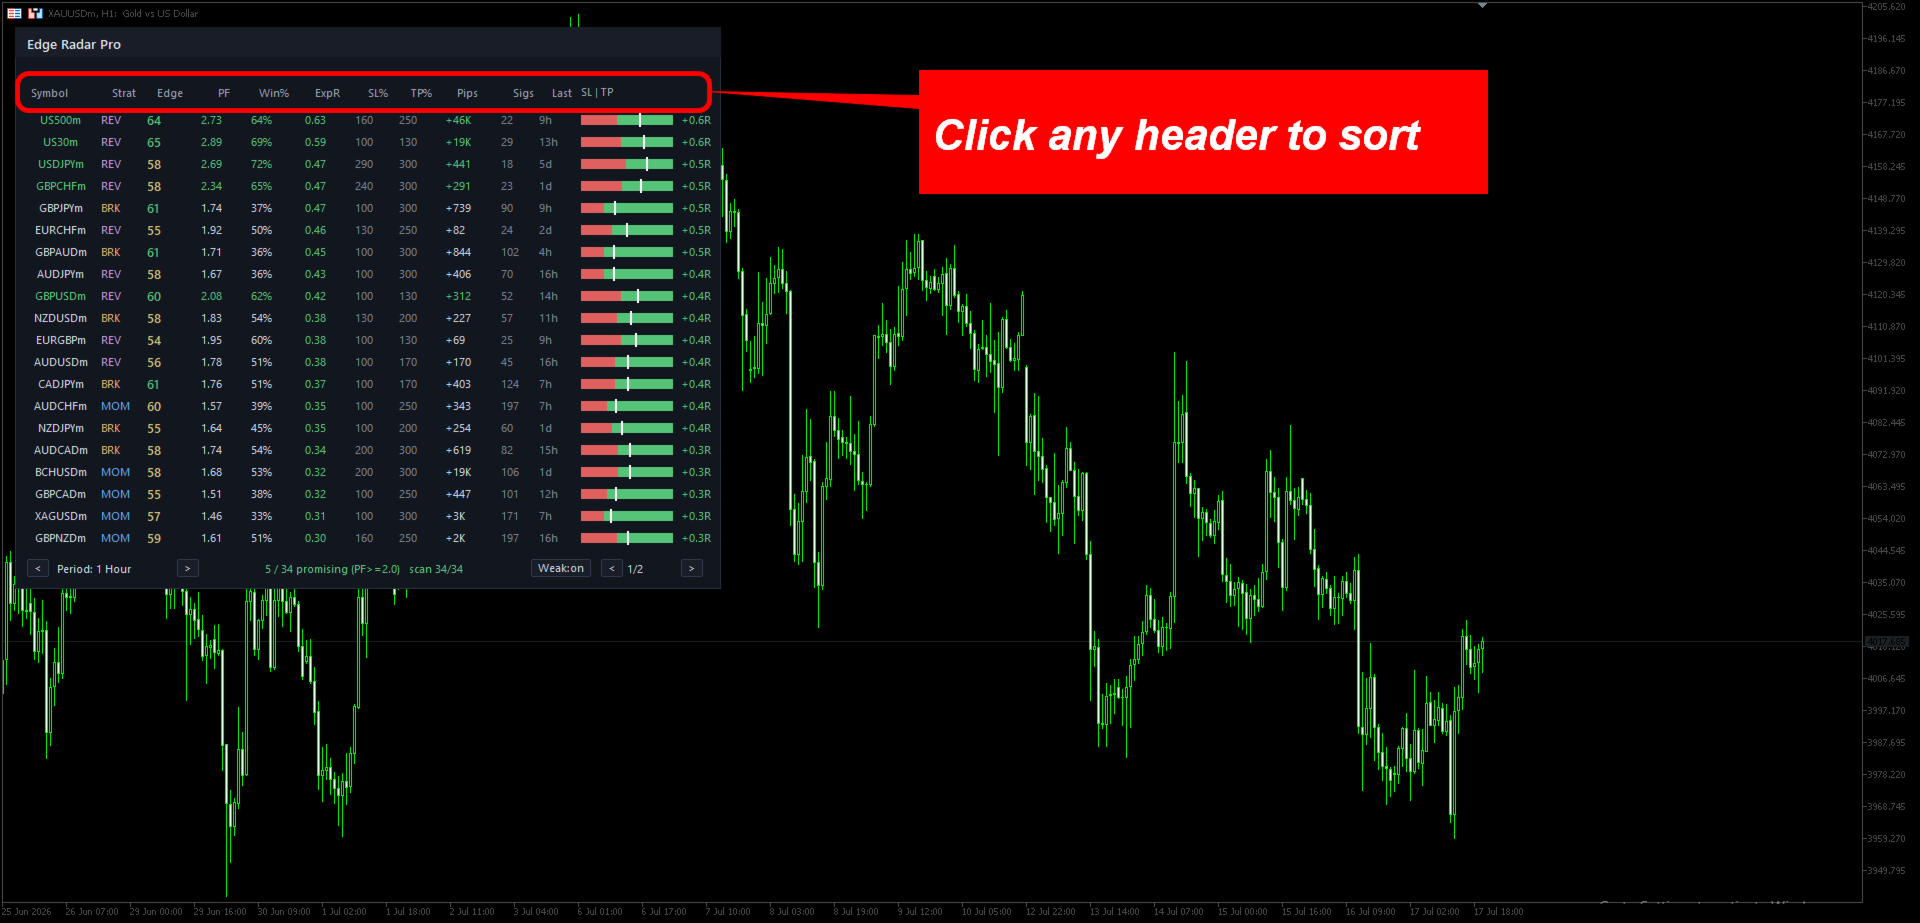
Green rows are promising (PF ≥ your threshold). Click any header to sort. Use the filter button to hide weak symbols.