Rejection Block Indicator and Void for MT4
- Indicatori
- Mehnoosh Karimi
- Versione: 3.1
- Attivazioni: 10
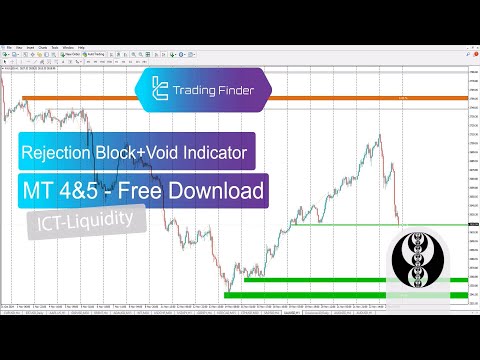
Rejection Block Indicator & Void MetaTrader 4
The Rejection Block Indicator is a powerful and efficient tool designed to identify potential market reversal zones on the MetaTrader 4 platform. It automatically detects price areas where strong rejection occurs, helping traders anticipate possible turning points in the market.
This indicator is based on candlestick wick analysis. Long upper wicks near price highs or long lower wicks near price lows often signal rejection and a potential reversal. Once such conditions are detected, the indicator automatically plots Rejection Blocks on the chart.
- Bullish Rejection Blocks are displayed in green
- Bearish Rejection Blocks are shown in red
Indicator Specifications
Category: ICT – Liquidity – Smart Money
Platform: MetaTrader 4
Skill Level: Intermediate
Indicator Type: Continuation & Reversal
Timeframe: Multi-Timeframe
Trading Style: Intraday Trading
Markets: Cryptocurrency, Forex, Stocks, Commodities
Indicator Overview
The Rejection Block Indicator highlights price zones with a high probability of reversal. In many cases, price revisits these zones before continuing its broader market move.
Traders following ICT concepts use this indicator to identify high-probability Rejection Block areas. The void section of these zones is displayed in gray, and once the void is fully filled, the zone is considered invalid, signaling that the level is no longer effective.
Rejection Block Indicator in an Uptrend
On the EUR/USD 4-hour chart, the indicator demonstrates its effectiveness during an uptrend. When price experiences a temporary pullback, it reacts to a bullish Rejection Block, providing traders with a well-defined buy entry opportunity aligned with the prevailing trend.
Rejection Block Indicator in a Downtrend
The USD/CHF 4-hour chart showcases the indicator’s performance in a bearish market. As price retraces upward, it encounters a bearish Rejection Block, creating a potential sell setup consistent with the downward trend.
Indicator Settings
- Display Configuration: Fully customizable visual layout
- Chart & Object Colors: Adjustable background and object colors
- Default Parameters: Optimized standard settings
- Candle Analysis: Reviews historical candlesticks
- Object Prefix: Custom identifiers for chart objects
- Vertical Lines: Enable or disable session separators
- Primary Trend Levels: Show first-level trend structure
- BOS & CHoCH Level 2: Display second-level structure breaks
- BOS & CHoCH Labels: Toggle structure labels
- Rejection Block Display: Enable or disable zones
- Custom Zone Colors: Define Rejection Block colors
- Invalidation Rules: Mark zones invalid when price closes beyond
- Overlap Handling: Automatically invalidate overlapping zones
Conclusion
The Rejection Block Indicator is a reliable and practical tool for identifying key market reversal zones. By highlighting Rejection Blocks that function as strong support and resistance levels, it enables traders to make more informed and strategic trading decisions.
This indicator integrates seamlessly with ICT-based trading strategies, helping traders pinpoint precise entry and exit points, minimize unnecessary market exposure, and enhance overall trade accuracy.