Magic lines mt5
- Indicatori
- Versione: 5.13
- Aggiornato: 10 giugno 2026
- Attivazioni: 5
MagicLines MT5 — Multi-Currency Cycle and Trend Dashboard
MagicLines is a multi-currency indicator and dashboard for MetaTrader 5. It combines Heikin-Ashi cycle detection, two dynamic trend lines, and a multi-pair scanner into one chart tool. It generates signal suggestions with entry, stop loss, and take profit levels across multiple pairs from a single chart.
How It Works
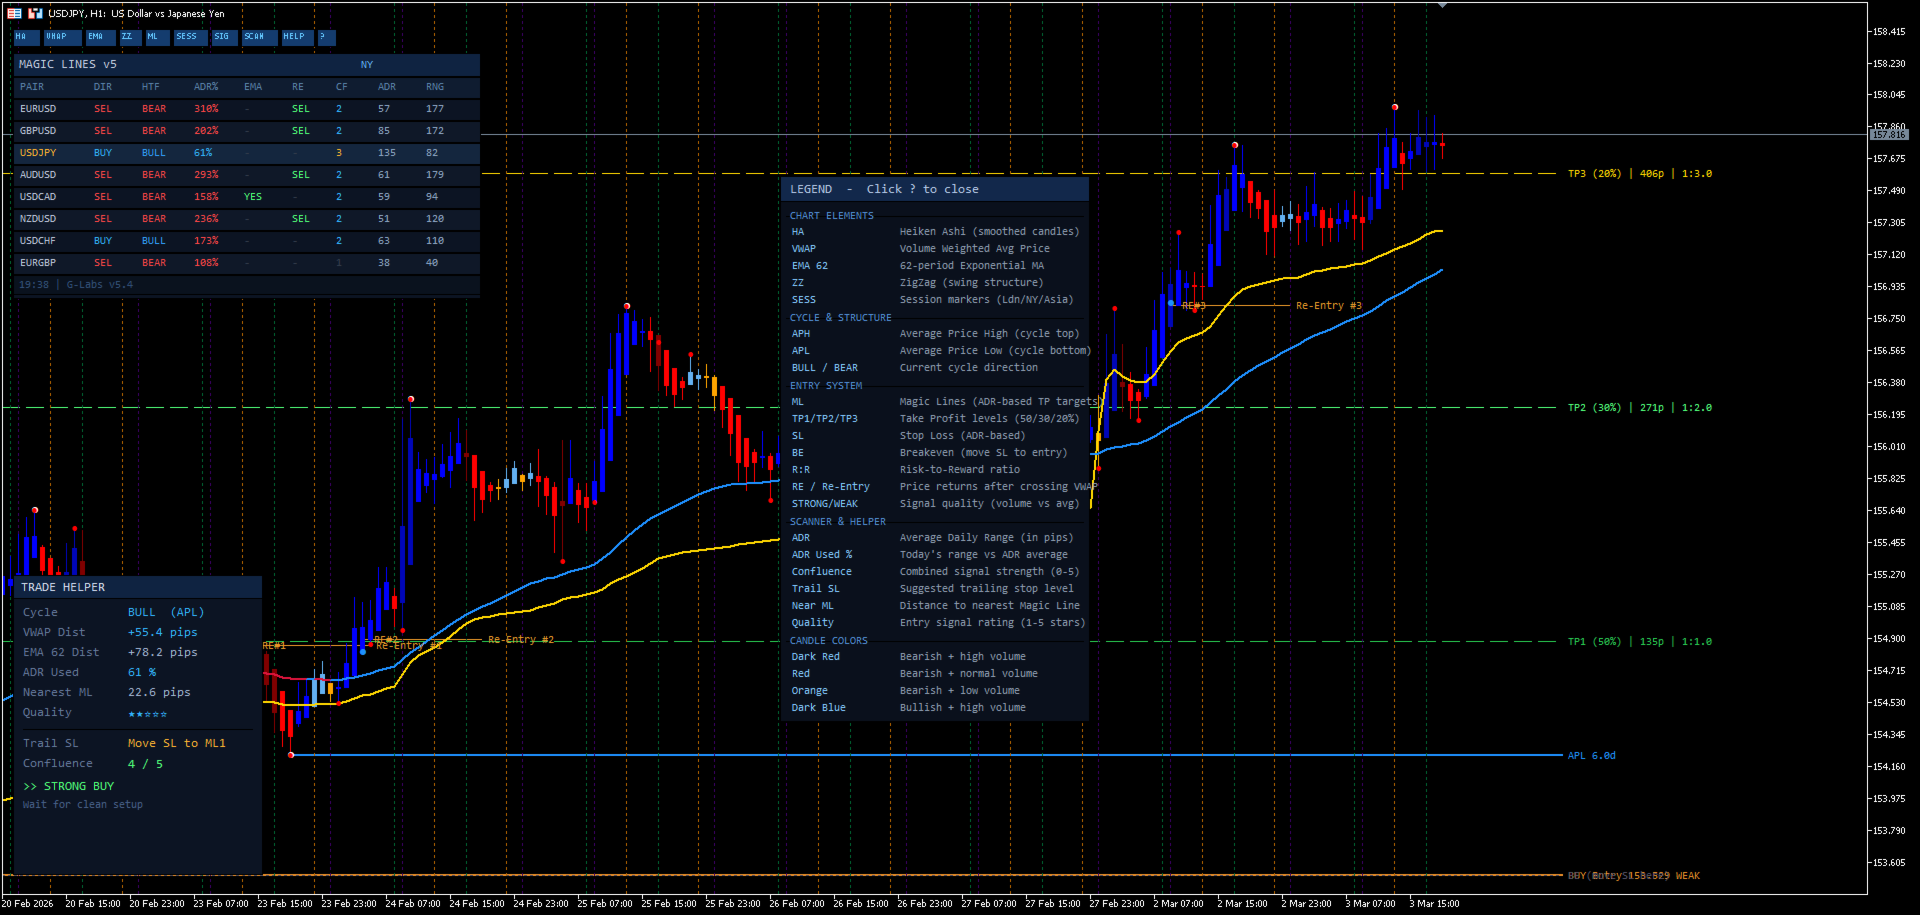
MagicLines uses three analysis layers together:
- Heikin-Ashi Cycle Logic identifies whether each pair is in an up or down cycle and marks the structural anchor point (swing high or low) where the cycle began.
- Trend-Filtered MagicLine is a dynamic trend line that provides directional bias. Signals only appear in the direction of this line.
- VWAP MagicLine is a separate dynamic line used as a reference area for pullback entries, re-entries, and continuation trades.
Signals require all three layers to align with higher-timeframe direction before triggering. This filtering approach aims to keep signals in the direction of the broader trend.
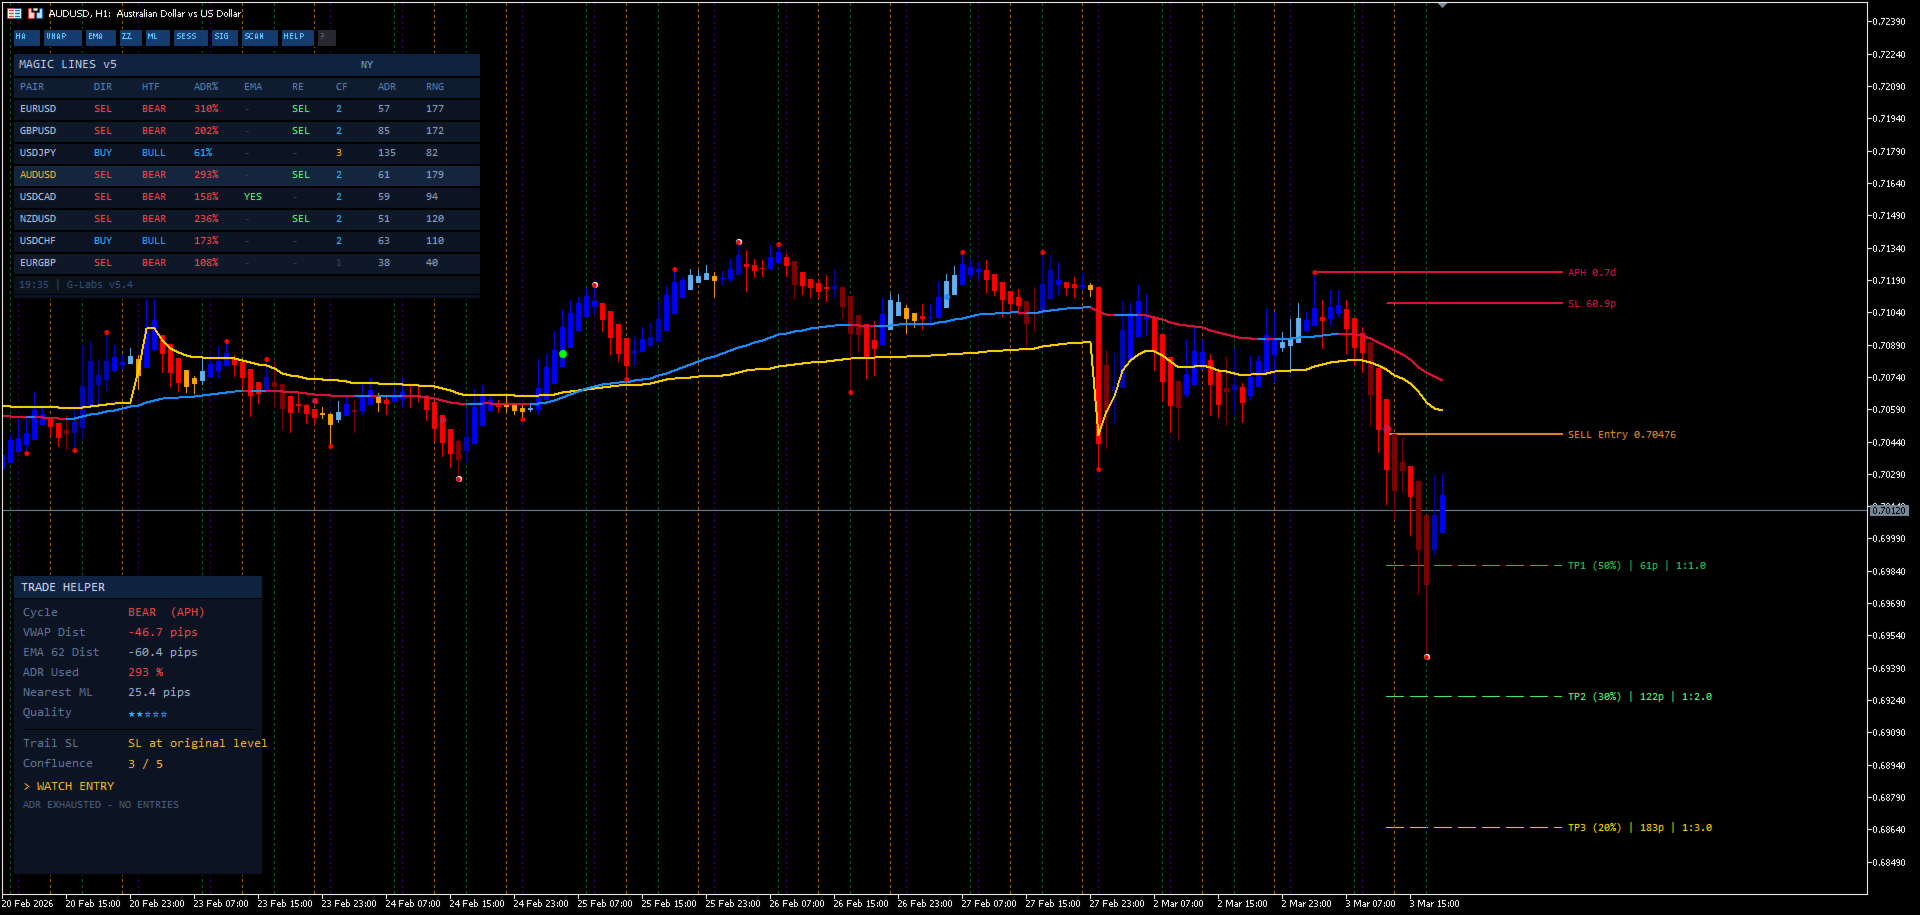
Signal Structure
Each signal includes:
- Entry level based on cycle and MagicLine alignment
- Stop loss placed at the structural anchor point
- Three adjustable take profit targets (ML1, ML2, ML3)
- Re-entry detection when price offers a continuation opportunity within an existing cycle
Cycle Logic and Anchor Points
MagicLines assigns structural anchor points to each cycle:
- Up cycle: Anchor Point Low is the swing low before the bullish signal
- Down cycle: Anchor Point High is the swing high before the bearish signal
The indicator tracks days elapsed since the anchor formed, which may help assess whether a cycle is early or extended.
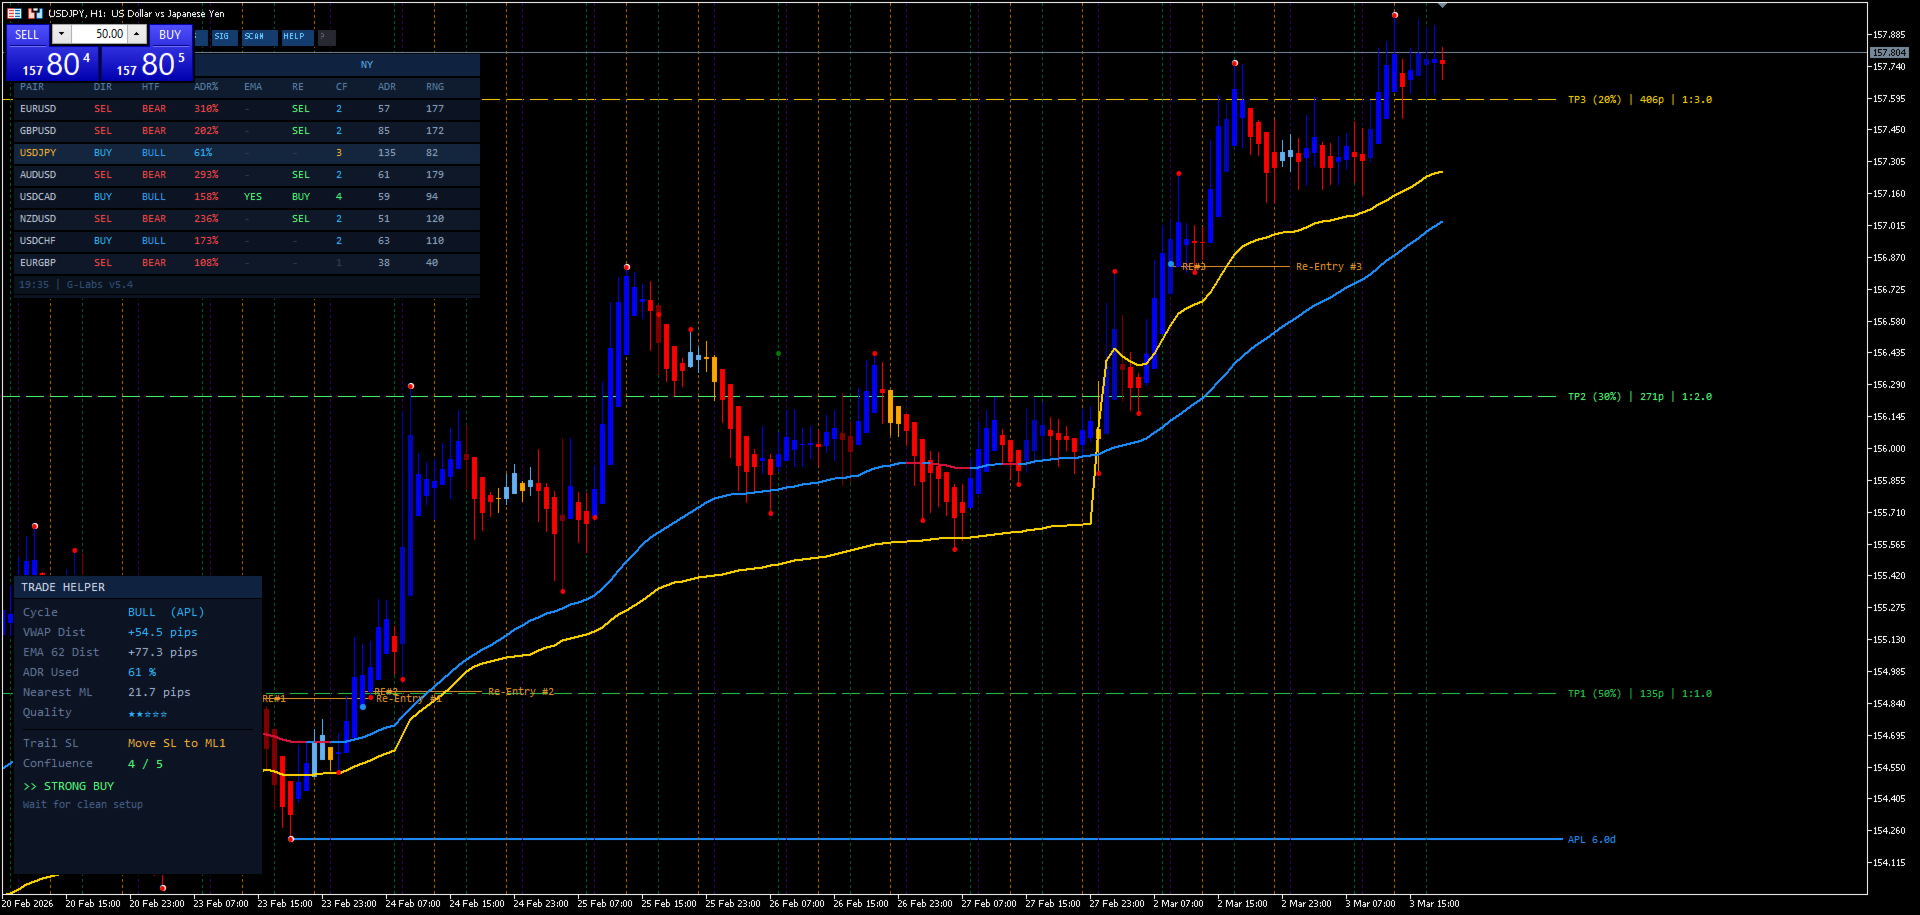
Dashboard Columns
The dashboard provides multi-pair scanning with the following columns:
- SYM: Symbol name with one-click chart switching
- CYCLE: Current cycle direction (up or down)
- ANCHOR (Current TF, H4, Daily): Anchor Point High or Low with days since formation on three timeframes
- ADR DIST: Distance from anchor point measured against Average Daily Range
- ML TOUCH: Whether price has touched a MagicLine
- RE-ENTRY: Whether price is offering a re-entry opportunity
- ADR/PIPS: Average Daily Range and current movement in pips
- TODAY RANGE: Current day total range in pips
On-Chart Features
- Heikin-Ashi volume candles showing momentum direction and participation strength
- Two MagicLines: one for trend direction, one as a dynamic reference for entries
- Anchor Point Highs and Lows plotted on chart
- Entry, stop loss, and re-entry levels displayed
- ML1, ML2, ML3 take profit targets displayed
- Semaphore markers at swing highs and lows
- Risk parameters adjustable in settings
Alerts
- MagicLine touch alerts when price reaches a MagicLine level
- Popup alerts and push notifications to mobile
Setup
Attach MagicLines to any valid chart. The dashboard loads automatically with your configured symbols. Symbol names must exactly match your broker Market Watch naming, including any suffixes. Click any dashboard row to switch your chart to that pair. Adjust ML1, ML2, ML3 targets and risk parameters in the indicator settings.
Requirements
MetaTrader 5. Works on any broker and any symbol. MagicLines is an analysis and signal tool. It does not place trades automatically.
See comments section for documentation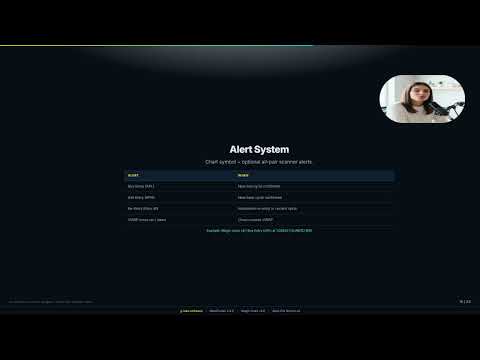
L'utente non ha lasciato alcun commento sulla valutazione.