Range Oscillator
- Indicatori
-
Minh Truong Pham
 Hello, my name is Pham and I am a programmer and trader! At here, I create amazing forex indicators and expert advisors for Metatrader.
I will try:
+ Provide best tools base on my 5 years experience as a trader and 10 years as a programmer. - Versione: 1.1
- Aggiornato: 5 gennaio 2026
- Attivazioni: 5
█ Overview
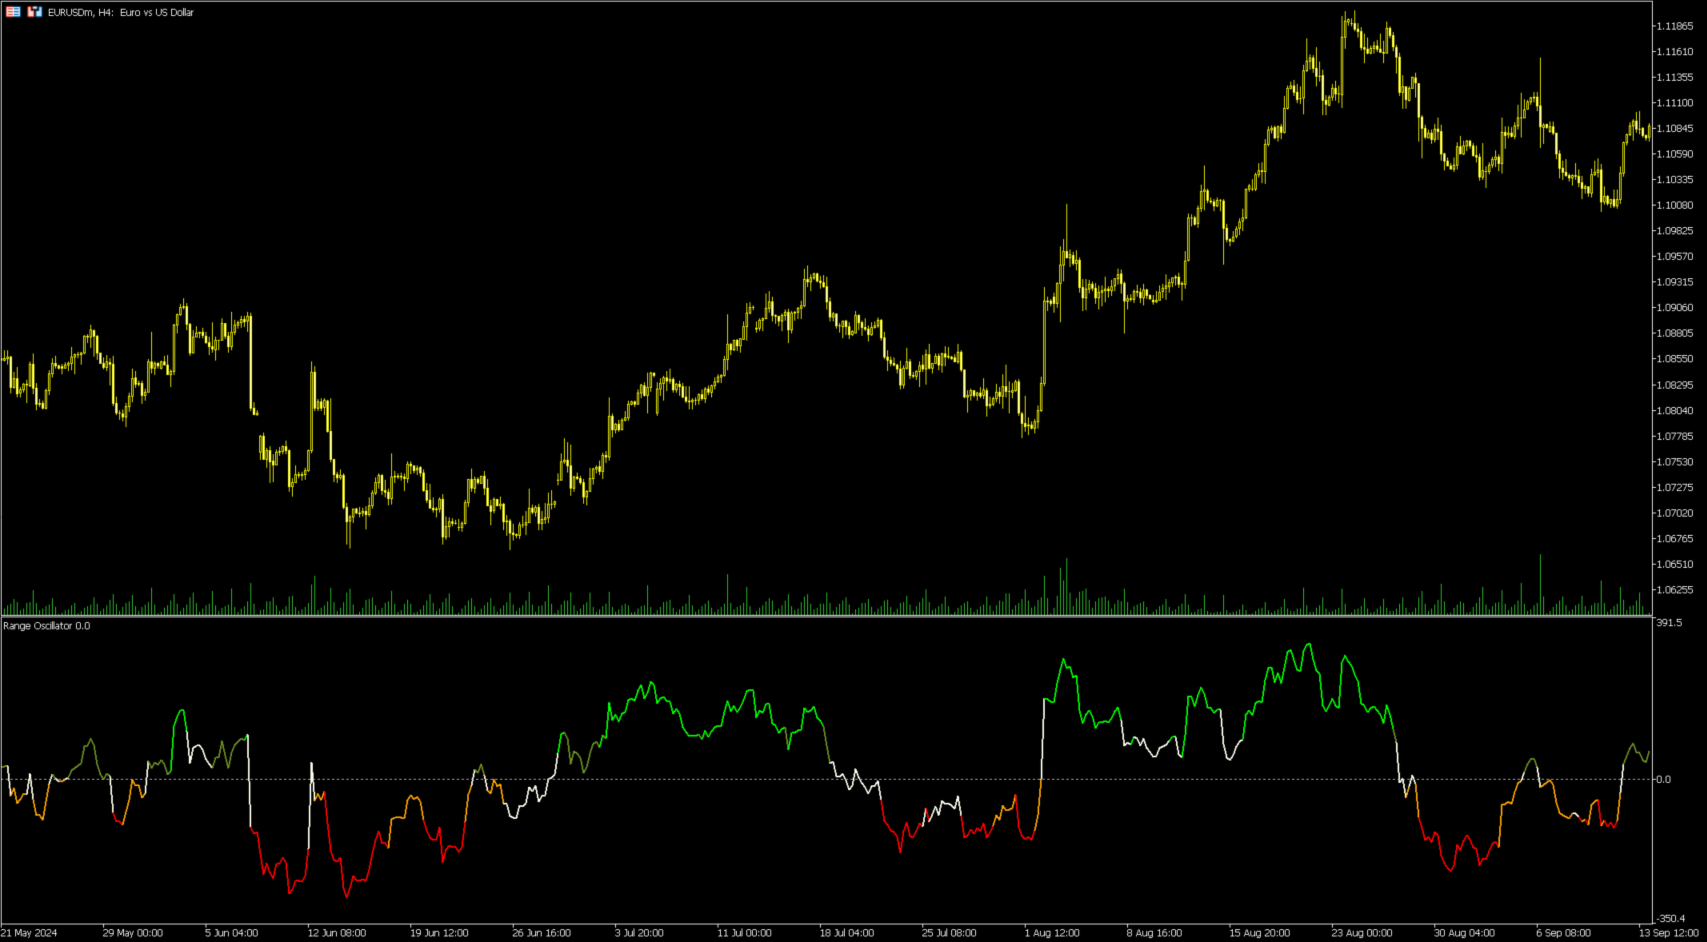
Range Oscillator is a dynamic market oscillator designed to visualize how far the price is trading relative to its equilibrium range. Instead of relying on traditional overbought/oversold thresholds, it uses adaptive range detection and heatmap to reveal where price is trading within a volatility-adjusted band.
The oscillator maps market movement as a heat zone, highlighting when the price approaches the upper or lower range boundaries and signaling potential breakout or mean-reversion conditions. (figure1)
Highlights- Adaptive range detection based on ATR and weighted price movement.
- Coloring-driven that visualizes volatility pressure and directional bias.
- Clear transition zones for detecting trend shifts and equilibrium points.
⚪ Range Detection
The indicator identifies a dynamic price range using two main parameters:
- Minimum Range Length: The number of bars required to confirm that a valid range exists.
- Range Width Multiplier: Expands or contracts the detected range proportionally to the ATR (Average True Range).
This approach ensures that the oscillator automatically adapts to both trending and ranging markets without manual recalibration.
⚪ Weighted Mean Calculation
Instead of a simple moving average, the script calculates a weighted equilibrium mean based on the size of consecutive candle movements:
- Larger price changes are given greater weight, emphasizing recent volatility.
⚪ Oscillator Formula
Once the range and equilibrium mean are defined, the oscillator computes:
█ Heatmap LogicOsc = 100 * (Close - Mean) / RangeATR
This normalizes price distance relative to the dynamic range size — producing consistent readings across volatile and quiet periods.
The Range Oscillator includes a built-in heatmap engine that color-codes each oscillator value based on recent price interaction intensity:
- Strong Bullish Zones: Bright green — price faces little resistance upward.
- Weak Bullish Zones: Muted green — uptrend continuation but with minor hesitation.
- Transition Zones: Blue — areas of uncertainty or trend shift.
- Weak Bearish Zones: Maroon — downtrend pressure but soft momentum.
- Strong Bearish Zones: Bright red — strong downside continuation with low resistance.
█ How to Use
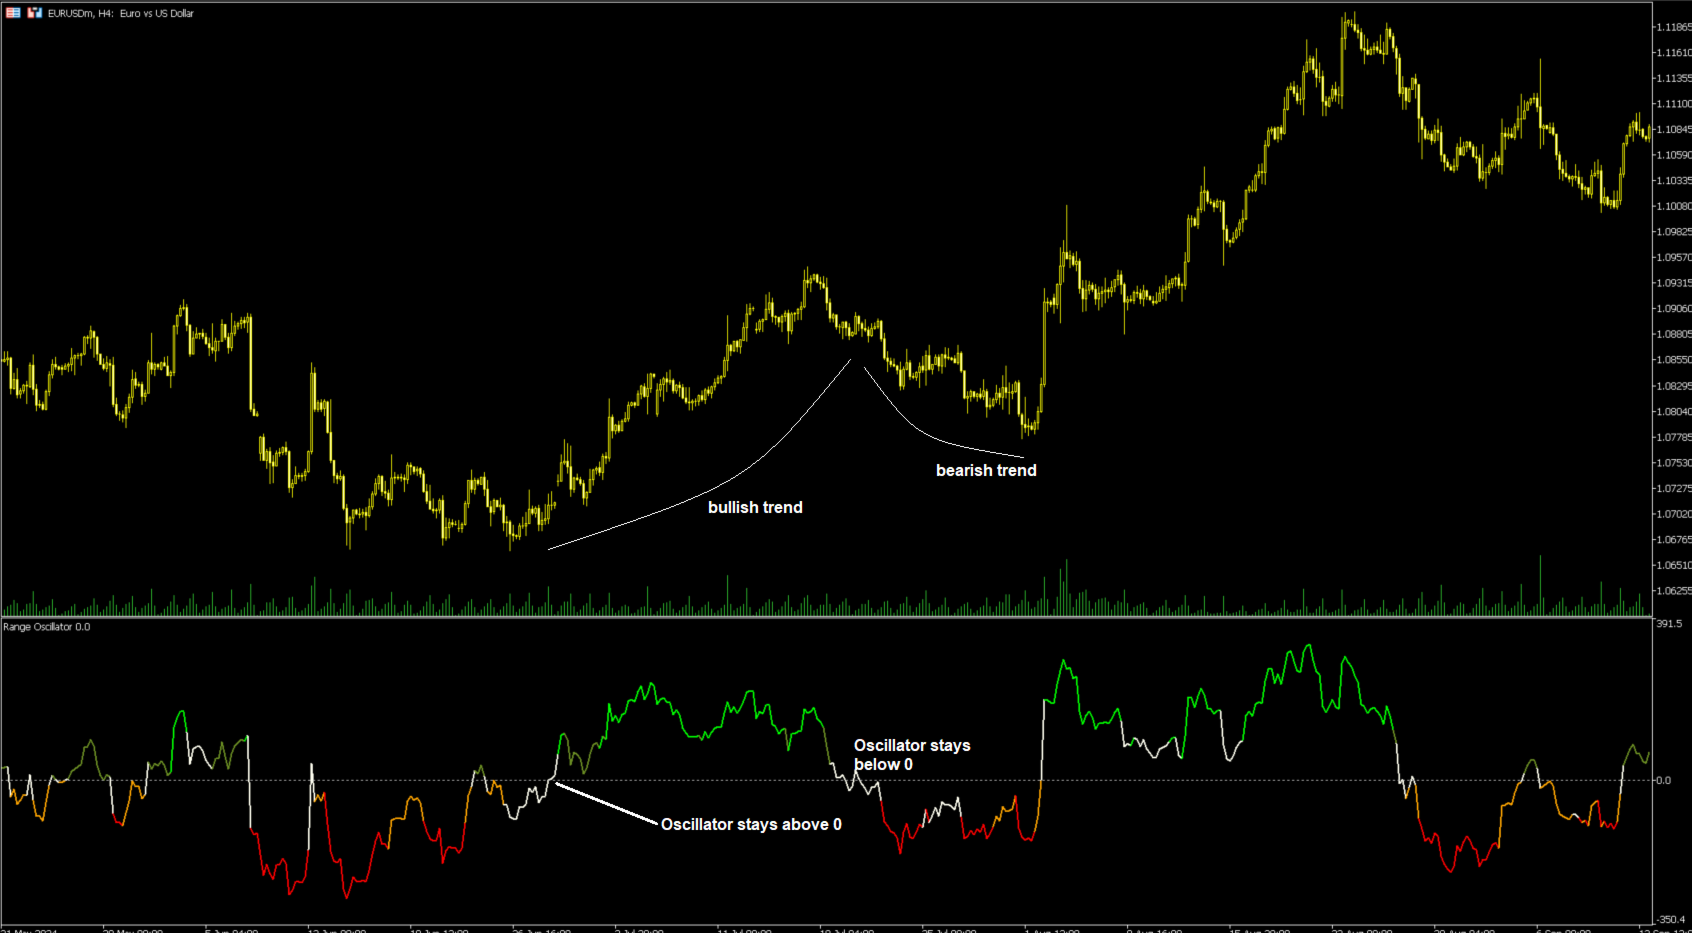
⚪ Trend & Momentum Confirmation
When the oscillator stays above +0 with green coloring, it suggests sustained bullish pressure. (figure2)
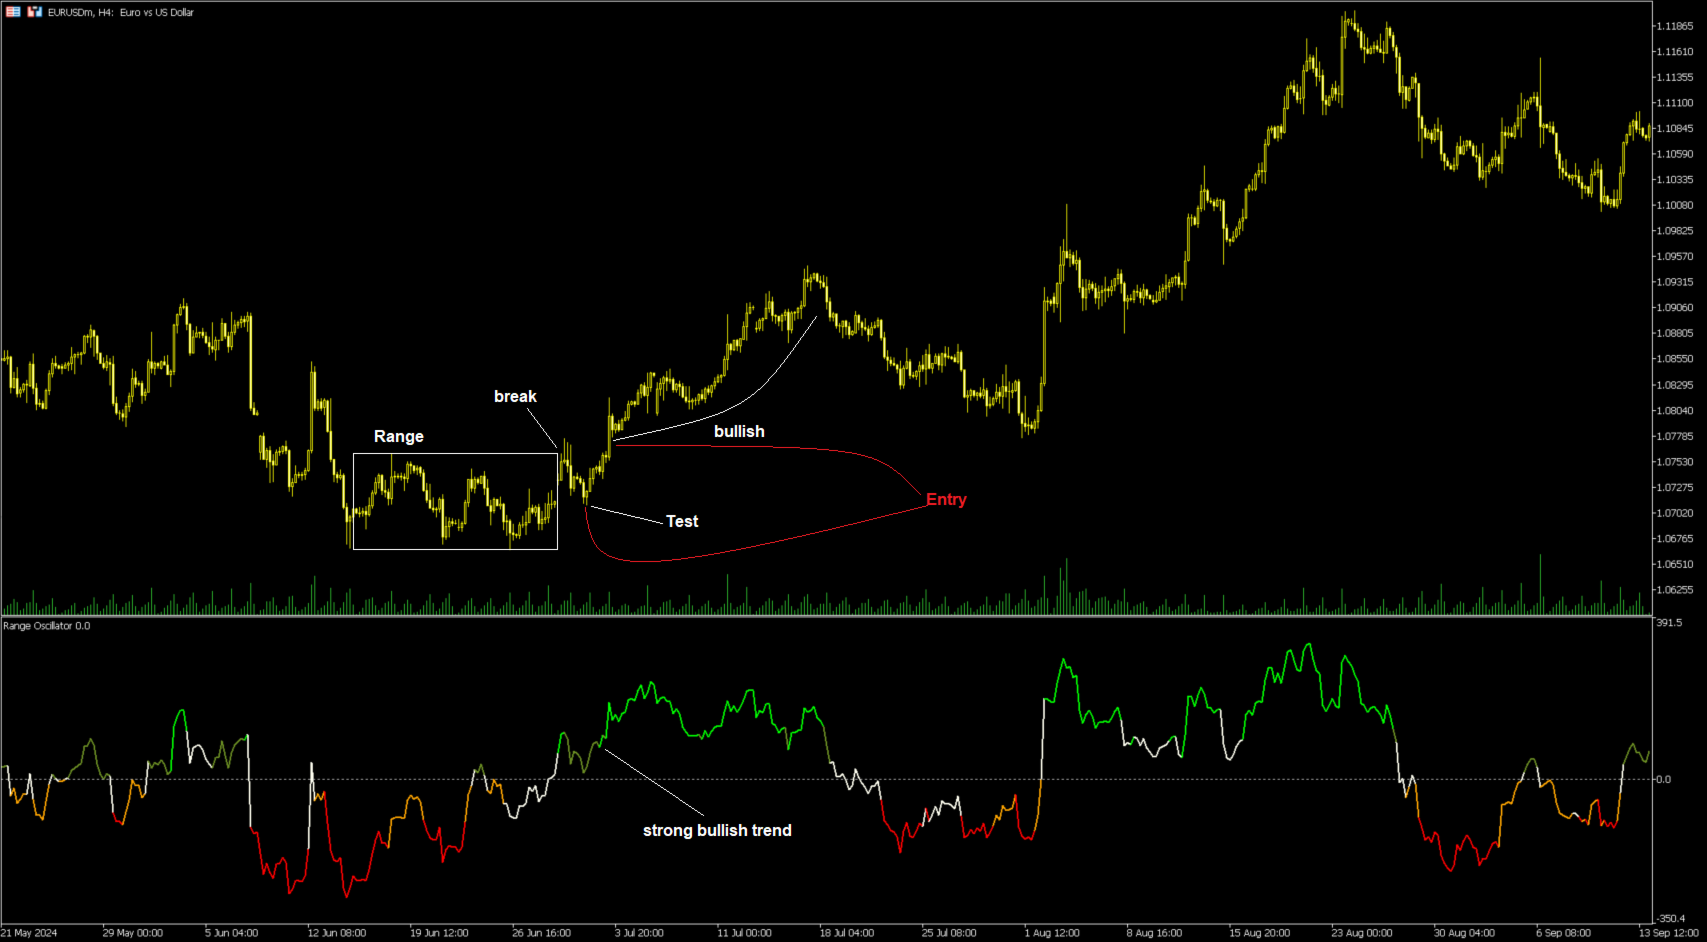
⚪ Range Breakouts
When the oscillator line breaks above +100 or below –100, the price is exceeding its normal volatility range, often signaling breakout potential or exhaustion extremes. (figure3 and 4)
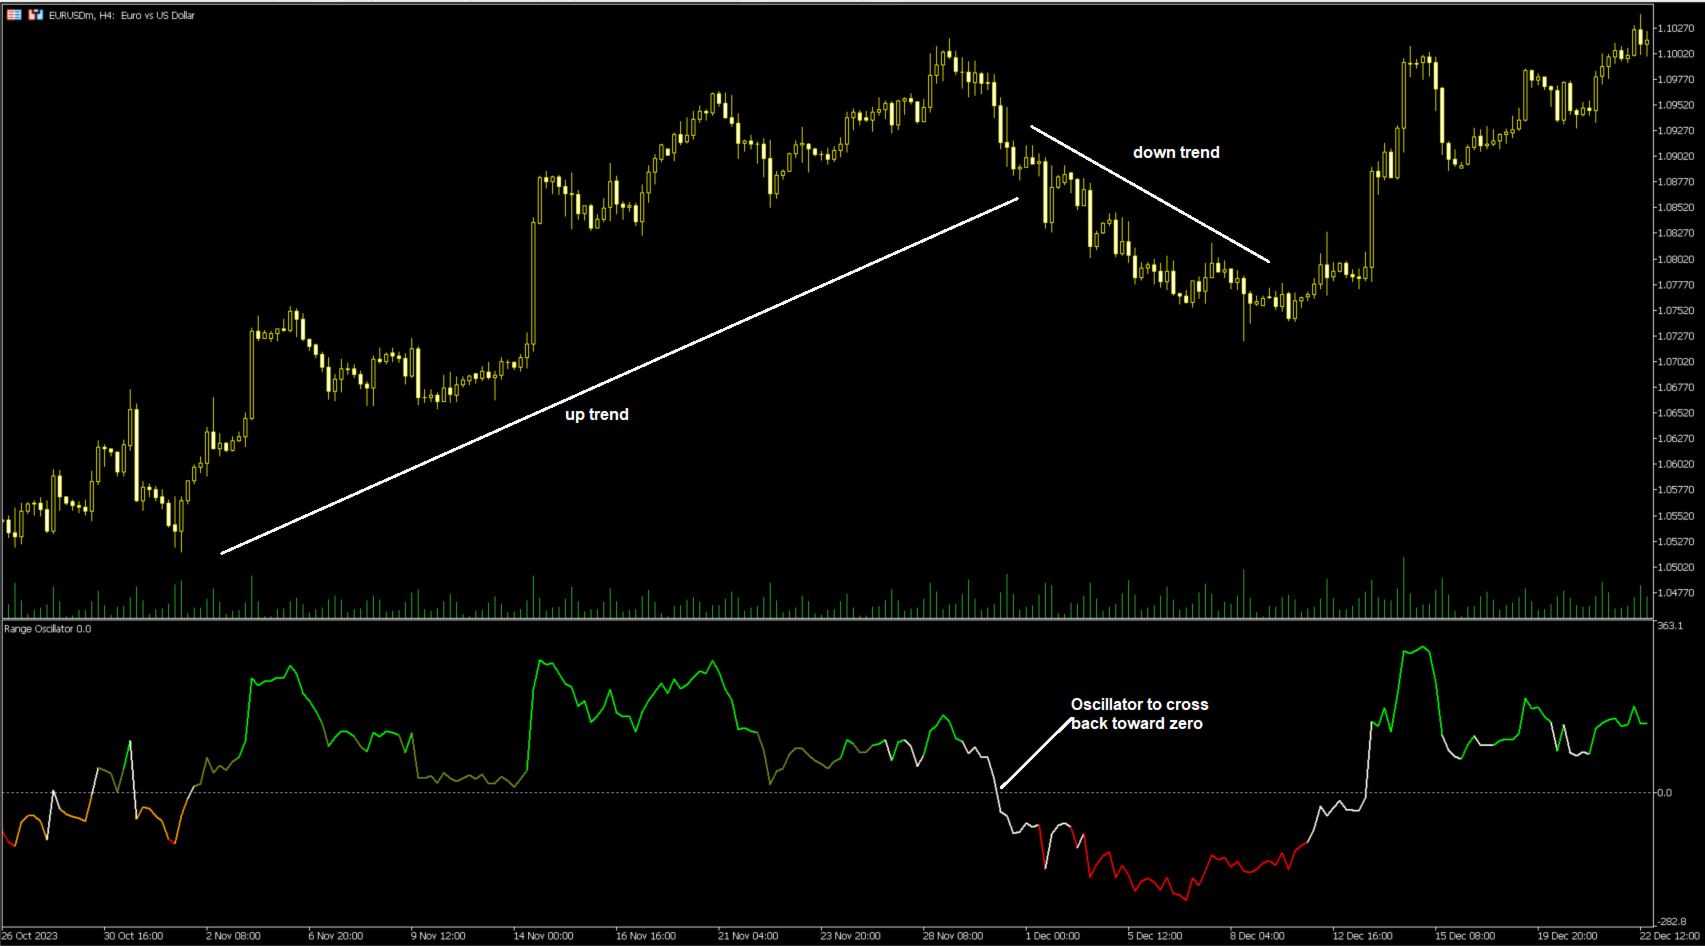
⚪ Mean Reversion Trades
Look for the oscillator to cross back toward zero after reaching an extreme. These transitions (often marked by blue tones) can identify early reversals or range resets. (figure 5)
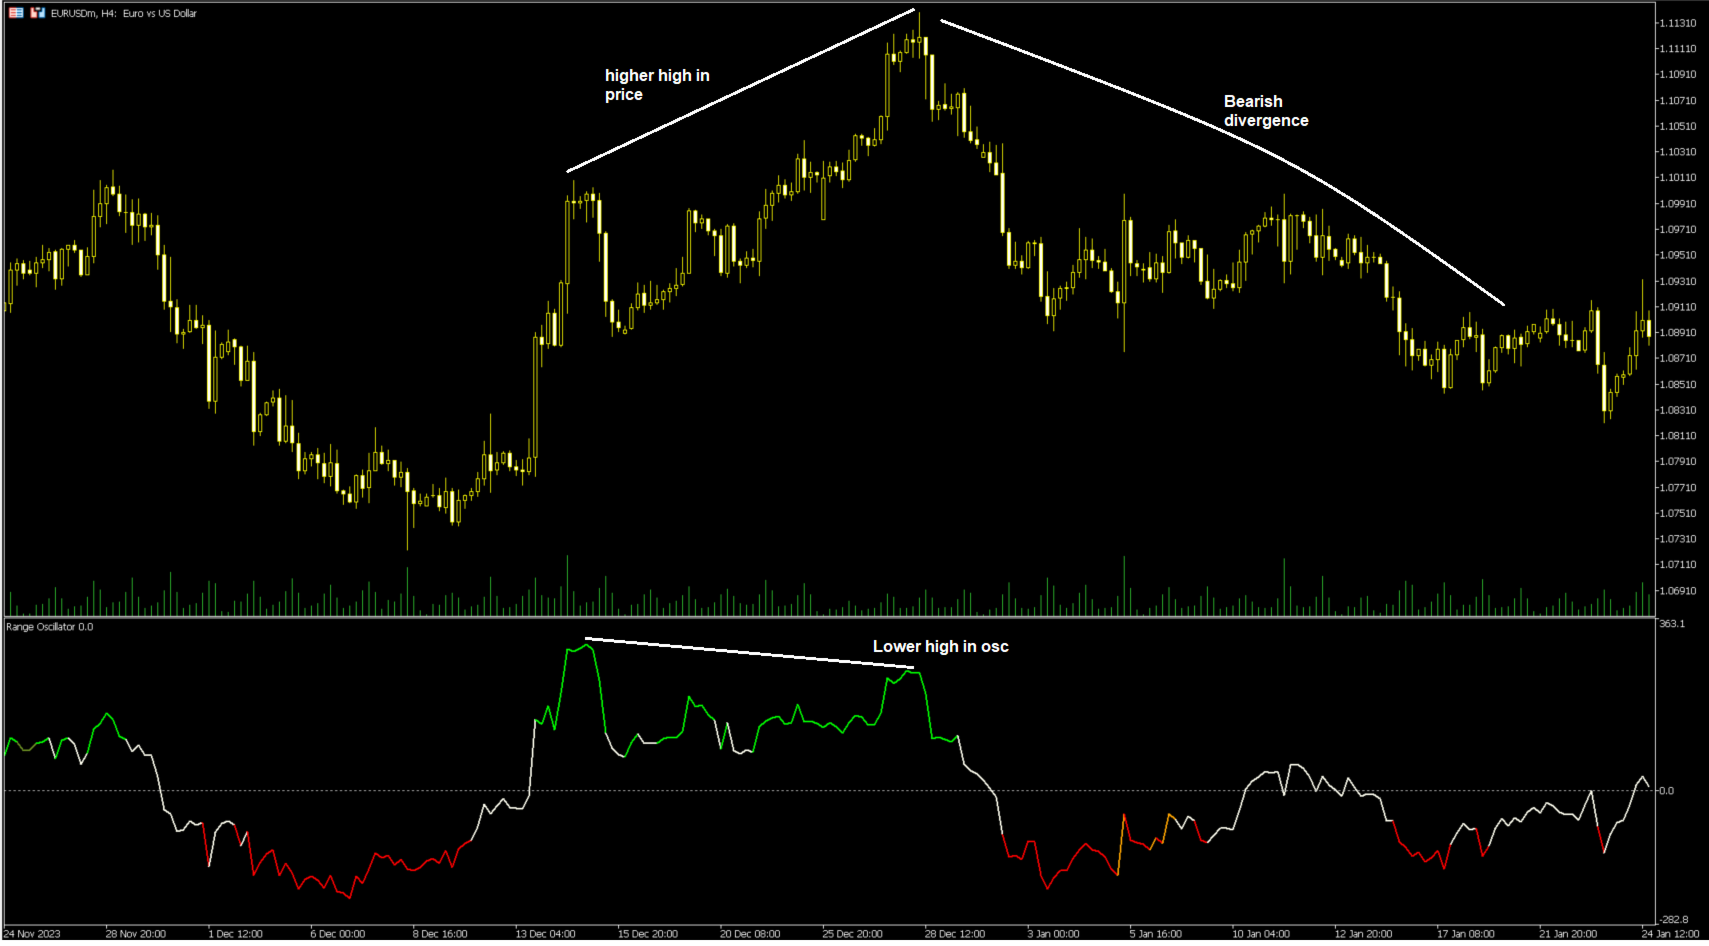
⚪ Divergence
Use oscillator peaks and troughs relative to price action to spot hidden strength or weakness before the next move. (figure6)
- Minimum Range Length: Number of bars needed to confirm a valid range.
- Range Width Multiplier: Expands or contracts range width based on ATR.
- Number of Heat Levels: Number of gradient bands used in the oscillator.
- Notifications settings