TendencyView
- Indicatori
- Versione: 1.0
- Attivazioni: 5

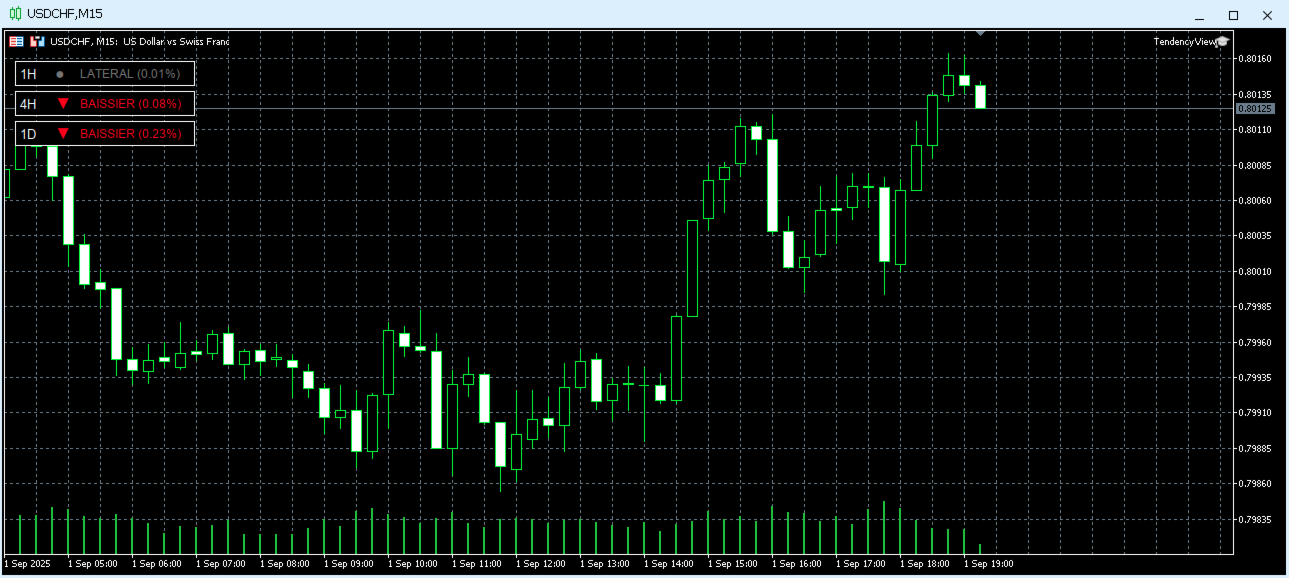
TendencyView is an MQL5 indicator/expert designed to display and analyze the trend of a financial asset (the current symbol) across multiple timeframes in parallel: H1, H4, and D1.
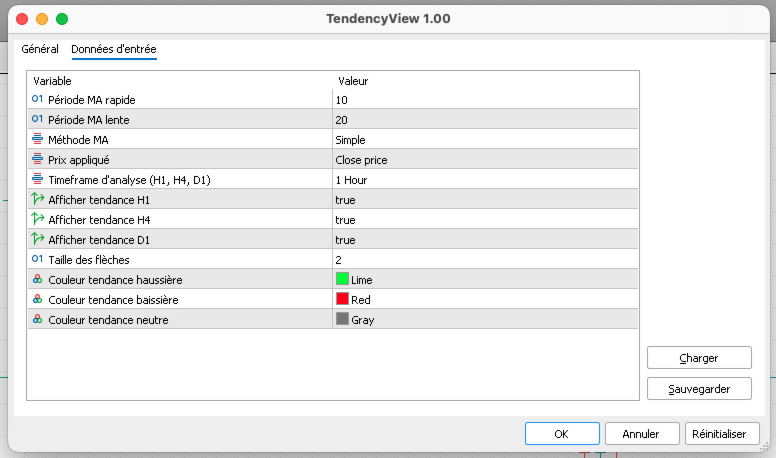
It calculates fast and slow moving averages for each timeframe, compares their crossovers, and determines the trend:
-
TREND_UP (bullish) -> Fast MA > Slow MA
-
TREND_DOWN (bearish) -> Fast MA < Slow MA
-
TREND_SIDEWAYS (sideways) -> No clear consensus
On the chart, regardless of the timeframe, it displays color panels with an arrow ▲ (bullish), ▼ (bearish), or ● (sideways), along with the trend strength expressed in %.
Practical guide to interpreting trend strength (%)
-
0 – 0.5 % → Weak / Negligible
Not a real trend, more like market noise.
Generally, it’s better to avoid entering the market here, unless for scalping. -
0.5 – 2 % → Weak trend
Early stage of a trend with an emerging signal.
Needs confirmation from other indicators. -
2 – 5 % → Medium / Clear trend
Trend is well established with a valid crossover.
This is the most interesting zone for day trading. -
5 – 10 % → Strong trend
Clear acceleration and strong momentum.
Good potential, but beware of excessive volatility. -
> 10 % → Extreme trend
An overextension or excess (often after news, a pump, etc.).
Risk of a sharp reversal is very high and can be violent.
This display provides real support in making your trading decisions