Visual Dynamic Channel Breakout Indicator
- Indicatori
-
AL MOOSAWI ABDULLAH JAFFER BAQER
 To trade successfully we need to go through the proven path that others had gone and reached!
Here are 17 quotes from such successful investors:
1- Limit your size in any position so that fear does not become the prevailing instinct guiding your judgment.
Joe Vidich - Versione: 1.0
- Attivazioni: 5
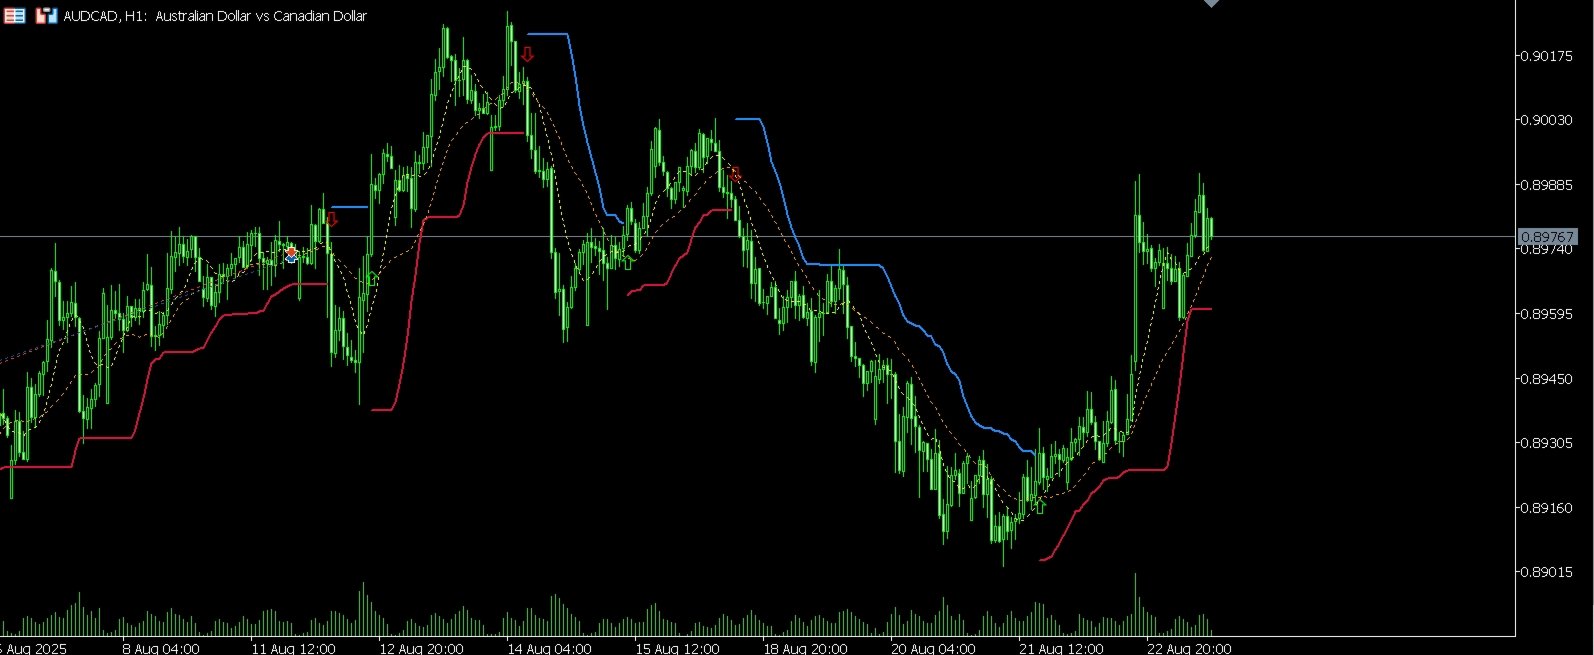
Visual Dynamic Channel Breakout
Unlock the Power of Market Volatility with Precision Breakout Signals
Are you tired of noisy indicators and missed opportunities? The Visual Dynamic Channel Breakout indicator is a professional-grade tool designed to help you identify and capitalize on market trends with confidence. By intelligently adapting to real-time volatility, this indicator provides clear, actionable signals that cut through market noise, allowing you to focus on what matters: making profitable trades.
For just $30, you can equip your MetaTrader 5 platform with a powerful, intuitive, and fully customizable trading tool.
The Logic Behind the Indicator
The core of the Visual Dynamic Channel Breakout system is its intelligent, self-adjusting channel. Unlike static indicators like Bollinger Bands or Donchian Channels, this tool creates a unique channel that dynamically adapts to the market's current volatility.
-
Volatility-Based Channel Width: The indicator first calculates market volatility using a standard deviation over a user-defined period. This value is then multiplied by a specific factor to create the width of the channel. This means that in volatile markets, the channel expands to avoid false signals, and in quiet markets, it tightens to catch breakouts early.
-
Dynamic Trend-Following Bands: This is where the indicator truly shines. The upper and lower bands are not just parallel lines. Once a trend is established, the bands act as a dynamic trailing stop.
-
When an uptrend begins (price breaks above the upper band), the lower band locks in place and will only move up, never down. This creates a rising support level that follows the price, helping you stay in a winning trade longer. The upper band disappears to give the price room to run.
-
Conversely, when a downtrend starts (price breaks below the lower band), the upper band locks in and will only move down, creating a falling resistance level. The lower band disappears, allowing the trend to develop.
-
-
Clear Entry Signals: A trade signal is generated the moment the trend changes.
-
A Buy Signal (Lime Arrow) appears when the price closes above the previous upper band, initiating a new uptrend.
-
A Sell Signal (Red Arrow) appears when the price closes below the previous lower band, initiating a new downtrend.
-
This logic ensures you are always trading with the market's momentum, entering on confirmed breakouts, and using a volatility-adjusted level to guide your trade management.
Key Features
-
Adaptive Volatility Channel: Automatically adjusts to changing market conditions, reducing false signals.
-
Clear Buy and Sell Arrows: Non-repainting arrow signals pinpoint the exact bar where a breakout occurs.
-
Built-in Trend Following Logic: The unique "ratcheting" channel bands help you ride trends for maximum profit.
-
Signal Frequency Control: A built-in delay filter allows you to control how often signals can appear, preventing over-trading in choppy markets.
-
Optional Moving Average Filter: Includes two fully customizable moving averages that can be used for additional trend confirmation.
-
Full Customization: Easily adjust every parameter, including periods, multipliers, MA types, colors, and arrow sizes to fit your unique trading style.
-
Advanced Logging Options: For advanced users, the indicator includes detailed logging features to monitor its performance and behavior.
How to Trade with the Indicator
Strategy 1: Basic Breakout
-
Entry: Enter a buy trade when a new Lime arrow appears. Enter a sell trade when a new Red arrow appears.
-
Stop Loss: Place your initial stop loss just below the recent swing low for a buy, or above the recent swing high for a sell.
-
Take Profit: Exit the trade when an opposite signal arrow appears, or use your own risk-to-reward targets.
Strategy 2: Trend Following with Trailing Stop
-
Entry: Enter on a new arrow signal.
-
Stop Loss: Use the opposite channel band as a dynamic trailing stop. For a buy trade, trail your stop loss just below the crimson lower band. For a sell trade, trail it just above the blue upper band.
-
Take Profit: Let the trade run until your trailing stop is hit, maximizing your gains during strong trends.
Strategy 3: MA Confirmation
-
Entry (Buy): Only take Buy signals (Lime Arrow) when the Fast MA (Yellow) is above the Slow MA (Orange).
-
Entry (Sell): Only take Sell signals (Red Arrow) when the Fast MA (Yellow) is below the Slow MA (Orange).
-
Exit: Exit when an opposite signal appears or when the moving averages cross back against your position.
Input Parameters Explained
Channel Settings
-
Volatility Calculation Period: The lookback period for calculating market volatility.
-
Channel Width Multiplier: A factor to increase or decrease the channel's width.
-
Channel Smoothing Period: Applies a moving average to the high/low prices before calculating the channel for a smoother result.
Moving Average Settings
-
Averaging Method: Choose from Simple, Exponential, Smoothed, or Linear Weighted.
-
Fast Average Period: The period for the faster moving average.
-
Slow Average Period: The period for the slower moving average.
Visual Settings
-
Arrow Distance from Price: Adjust how far the arrows appear from the price bar.
-
Arrow Size: Change the size of the signal arrows.
-
Show Moving Averages: Toggle the visibility of the MA lines on your chart.
Signal Controls
-
Enable bars between signals: Turns the signal frequency filter on or off.
-
Bars to wait between signals: Sets the minimum number of bars that must pass before a new signal can be displayed.
Logging Settings
-
Show detailed logs in journal: Enable or disable expert logs for detailed analysis.
-
Log to file instead of terminal: Save logs to a file for permanent records.
-
Log file name prefix: Set a custom name for your log files.
-
Maximum log file size in MB: Manages log file size to prevent large files.