Custom Candle Mt5
- Indicatori
-
Robby Suhendrawan
 Sviluppatore esperto MT4 e MT5 | Oltre 12 anni di esperienza nel trading
 - Versione: 1.1
- Aggiornato: 8 luglio 2026
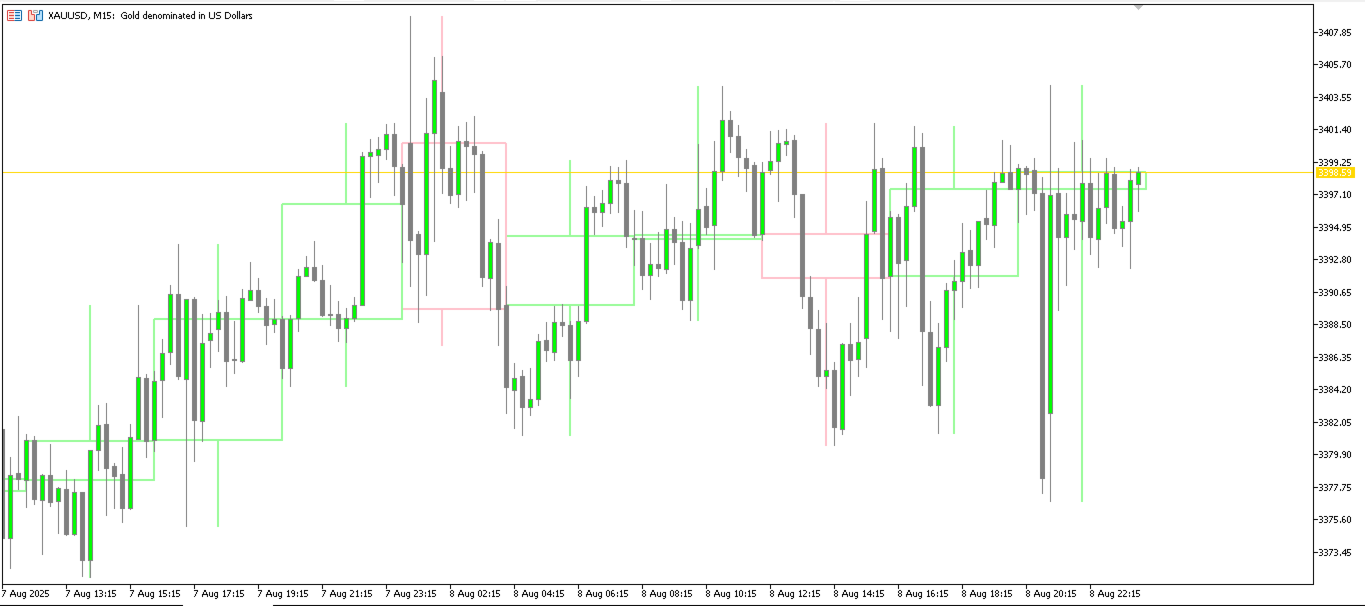
Custom Candle – Multi-Timeframe Visualization
Analyzing multiple timeframes is essential for accurate trading decisions, but switching between charts can be inconvenient and inefficient. The Custom Candle indicator solves this problem by overlaying higher-timeframe (HTF) candles directly onto your lower-timeframe (LTF) chart.
This allows you to see the bigger picture at a glance, align with the higher trend, and improve trade accuracy—without leaving your current chart.
Key Features-
Multi-Timeframe Display – Overlay any higher timeframe (H1, H4, D1, etc.) onto your active chart (M1, M5, M15, etc.).
-
Instant Trend Clarity – Easily spot whether the higher timeframe trend is bullish or bearish.
-
Customizable Design – Choose candle colors, filled or outline mode, and wick display.
-
Lightweight & Clean – Minimal chart clutter for maximum clarity.
-
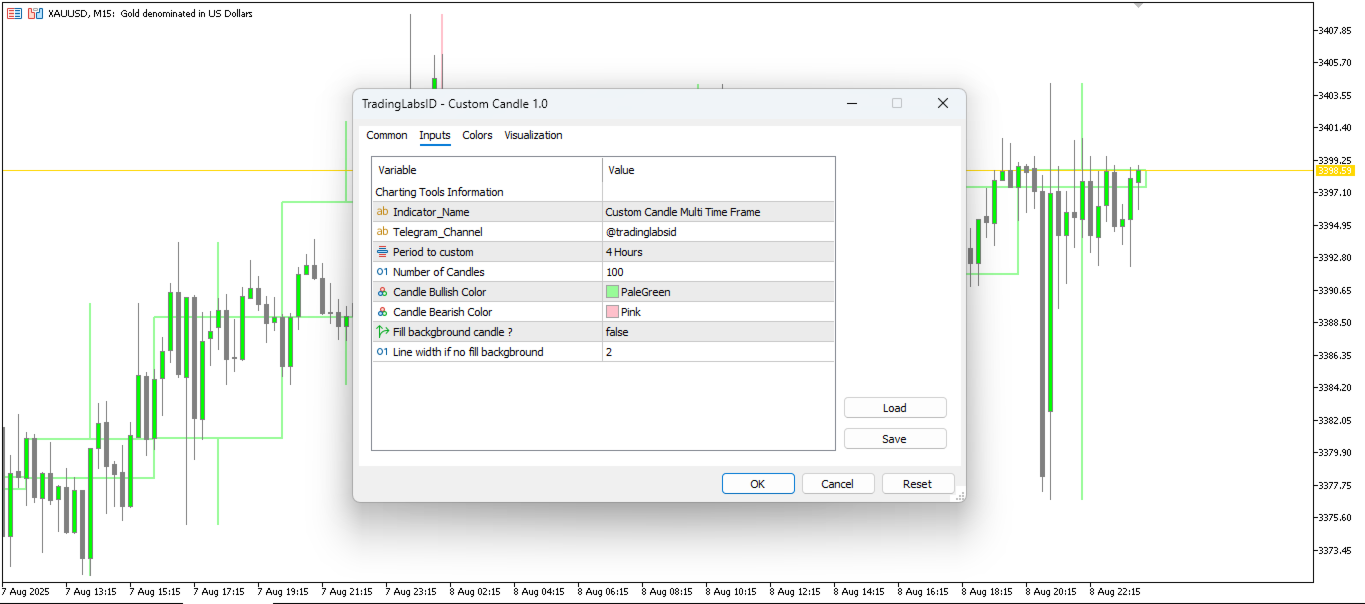
Flexible Settings – Adjust the number of candles shown, line thickness, and display style to match your trading preferences.
-
Period to Custom – Select the higher timeframe to display.
-
Number of Candles – Define how many HTF candles to show.
-
Bullish/Bearish Colors – Customize candle colors.
-
Fill Candle – Choose between filled bodies or outlines only.
-
Line Width – Adjust line thickness for outline mode.
-
Show Wick – Enable or disable wick (shadow) display.
--- MT4 Version is here ---
https://www.mql5.com/en/market/product/146594
SUPPORT & REVIEWS
Your success is my priority. If you love this product, I would greatly appreciate a 5-star review! If you need any assistance with setup or have feature requests, please send me a direct message before leaving feedback. I am always here to help.
Subscribe to TradingLabs ID Channel: https://www.mql5.com/en/channels/tradinglabsid
Check out all my premium trading tools: https://www.mql5.com/en/users/suhendrawan/seller
Contact me for fast support: https://www.mql5.com/en/users/suhendrawan