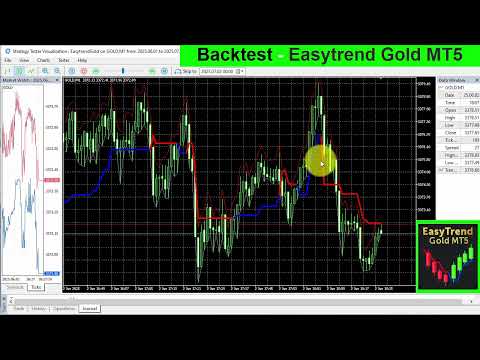
Easytrend Gold MT5

Tired of confusing indicators, especially when trading the volatile Gold market? EasyTrend Gold MT5 is designed to tame Gold's volatility on  any timeframe. It harnesses the power of ATR to translate Gold's sharp movements into a single, clear, and dynamic trend line that cuts through the noise.

Whether you are scalping on M1 or swing trading on H4, you can visualize the trend's direction and strength, easily identify consolidation periods, and gain an intuitive insight into when it's time to act on XAU/USD.

Other Recommended Assets

While optimized for volatile assets like Gold, EasyTrend's logic is highly effective across a range of markets known for strong trends:

  • Major Forex Pairs: EUR/USD, GBP/USD, USD/JPY

  • Stock Indices: US500 (S&P 500), US100 (NASDAQ), GER30 (DAX)

  • Cryptocurrencies: BTC/USD (Bitcoin), ETH/USD (Ethereum)

  • Commodities: WTI/USOIL (Crude Oil)


1. The Strategy: How the Indicator Works in Practice

EasyTrend is a trend-following indicator that uses the Average True Range (ATR) to create a dynamic line that adapts to market volatility. Its main objective is to provide a clear and intuitive visual representation of the prevailing trend direction.

The logic is simple and effective:

  • Uptrend (Blue Line): When the indicator displays a blue line positioned below the candles (candlesticks), it signals an uptrend. In this condition, the line acts as a dynamic support level. As long as prices remain above the blue line, the uptrend is considered to be in effect. The color change from red to blue suggests the beginning of a potential upward movement.

  • Downtrend (Red Line): Conversely, when a red line appears above the candles, the indicator points to a downtrend. The line then functions as a dynamic resistance level. The persistence of prices below the red line reinforces the continuation of the downtrend. The transition from blue to red indicates the start of a possible downward movement.

2. Interpreting the Line's Angle (Trend Strength)

The slope of the EasyTrend line is a powerful visual feature that helps assess the strength and momentum of the market.

  • Steep Angle (Strong Trend): A steep angle on the line, whether upwards (blue) or downwards (red), indicates a strong trend with good momentum. When the line moves quickly along with the price, it reflects a directional market with strong participation from traders.

  • Horizontal Angle (Sideways Market / Consolidation): When the indicator's line becomes flat and horizontal, it is a clear sign that the market has lost its directional momentum. This indicates a period of consolidation or sideways movement. For a trend trader, this is an important visual alert, suggesting that trend-following strategies may be less effective. During these periods, the line defines very clear horizontal support or resistance levels.

3. Adaptation to Volatility and Noise Filtering

Volatile assets and timeframes require responsive tools. Being based on ATR, EasyTrend dynamically adjusts to market volatility. This means that in more volatile markets, the line will move further away from the price, while in low-volatility markets, it will stay closer.

Additionally, the line's "stair-step" logic helps to filter out minor market noise, avoiding color changes on every insignificant price movement and helping the trader stay positioned in the main trend for longer.

Conclusion and Recommendations

EasyTrend is a visually intuitive and effective technical analysis tool designed to simplify the identification of trends, dynamic support, and resistance. It stands out for its clarity in differentiating between strongly trending markets and periods of sideways consolidation.


If this indicator was helpful to you, I have just one small request:

Please leave a quick review (no comment necessary—just a quick star would be greatly appreciated!).

It makes a huge difference to me and helps me continue sharing free, valuable content.

And don't worry—no pressure, no strings attached, ever!

Prodotti consigliati
Moving Average  ******************* Moving Average для платформы секундных графиков Micro . ********************* Секундный график на порядок увеличит точность ваших входов и выходов. Секундный период , в привычном формате,   позволит увидеть то, что ранее было скрыто. Бесплатные индикаторы, дополнят визуальную картину, что, в совокупности выведет вашу торговлю на новый уровень. Идеально подходит как скальперам, так и трейдерам торгующим внутри дня.  Индикатор  Moving Average для платформы Micr
FREE
Description (English): Trend Test by Subho – Advanced Trend & Step Channel System Trend Test by Subho   is a powerful all-in-one trend trading system designed to filter noise and provide clear market direction. This indicator combines two sophisticated algorithms: the   Trend Test ()   and the   Subho Step Channel   into a single chart overlay. It also features a stylish   Live Dashboard   that alerts you to the current trend status in real-time. Key Features: Trend Test () Logic: An advanced tr
FREE
Tillson TMA T3
Emin Ulucanli
5 (5)
TILLSON MOVING AVERAGE Conosciuto anche come indicatore TMA o T3. È una media mobile che utilizza EMA e DEMA nella sua formula ed è calcolata con un'espansione binomiale di 3 grado.       ...    int      handle1;     //Handle of the Tillson TMA T3.EX5 custom indicator    double   euBuff1[];    int TMAperiod= 12 ;    int TMSshift= 0 ;    double VolumeFactor= 0.618 ;    int OnInit ()    {    ...    handle1= iCustom ( NULL , PERIOD_CURRENT , "Market\\Tillson TMA T3.EX5" ,0,TMAperiod,0,0,TMSshift,0
FREE
Bollinger Bands B
Flavio Javier Jarabeck
4.25 (4)
John Bollinger created this indicator in 2010 as a way to read the original indicator (Bollinger Bands) in a more "technical" way, shown as an oscillator. The typical range of the Bollinger Bands %B is 0 - 0.5 - 1.0, where "0" represents the lower band, the "0.5" the middle band, and "1" the upper band. The line on the indicator represents the Closing prices. As simple as that. SETTINGS Bollinger Bands period of analysis Standard Deviation multiplier Shift Price type to be analyzed If you like
FREE
Nexus Breakout line
Mohammed Kaddour
5 (2)
INTRODUCTION : The breakout strength meter is a trading tool that is used to identify which currencies are the strongest to breakout, and which currencies are the weakest to breakout. The settings for the indicator are easy, and if you cannot find the settings, please leave a comment The tools are completely free to use Please, if you like the indicator, please leave a comment and rate the indicator in order to develop it
FREE
Detailed Description: The EMA Trend Histogram Indicator is a powerful tool for traders seeking clear trend identification based on the widely-used Exponential Moving Averages (EMAs).This indicator  provides an easy-to-interpret histogram  and helps you simplify trend identification by using the 50 EMA and 200 EMA on two crucial timeframes: H1 and H4. By observing the relationship between short-term and long-term EMAs on multiple timeframes, this indicator provides a quick and clear view of mark
FREE
HA Trend Flow
Thorsten Koch
5 (1)
HA Trend Flow is a professional two-stage smoothed Heiken Ashi trend indicator for MetaTrader 5. It is designed to clearly visualize market trends , reduce noise and reliably identify sideways market phases – without repainting. Ideal for trend traders, scalpers, swing traders and multi-timeframe analysis . Key Benefits Much smoother trends compared to standard Heiken Ashi 2-stage smoothing (OHLC + Heiken Ashi) Automatic sideways / chop detection Clear neutral & doji candle identificat
FREE
Gaussian Envelope   is an innovative technical indicator that uses Gaussian-weighted moving average to create dynamic price channels. Unlike traditional volatility indicators (Bollinger Bands, Keltner Channels), Gaussian Envelope provides smoother and more accurate price tracking through the use of the bell-shaped Gaussian function. The indicator is particularly effective in trending markets and for identifying reversal points, providing traders with clear entry and exit signals. Key Features
FREE
SuperTrend Indicator – Description & Important Notice The SuperTrend is a composite technical indicator designed to help you identify the primary trend, measure its strength, and assess signal quality. However, an indicator is only a tool —it’s never 100% accurate and cannot replace sound risk management. 1. Core Formula & Components ATR (Average True Range): measures price volatility; customize sensitivity via Periods and Multiplier . Upper/Lower Bands: derived from ATR and your chosen source p
FREE
This indicator is based on Bollinger Bands and moving averages, and uses ADX to get the turning point of the market trend and display a sign. It is basically intended for use with currency pairs and futures with high volatility. In our tests we use it on XAUUSD, 5m and 15m. Win rate is more than 80% with 50 pips stop loss and 50 pips gain or more. The indicator is also a simple indicator that allows you to enable or disable alerts and change the color of the arrows from the indicator settings
FREE
This indicator is a zero-lag indicator and displays exact trend as is. True Trend Moving Average Pro works best in combination with  True Trend Oscillator Pro that displays strength of trend change. True Trend Oscillator Pro: https://www.mql5.com/en/market/product/103589 If you set PERIOD input parameter to 1 this indicator becomes a sharpshooter for binary options. Default input parameters: TT_Period = 10; TT_Meth = MODE_SMA; TT_Price = PRICE_MEDIAN; Before you buy this product, please do t
FREE
Supertrend by Mauroserranoq
Andres Mauricio Serrano Quintero
SuperTrend Indicator Code Description This code defines a custom indicator for the MetaTrader 5 platform called SuperTrend. The indicator is based on the Average True Range (ATR) to identify upward and downward trends in the market. Code Sections: Indicator Information: Defines the indicator's name, copyright, link, version, etc. Configures the indicator to be displayed in a separate window and have 9 internal buffers and 2 visible plots. Sets the properties of the plots (name, drawing type, col
FREE
Renko Box
Andrey Dik
5 (1)
Description. The basis for the formation of the Renko chart is the price range. If the price goes beyond its limits, the chart shows a box above or below the previous one. As a result, we see price movement without additional "noise" and important support and resistance levels. Features. For use in conjunction with the Expert Advisor, an additional buffer is implemented-a box counter. For convenience and to increase the speed of testing, the user can use the "new box" event, which the indicator
FREE
DR IDR Range Indicator
Botond Doczy Rossler
3 (5)
The DR IDR Range Indicator  plots ADR, ODR and RDR ranges for a given amount of days in the past. A key feature that appears is that it calculates the success rate of the ranges for the shown days. This indicator is perfect for backtest since it shows ranges for all of the calculated days, not just the most recent sessions. PRO VERSION https://www.mql5.com/en/market/product/93360 Remember: this free version counts neutral days as true days , so stats might be slightly inflated. To get perfect a
FREE
VWAP Simple
Deibson Carvalho
4.24 (29)
The Volume Weighted Average Price is similar to a moving average, except volume is included to weight the average price over a period.    Volume-Weighted Average Price [VWAP] is a dynamic, weighted average designed to more accurately reflect  a security’s true average price over a given period . Mathematically, VWAP is the summation of money (i.e., Volume x Price) transacted divided by the total volume over any time horizon, typically from market open to market close. VWAP reflects the capitali
FREE
VFI Quantum
Nikita Berdnikov
5 (1)
Introducing VFI (Volume Flow Indicator) – a trading indicator that analyzes the relationship between volume and price movement to identify key trading opportunities. The indicator displays the strength and direction of volume flow, providing clear signals about potential entry and exit points. Signals are formed based on zero line crossovers, crossovers between the VFI line and its exponential moving average (EMA), and when the indicator exits overbought and oversold zones. Attention! This stra
FREE
Dark Bands MT5
Marco Solito
4.9 (308)
Dark Bands   is an Indicator for intraday trading. This Indicator is based on Counter Trend  strategy but use also Volatility. We can enter in good price with this Indicator, in order to follow the inversions on the current instrument. Key benefits Easily visible take profit/stop loss lines Reliable bands lines with futuristic colors, and  Intuitive directional arrows Useful statistics , which indicate the win rate of the signals Plus Package  available, leave a feedback to receive it for fr
FREE
Long Term Double MACD Strategy with EMA Trend Confirmation This strategy uses a leading and lagging MACD indicator. The leading indicator gives the entry signals, and the lagging indicator gives the exit signals. This Expert does not use any account management and as such you should make sure to set good stop losses. Works best on longer timeframes on low volatility pairs.
FREE
The Magic EMA indicator is of great help in determining trend direction. It can be an excellent addition to your existing strategy or the basis of a new one. We humans can make better decisions when we see better visually. So we designed it to show a different color for rising and falling trends. Everyone can customize this in the way that suits them best. By setting the Trend Period, we can optimize it for longer or shorter trends for our strategy. It is great for all time frames. IF YOU NEED
FREE
Strong Move
Triet Lam Minh
This indicator combines RSI(14) and ADX(14) to find out the signal that price moves strongly. When it appears signal (represent by the yellow dot), and price is going down, let consider to open a SELL order. Otherwise, let consider to open a BUY order. In this case, the strength of moving is strong (normally after sideway period), so  we can set TP by 3 times of SL  . 
FREE
PROMETHEUS TECHNICAN VERSION Free | By THE SONS A gift from The Sons — no strings, no trial, no expiry. Every trader deserves access to professional-grade market intelligence. That belief is why Prometheus Technical Version exists, and why it costs nothing. Consider it our handshake to the trading community. What You're Getting This is not a simplified tool dressed up as a gift. Prometheus Technican Version is a fully built, institutional-quality technical analysis indicator running a dual-model
FREE
Magnified Price Experience trading like never before with our Magnified Price indicator by BokaroTraderFx , designed exclusively for MetaTrader 5. This revolutionary tool provides traders with instant insights into price movements, offering a clear advantage in today's fast-paced markets. Key Features: 1. Real-time Precision: Instantly magnify price action to uncover hidden trends and patterns.  2. Enhanced Visibility: Clear visualization of price movements with adjustable zoom levels. 3. User
FREE
Overview? The **Pivot Points On Custom Timeframe** indicator for MetaTrader 5 calculates and displays traditional pivot levels (P, S1–S3, R1–R3) based on a higher timeframe of your choice, regardless of the current chart's timeframe. It is designed to help traders identify potential support and resistance zones using classic pivot formulas, calculated from user-defined periods such as D1, W1, H4, etc. This indicator can optionally show price labels and trigger alerts when price crosses the piv
FREE
Intraday Momentum Index IMI
Danilo Hudson Couto Monteiro
Indicador IMI (Intraday Momentum Index) Descrição O Indicador IMI (Intraday Momentum Index) é uma poderosa ferramenta de análise técnica desenvolvida para identificar a força do momentum e potenciais reversões no mercado. Este indicador quantifica a relação entre ganhos e perdas durante um período específico, ajudando traders a avaliar a dinâmica atual do mercado. Características Oscila entre 0 e 100, facilitando a interpretação das condições de mercado Identifica com precisão áreas de sobrecomp
FREE
IQuantum
Evgeniy Scherbina
The indicator IQuantum shows trading signals for 10 symbols in the daily chart: AUDCAD, AUDUSD, EURUSD, GBPCAD, GBPCHF, GBPUSD, NZDUSD, USDCAD, USDCHF, and USDJPY. Signals of the indicator are produced by 2 neural models which were trained independently from one another. The inputs for the neural models are normalised prices of the symbols, as well as prices of Gold, Silver and markers of the current day. Each neural model was trained in 2 ways. The Ultimate mode is an overfitted neural model
FREE
Moving Average Force
Lorenzo Marchesin
5 (2)
Scalp using the behavior of a short moving average, the indicator gives the slope and identifies the "hyper" moments. Operational advice: Use   M1   chart. Period 20 : open buy after two rising lows; sell after two max downhill; avoid countertrend openings; when the line goes flat put a stop at the opening price. Avoid actions in low volatility timeslots. When the curve that draws the min / max is very flat, it is better to postpone at least 15'. Period 50 : matches the trend, when it is at
FREE
Trend Signals Pro
Pavel Golovko
4.75 (12)
Simplify your trading experience with Trend Signals Professional indicator. Easy trend recognition. Precise market enter and exit signals. Bollinger Bands trend confirmation support. ATR-based trend confirmation support. (By default this option is OFF to keep interface clean. You can turn it ON in indicator settings.) Easy to spot flat market conditions with  ATR-based trend confirmation  lines. Highly customizable settings. Fast and responsive. Note: Do not confuse ATR-based trend confirmation
FREE
SMMA Bands Indicator
Elie Baptiste Granger
The SMMA Bands indicator is an advanced volatility-based trading tool that creates 6 dynamic support and resistance levels around an envelope formed by two Smoothed Moving Averages (SMMA).  This indicator combines the reliability of SMMA trend identification with the precision of standard deviation-based volatility bands, making it suitable for both trend-following and mean-reversion strategies. Every band has its own buffer for use in EA. feel free to make suggestions and add reviews , i will
FREE
Force VADX
Clayton Prickett
Force VADX Indicator Force VADX is an advanced, multi-factor indicator that fuses volume-adjusted trend strength, normalized force index, and adaptive directional signals. Designed for modern traders, it pinpoints high-confidence buy and sell zones, offering a robust technical foundation for both discretionary and automated trading. Use this indicator in conjuntion with other tools for confirmation and confluene. This indicator is not intended to be a complete trading system but rather a tool
FREE
La Matrice AurumEdge è un algoritmo di identificazione del trend multi-timeframe (MTF) di livello commerciale, progettato specificamente per filtrare il rumore stocastico del mercato e ridurre in modo aggressivo i drawdown causati da movimenti “whipsaw” in condizioni macro di mercato laterale. Inizialmente sviluppata come motore matematico centrale di segnali per un sistema privato di trading algoritmico automatizzato, oggi rendiamo disponibile la matrice visiva pura per trader manuali che richi
FREE
Gli utenti di questo prodotto hanno anche acquistato
SuperScalp Pro
Van Minh Nguyen
4.63 (24)
SuperScalp Pro – Sistema avanzato di indicatore scalping multi-filtro SuperScalp Pro è un indicatore di scalping avanzato che combina il classico Supertrend con molteplici filtri intelligenti di conferma per aiutare a identificare opportunità di trading. Funziona in modo efficiente su diversi timeframe da M1 a H4, con prestazioni ottimizzate su XAUUSD, BTCUSD e principali coppie Forex. L’indicatore fornisce chiari segnali Buy e Sell, insieme a livelli di ingresso, stop loss e take profit calcola
Divergence Bomber
Ihor Otkydach
4.9 (89)
Ogni acquirente dell’indicatore riceverà inoltre gratuitamente: L’utilità esclusiva “Bomber Utility”, che gestisce automaticamente ogni operazione, imposta i livelli di Stop Loss e Take Profit e chiude le posizioni secondo le regole della strategia I file di configurazione (set file) per adattare l’indicatore a diversi asset I set file per configurare il Bomber Utility in tre modalità: “Rischio Minimo”, “Rischio Bilanciato” e “Strategia di Attesa” Una guida video passo-passo per installare, conf
SignalTech MT5 is an unique fully rule based trading system for EURUSD, USDCHF, USDJPY, AUDUSD, NZDUSD, EURJPY, AUDJPY, NZDJPY, CADJPY.  All the winning trades with chart setups are published on the comments page. 2026-05 3493 Pips (Until 05-21 NY Closed) 2026-04 2243 Pips 2026-03 2165 Pips 2026-02 2937 Pips 2026-01 2624 Pips 2025-12 1174 Pips It can generate signals with Buy/Sell Arrows and Pop-Up/Sound Alerts. Each signal has clear Entry and Stop Loss levels, which should be automatically flag
Gold Entry Sniper
Tahir Mehmood
5 (9)
Gold Entry Sniper – Dashboard ATR Multi-Timeframe per Scalping e Swing Trading sull’Oro Gold Entry Sniper è un indicatore avanzato per MetaTrader 5 che offre segnali di acquisto/vendita precisi per XAUUSD e altri strumenti, basato sulla logica ATR Trailing Stop e l' analisi multi-timeframe . Caratteristiche e Vantaggi Analisi Multi-Timeframe – Visualizza trend su M1, M5, M15 in un'unica dashboard. Trailing Stop Basato su ATR – Stop dinamici che si adattano alla volatilità. Dashboard Professional
Entry In The Zone and SMC Multi Timeframe is a real-time 2-in-1 market analysis tool that combines market structure analysis and a No Repaint BUY / SELL signal system into a single indicator, built on Smart Money Concepts (SMC) — a widely adopted framework used by professional traders to understand market structure. This indicator helps you see the market more clearly, make decisions based on structure rather than guesswork, and focus on high-probability zones where price is more likely to react
Cominciamo con la verità. Nessun indicatore da solo ti renderà profittevole. Se qualcuno ti dice il contrario, ti sta vendendo un sogno. Qualsiasi indicatore che mostra frecce perfette di acquisto/vendita può essere reso impeccabile — basta ingrandire la giusta sezione della storia e catturare solo i trade vincenti. Noi non lo facciamo.  SMC Intraday Formula è uno strumento. Legge la struttura del mercato per te, identifica le zone a più alta probabilità e ti mostra esattamente come appare la t
Azimuth Pro
Ottaviano De Cicco
5 (7)
Azimuth Pro V2: Synthetic Fractal Structure and Confirmed Entries for MT5 Overview Azimuth Pro is a multi-level swing structure indicator by Merkava Labs . Four nested swing layers, swing-anchored VWAP, ABC pattern detection, three-timeframe structural filtering, and closed-bar confirmed entries — one chart, one workflow from micro-swings to macro-cycles. This is not a blind signal product. It is a structure-first workflow for traders who care about location, context, and timing. V2 Launch Offe
Power Candles MT5
Daniel Stein
5 (8)
Power Candles V3 - Indicatore di forza ad ottimizzazione automatica Power Candles V3 trasforma la forza delle valute e degli strumenti in un piano di trading attuabile su ogni grafico a cui è collegato. Invece di limitarsi a colorare le candele, esegue un'auto-ottimizzazione in tempo reale in background e ti fornisce i migliori valori di Stop Loss, Take Profit e soglia di segnale per il simbolo che hai davanti. Basta un clic per adottarlo nel trading live: i raggi di ingresso, Stop Loss e Take P
INDICATORE TREND CATCHER L'indicatore Trend Catcher analizza i movimenti dei prezzi di mercato, utilizzando una combinazione di indicatori di analisi del trend proprietari dell'autore e personalizzati. Identifica la vera direzione del mercato filtrando il rumore a breve termine e concentrandosi sulla forza del momentum sottostante, sull'espansione della volatilità e sul comportamento della struttura dei prezzi. Utilizza inoltre una combinazione di indicatori personalizzati di smoothing e filtr
Se acquisti questo indicatore, riceverai il mio Trade Manager Professionale + EA  GRATUITAMENTE. Innanzitutto è importante sottolineare che questo sistema di trading è un indicatore Non-Repainting, Non-Redrawing e Non-Lagging, il che lo rende ideale sia per il trading manuale che per quello automatico. Corso online, manuale e download di preset. Il "Sistema di Trading Smart Trend MT5" è una soluzione completa pensata sia per i trader principianti che per quelli esperti. Combina oltre 10 indicat
Gann Made Easy è un sistema di trading Forex professionale e facile da usare che si basa sui migliori principi del trading utilizzando la teoria di mr. WD Gann. L'indicatore fornisce segnali ACQUISTA e VENDI accurati, inclusi i livelli di Stop Loss e Take Profit. Puoi fare trading anche in movimento utilizzando le notifiche PUSH. CONTATTAMI DOPO L'ACQUISTO PER RICEVERE GRATUITAMENTE LE ISTRUZIONI DI TRADING E OTTIMI INDICATORI EXTRA! Probabilmente hai già sentito parlare molte volte dei metodi d
ARIPoint
Temirlan Kdyrkhan
1 (1)
ARIPoint is a powerful trading companion designed to generate high-probability entry signals with dynamic TP/SL/DP levels based on volatility. Built-in performance tracking shows win/loss stats, PP1/PP2 hits, and success rates all updated live. Key Features: Buy/Sell signals with adaptive volatility bands Real-time TP/SL/DP levels based on ATR Built-in MA Filter with optional ATR/StdDev volatility Performance stats panel (Success, Profit/Loss, PP1/PP2) Alerts via popup, sound, push, or email Cu
FX Trend MT5 NG
Daniel Stein
5 (6)
FX Trend NG: La Nuova Generazione di Intelligenza di Trend Multi-Mercato Panoramica FX Trend NG è uno strumento professionale di analisi del trend multi-timeframe e monitoraggio dei mercati. Ti consente di comprendere la struttura completa del mercato in pochi secondi. Invece di passare tra numerosi grafici, puoi identificare immediatamente quali strumenti sono in trend, dove il momentum sta diminuendo e dove esiste un forte allineamento tra i timeframe. Offerta di Lancio – Ottieni FX Trend NG
Innanzitutto, vale la pena sottolineare che questo Strumento di Trading è un Indicatore Non-Ridipingente, Non-Ridisegnante e Non-Laggante, il che lo rende ideale per il trading professionale. Corso online, manuale utente e demo. L'Indicatore Smart Price Action Concepts è uno strumento molto potente sia per i nuovi che per i trader esperti. Racchiude più di 20 utili indicatori in uno solo, combinando idee di trading avanzate come l'Analisi del Trader del Circolo Interno e le Strategie di Tradin
Trend Screener Pro MT5
STE S.S.COMPANY
4.85 (104)
Indicatore di tendenza, soluzione unica rivoluzionaria per il trading di tendenze e il filtraggio con tutte le importanti funzionalità di tendenza integrate in un unico strumento! È un indicatore multi-timeframe e multi-valuta al 100% non ridipingibile che può essere utilizzato su tutti i simboli/strumenti: forex, materie prime, criptovalute, indici e azioni. Trend Screener è un indicatore di tendenza che segue un indicatore efficiente che fornisce segnali di tendenza a freccia con punti nel gra
KT Alpha Hunter Arrows MT5
KEENBASE SOFTWARE SOLUTIONS
La maggior parte degli indicatori a frecce ti dà un segnale e poi ti lascia capire da solo tutto il resto. KT Alpha Hunter Arrows ti offre un piano di trading completo. Ogni freccia di segnale appare con un piano completo già disegnato: linea di ingresso, stop loss, quattro livelli di take profit e un verdetto live sull’edge, che ti indica se quel simbolo e quel timeframe meritano davvero di essere tradati in quel momento. Il Trade Manager EA incluso gestisce l’esecuzione dopo il tuo ingresso, c
Presentazione       Quantum Breakout PRO   , l'innovativo indicatore MQL5 che sta trasformando il modo in cui scambi le zone di breakout! Sviluppato da un team di trader esperti con un'esperienza di trading di oltre 13 anni,       Quantum Breakout PRO       è progettato per spingere il tuo viaggio di trading a nuovi livelli con la sua strategia innovativa e dinamica della zona di breakout. Quantum Breakout Indicator ti fornirà frecce di segnalazione sulle zone di breakout con 5 zone target di
Gem SIGNAL
Shengzu Zhong
5 (1)
GEM Signal Pro GEM Signal Pro è un indicatore trend-following per MetaTrader 5, progettato per i trader che desiderano segnali più chiari, configurazioni operative più strutturate e una gestione del rischio più pratica direttamente sul grafico. Invece di mostrare solo una semplice freccia, GEM Signal Pro aiuta a presentare l’intera idea di trading in modo più chiaro e leggibile. Quando le condizioni sono confermate, l’indicatore può mostrare sul grafico il prezzo di ingresso, lo stop loss e gli
FX Levels MT5
Daniel Stein
5 (14)
FX Levels: Supporti e Resistenze di Precisione Eccezionale per Tutti i Mercati Panoramica Rapida Cercate un modo affidabile per individuare livelli di supporto e resistenza in ogni mercato—coppie di valute, indici, azioni o materie prime? FX Levels fonde il metodo tradizionale “Lighthouse” con un approccio dinamico all’avanguardia, offrendo una precisione quasi universale. Basato sulla nostra esperienza reale con i broker e su aggiornamenti automatici giornalieri più quelli in tempo reale, FX
Market Structure Order Block Dashboard MT5 è un indicatore MT5 progettato per i trader che vogliono leggere la struttura di mercato e le principali zone di reazione del prezzo direttamente sul grafico. Combina BOS, ChoCH, Order Blocks, Fair Value Gaps (FVG), Liquidità, Kill Zones, Volume Profile e un pannello compatto per un'analisi rapida. Questo indicatore è rivolto ai trader che utilizzano la struttura di mercato, i concetti ICT e Smart Money come quadro decisionale. Può aiutare a individuare
FX Power MT5 NG
Daniel Stein
5 (32)
FX Power: Analizza la Forza delle Valute per Decisioni di Trading Più Intelligenti Panoramica FX Power è lo strumento essenziale per comprendere la reale forza delle principali valute e dell'oro in qualsiasi condizione di mercato. Identificando le valute forti da comprare e quelle deboli da vendere, FX Power semplifica le decisioni di trading e rivela opportunità ad alta probabilità. Che tu segua le tendenze o anticipi inversioni utilizzando valori estremi di Delta, questo strumento si adatta
Btmm state engine pro
Garry James Goodchild
5 (4)
BTMM State Engine Pro is a MetaTrader 5 indicator for traders who use the Beat The Market Maker approach: Asian session context, kill zone timing, level progression, peak formation detection, and a multi-pair scanner from a single chart. It combines cycle state logic with a built-in scanner dashboard so you do not need the same tool on many charts at once. What it does Draws the Asian session range; session times can follow broker server offset or be set in inputs. Tracks level progression (L
Reversal Master for MT5 Reversal Master for MT5 is a non‑repainting reversal indicator for MetaTrader 5. It helps you detect potential market reversal points and shows the maximum favourable price movement after each historical signal, so you can better understand how price behaved after similar situations in the past. The MT5 version keeps the familiar reversal‑signal logic of the original Reversal Master for MT4, but adds improved visualisation, historical statistics and a points summary panel
OrderFlux | Footprint Orderflow per MetaTrader 5 Versione 2.0 – Visualizzazione Bid/Ask in tempo reale per Trader Attivi OrderFlux è un indicatore di footprint e orderflow per MT5. Non mostra solo dove si è mosso il prezzo, ma cosa succede all'interno del movimento: volume Bid/Ask per livello di prezzo, delta, imbalance e distribuzione del volume. Molti grafici ti mostrano solo il risultato finale di una candela. OrderFlux ti mostra il percorso per arrivarci. Questo è esattamente ciò che aiuta q
Quantum TrendPulse
Bogdan Ion Puscasu
5 (25)
Ecco   Quantum TrendPulse   , lo strumento di trading definitivo che combina la potenza di   SuperTrend   ,   RSI   e   Stocastico   in un unico indicatore completo per massimizzare il tuo potenziale di trading. Progettato per i trader che cercano precisione ed efficienza, questo indicatore ti aiuta a identificare con sicurezza le tendenze di mercato, i cambiamenti di momentum e i punti di entrata e uscita ottimali. Caratteristiche principali: Integrazione SuperTrend:   segui facilmente l'andame
Atomic Analyst MT5
Issam Kassas
3.94 (31)
Innanzitutto, vale la pena sottolineare che questo indicatore di trading non è repaint, non è ridisegno e non presenta ritardi, il che lo rende ideale sia per il trading manuale che per quello automatico. Manuale utente: impostazioni, input e strategia. L'Analista Atomico è un indicatore di azione del prezzo PA che utilizza la forza e il momentum del prezzo per trovare un miglior vantaggio sul mercato. Dotato di filtri avanzati che aiutano a rimuovere rumori e segnali falsi, e aumentare il pote
RelicusRoad Pro MT5
Relicus LLC
4.96 (24)
RelicusRoad Pro: Sistema Operativo Quantitativo di Mercato 70% DI SCONTO ACCESSO A VITA (TEMPO LIMITATO) - UNISCITI A 2.000+ TRADER Perché la maggior parte dei trader fallisce anche con indicatori "perfetti"? Perché operano su Singoli Concetti isolati. Un segnale senza contesto è una scommessa. Per vincere serve CONFLUENZA . RelicusRoad Pro non è un semplice indicatore. È un Ecosistema Quantitativo completo . Mappa la "Fair Value Road", distinguendo tra rumore e rotture strutturali. Smetti di in
Trend Forecaster
Alexey Minkov
5 (7)
Trend Forecaster – Since 2023. The Trend Forecaster indicator utilizes a unique proprietary algorithm to determine entry points for a breakout trading strategy. The indicator identifies price clusters, analyzes price movement near levels, and provides a signal when the price breaks through a level. The Trend Forecaster indicator is suitable for all financial assets, including currencies (Forex), metals, stocks, indices, and cryptocurrencies. You can also adjust the indicator to work on any time
Meridian Pro
Ottaviano De Cicco
5 (2)
Meridian Pro 2.00: Professional Multi-Timeframe Trend Matrix for MT5 Meridian Pro 2.00 is a professional adaptive trend matrix for MetaTrader 5. It combines the original Meridian trend engine, a clean chart ribbon, closed-bar signal arrows, an 8-timeframe dashboard, Fuel momentum, weighted consensus, synthetic HTF processing and chart-native higher-timeframe context lines. The goal is simple: read current trend, multi-timeframe structure, strength, momentum and EA-ready state from one discipline
Questo cruscotto mostra gli ultimi   pattern armonici   disponibili per i simboli selezionati, in modo da risparmiare tempo ed essere più efficienti /   versione MT4 . Indicatore gratuito:   Basic Harmonic Pattern Colonne dell'indicatore Symbol :   vengono visualizzati i simboli selezionati Trend:   rialzista o ribassista Pattern:   tipo di pattern (gartley, butterfly, bat, crab, shark, cypher o ABCD) Entry:   prezzo di ingresso SL:   prezzo di stop loss TP1:   1 prezzo di take profit TP2:
Altri dall’autore
Gold Oracle Scalper Adaptive
Glaudes Laurislei Moreira
Gold Oracle M1 - Adaptive Strategy for GOLD with Dynamic Risk Management Introducing   Gold Oracle , a meticulously developed and tested Expert Advisor (EA) specifically for trading the   GOLD (XAUUSD)   asset on the M1 timeframe. This EA is the result of extensive research and optimization, seeking a balance between profitability and, crucially, robust risk management that adapts to different market conditions. If you are looking for an automated Gold trading solution that prioritizes consiste
Master the volatile Gold (XAUUSD) market on the M1 timeframe with the  Multisignal Divergence Gold M1 Scalper Pro . This indicator is not just another tool, but an advanced trading engine, meticulously designed to provide scalpers with high-precision entry signals, filtering out noise and focusing on robust confluences. The Challenge of Gold M1 Scalping: Scalping, especially on an asset like Gold on the M1, demands speed, precision, and an exceptional ability to identify momentary reversals and
Filtro:
Nessuna recensione
Rispondi alla recensione