Drawing Assistance MT4
- Indicatori
-
Sopheak Khlot
 Sono un trader forex a tempo pieno e uno sviluppatore MQL. Offro servizi di sviluppo di EA.
Indicatore e EA gratuiti: https://t.me/bestforexscript - Versione: 1.1
- Aggiornato: 1 marzo 2025
- Attivazioni: 5
As an ICT or SMC trader you must do top-down analysis, and you struggle to make template of drawing object on Metatrader just like you normally do on Tradingview. Well, Drawing Assistance indicator will make your top-down analysis much easier on Metatrader.
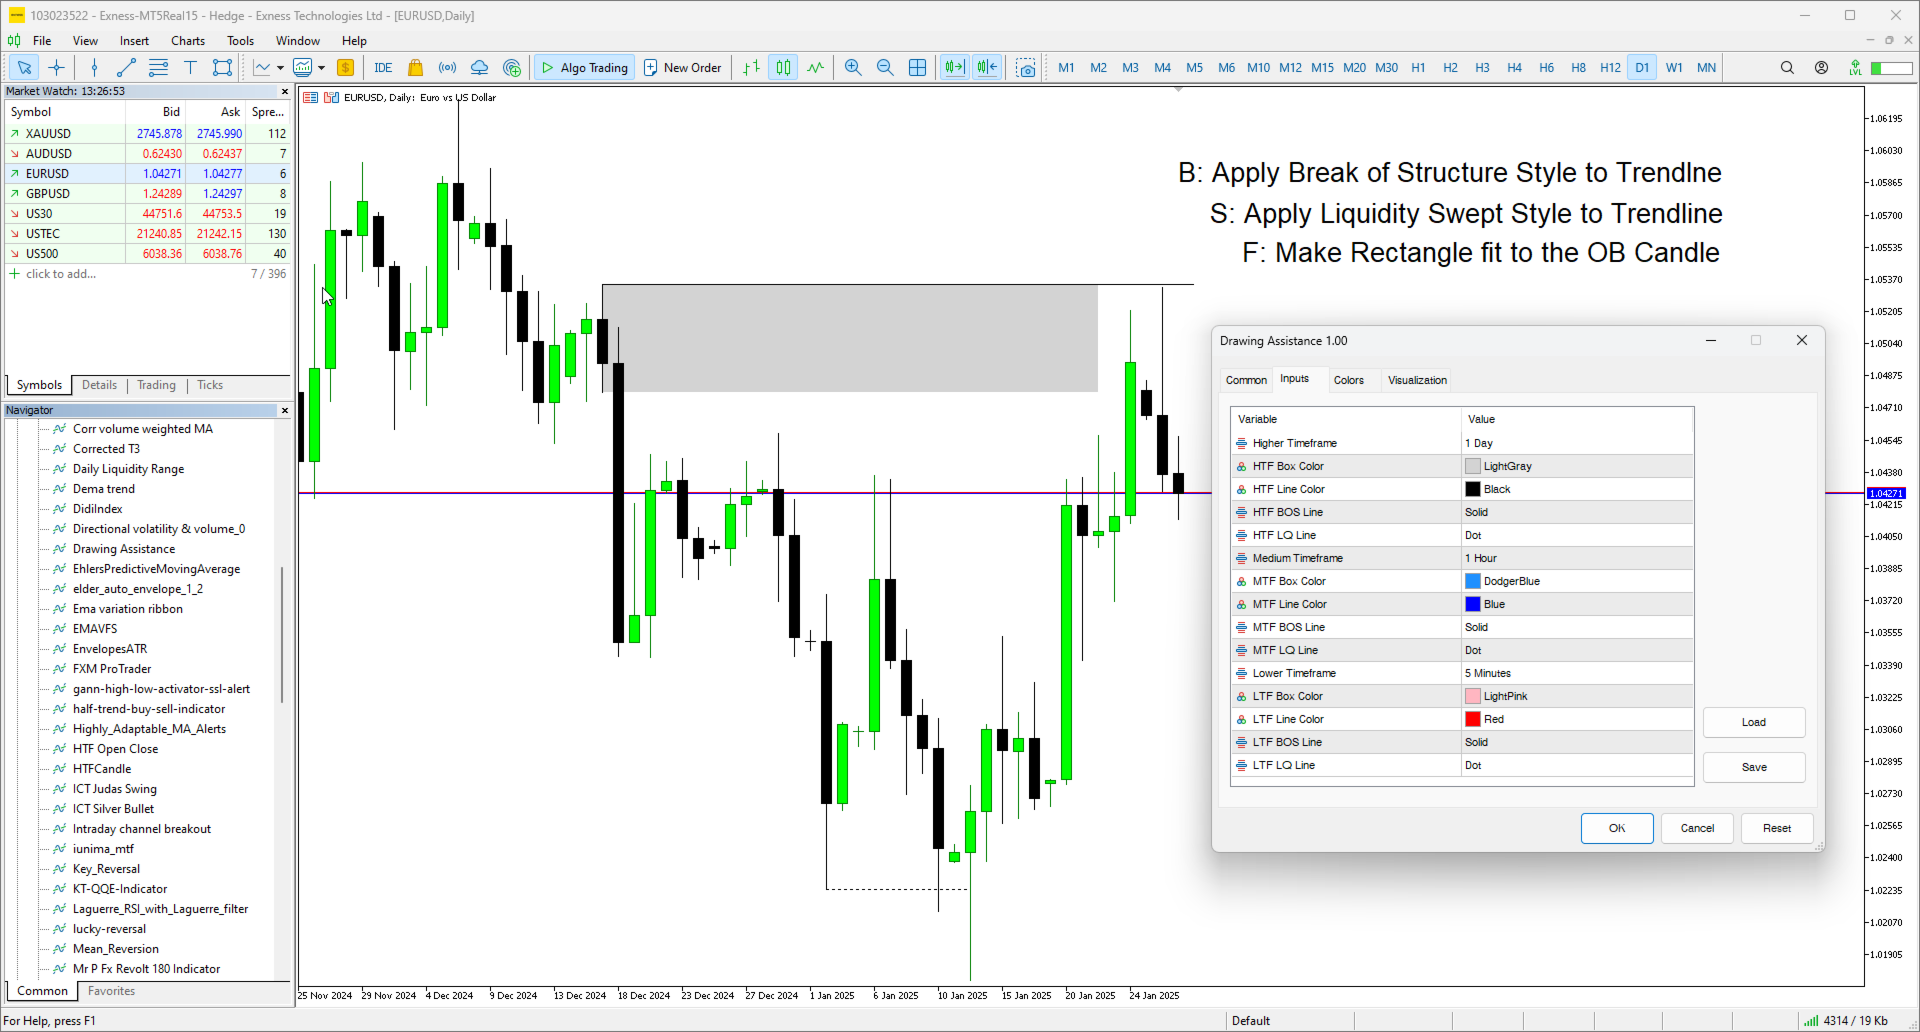
- Allow to design template for 3 timeframes. (HTF, MTF and LTF).
- Each objects drawn on chart will have the color, style and visibility individually by the timeframe it was drawn on.
- Save time as all analyzing is done on Metatrader chart.
Shortcut Keys:
- Key B: Apply the BOS style to a Trendline
- Key L: Apply the Liquidity Swept style to a Trendline
- Key O: Apply the Order Block (Box) to a Rectangle by fitting to the High and Low of the candle.
- Key F: Apply the FVG (Box) to a Rectangle buy fitting to the High/Low of the first candle and to the Low/High of the third candle.