Custom Timeframe Chart Creator
- Utilità
- Versione: 1.0
- Attivazioni: 20

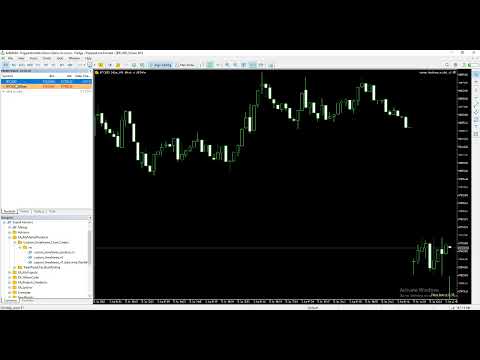
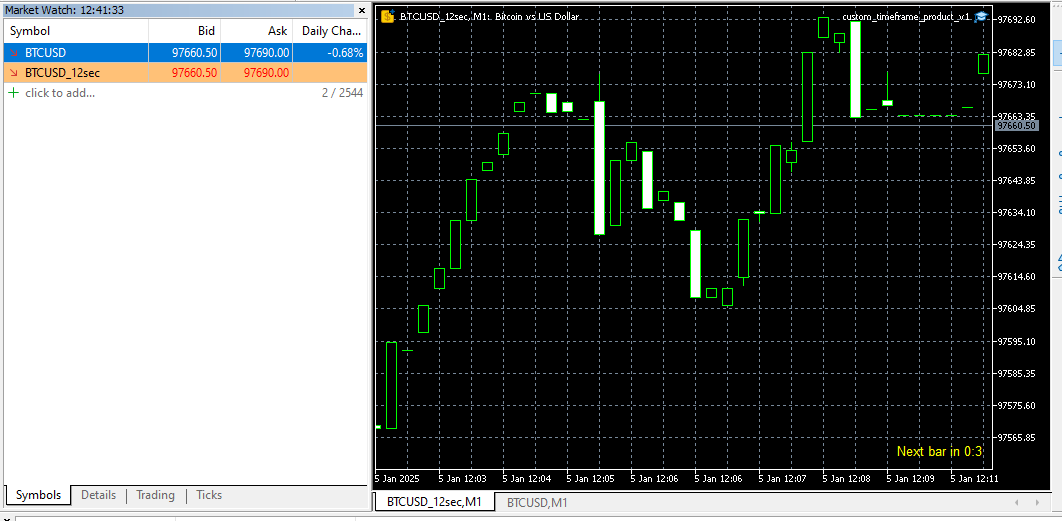
Introducing our Expert Advisor (EA) that empowers you to create custom timeframes in MetaTrader 5, defined in seconds—from as short as 1 second. This EA generates a new symbol with your specified timeframe, updating with every tick. Utilize this symbol for real-time analysis, trading, and backtesting your strategies.
Additionally, our EA allows you to adjust your chart's time zone independently of your broker's. Given that brokers operate across various time zones, their charts can differ. With this feature, you can set a consistent reference time zone for your charts and analyses, ensuring uniformity across your trading activities.
For a comprehensive guide on this EA in MT5, you might find the following video helpful.
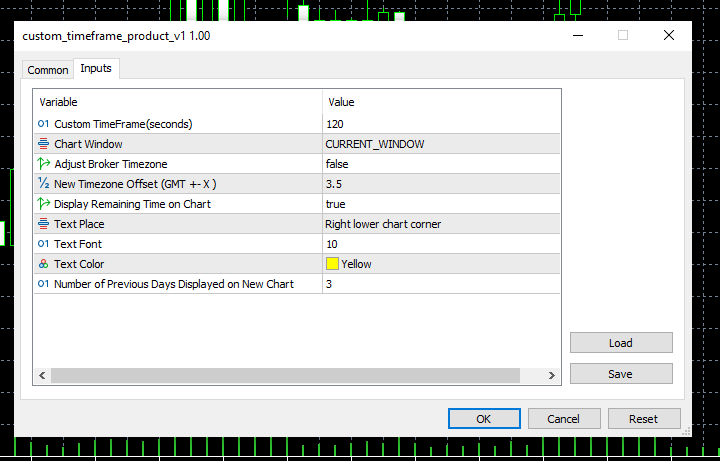
Input parameters with examples:
1- Custom Timeframe (Seconds): Specify your desired timeframe in seconds, such as 5 seconds, 68 seconds (1:08), or 1,246 seconds (20:46). If the chosen timeframe doesn't evenly divide into 24 hours, the final candle of the day will have a shorter duration. For example, with a 7-hour timeframe (7 * 3,600 seconds), candles will span from 00:00 to 07:00, 07:00 to 14:00, 14:00 to 21:00, and the last candle from 21:00 to 00:00.
2- Chart Window: Choose whether the new chart replaces the current window or opens in a separate one.
3- Adjust Broker Timezone (true/false): Specify whether to align your chart's timezone with your broker's server time or to set a different timezone for your analysis.
4- New Timezone Offset: Specify the desired GMT offset for your chart by entering a value such as 1, 2, 3, -1, -2, -3, or even decimal values like 1.2 or 3.4. This flexibility allows you to set a custom timezone that may not correspond to any specific country's standard time.
5- Display Remaining Time on Chart (true/false): Choose whether to display the time remaining until the current candle closes directly on the chart.
6- Text Placement, Font, and Color: Configure the display properties of the remaining time shown on the chart by specifying its position, font type, and color to suit your preferences.
7- Number of Previous Days Displayed on New Chart: Specify the amount of historical price data, in days, to display on the new chart. Selecting a higher number may increase the time required to retrieve tick data from the broker and load the chart.
For reporting bugs, suggesting improvements, or requesting personalized services related to this Expert Advisor (EA), please feel free to contact me.
#4