Forecast System

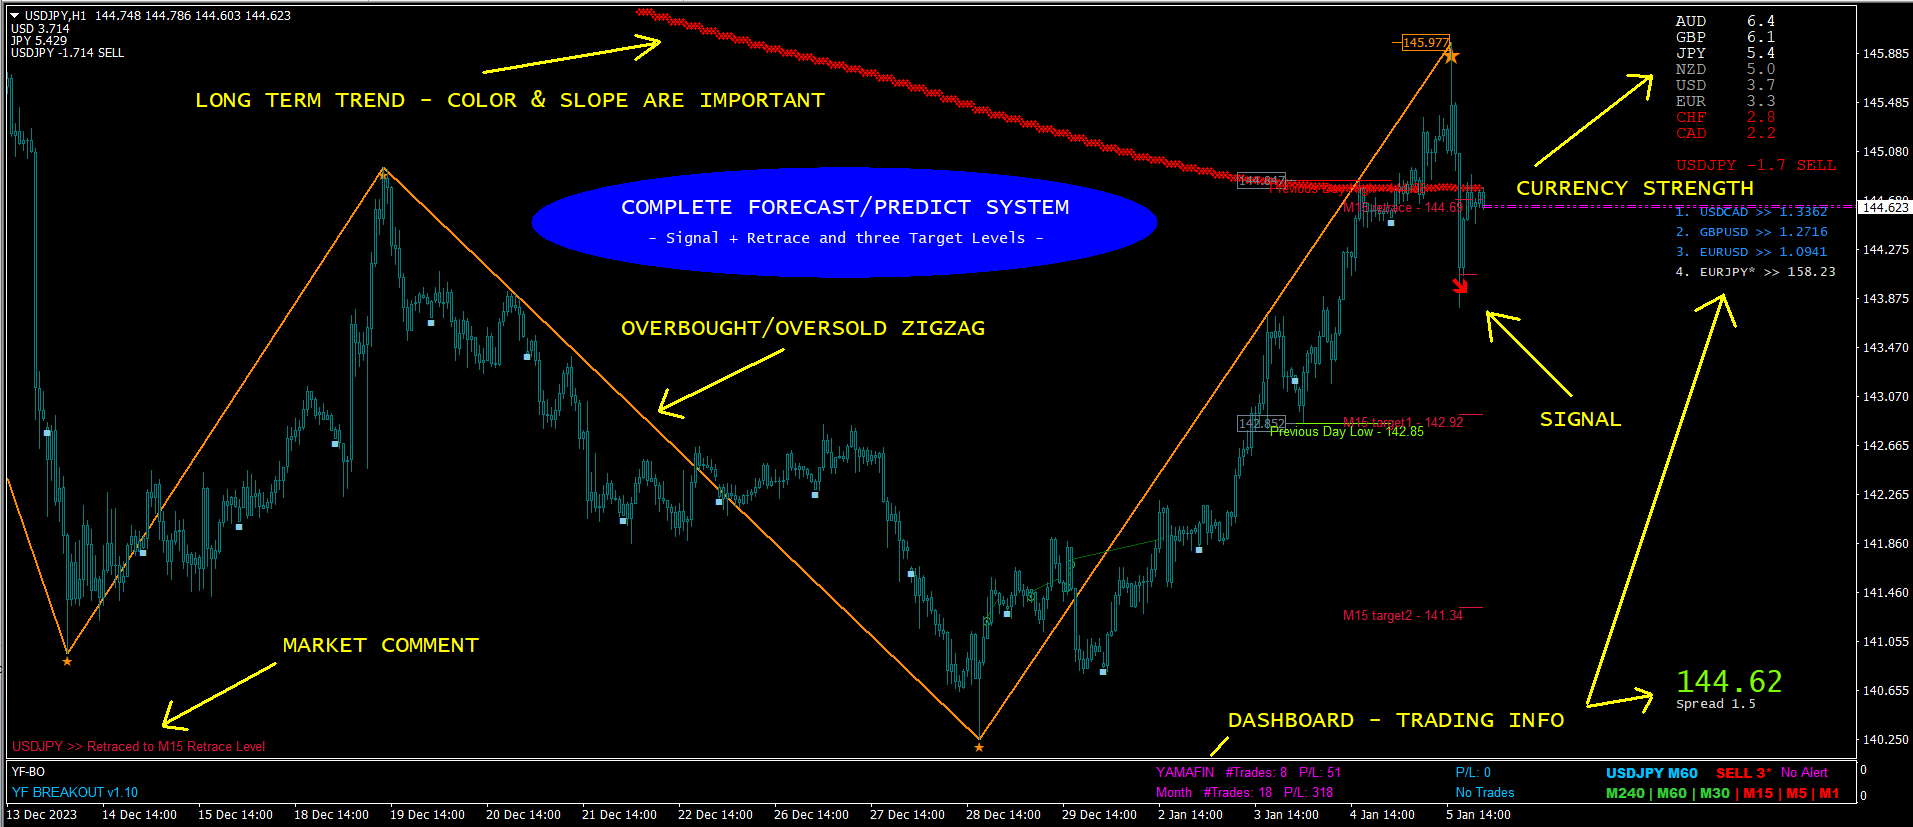
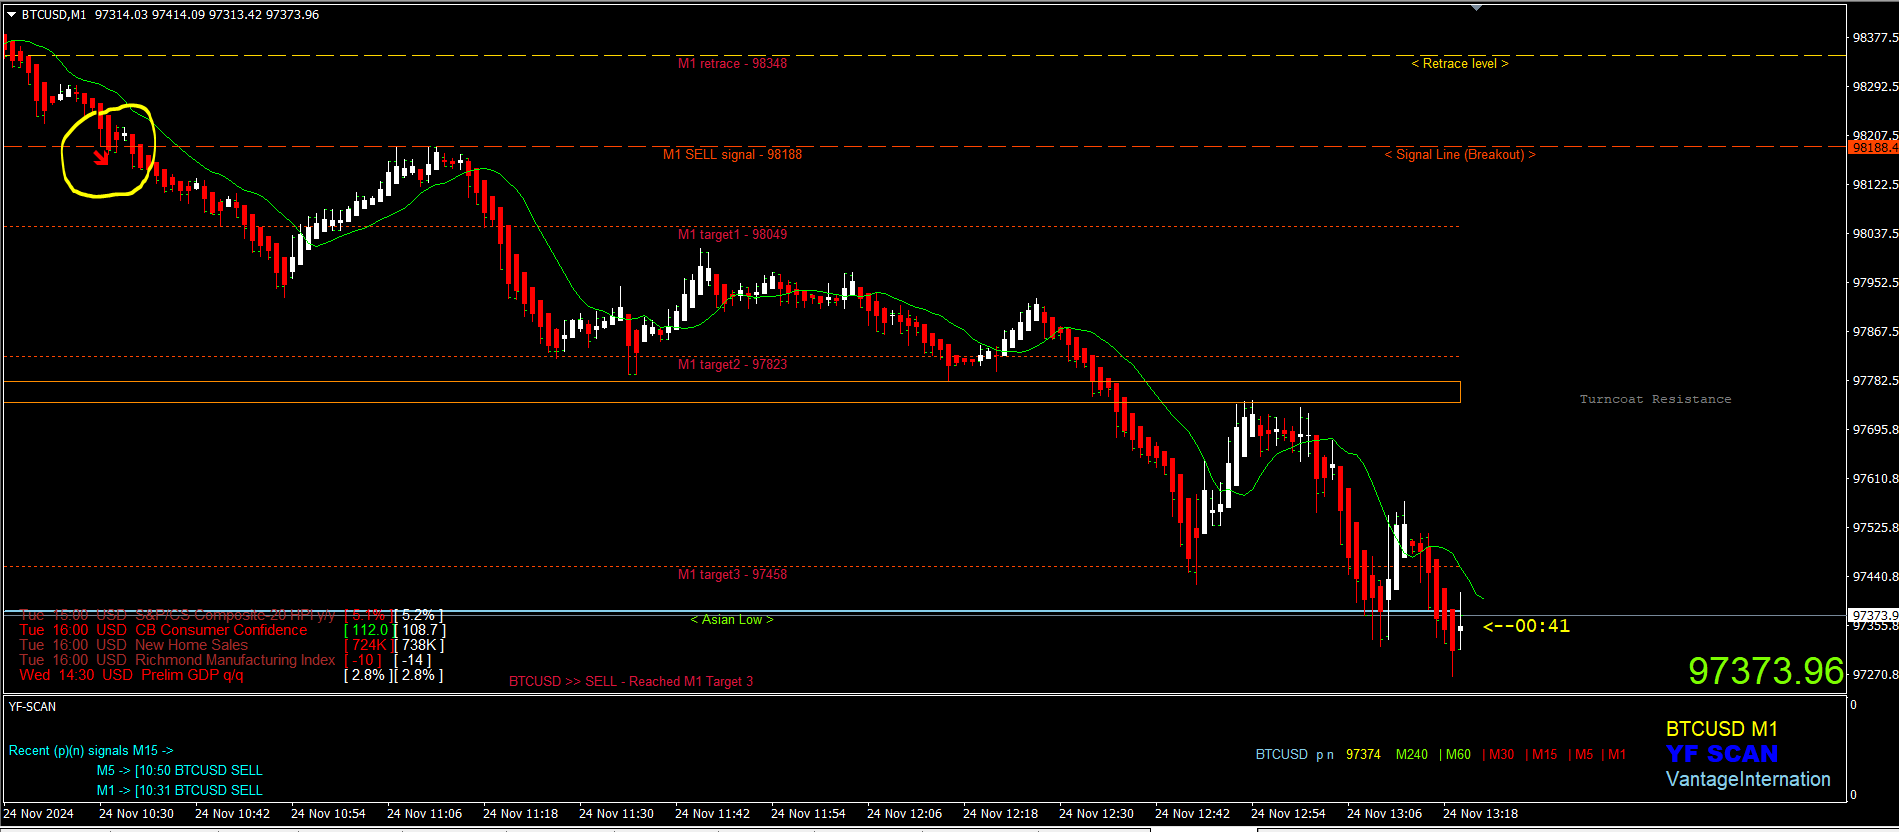
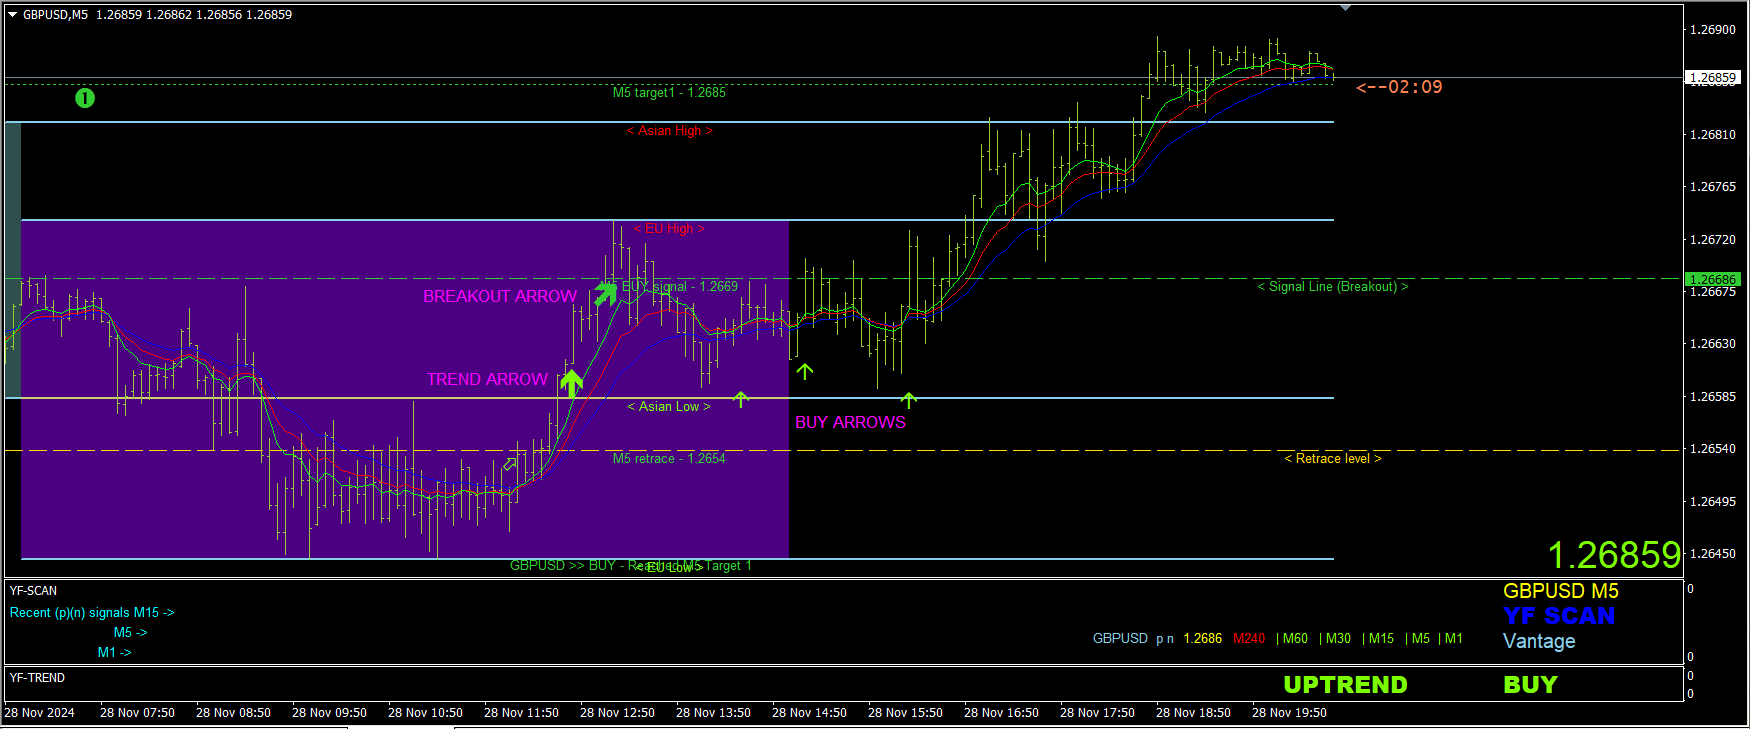
Questa è una strategia semplice basata sui livelli BREAKOUT e FIBONACCI.

Dopo uno scoppio,

in ogni caso, il mercato continua il movimento direttamente ai livelli 161, 261 e 423

oppure, ritorna al livello del 50% (chiamato anche correzione) e successivamente molto probabilmente continua il movimento nella direzione iniziale verso i livelli 161, 261 e 423.

La chiave del sistema è il rilevamento della breakout bar indicata con un oggetto rettangolare verde (UP TREND) o rosso (DOWN TREND).

Al momento del breakout, i livelli target di Fibonacci vengono calcolati e disegnati sul grafico.

Funziona per ogni coppia forex e periodo di tempo (periodo).

Include avvisi pop-up e notifiche mql5.

Per favore mandami un messaggio privato per qualsiasi domanda, guida aggiuntiva e indicatori extra che utilizzo (tuttavia non necessari).

Buon trading a te!
Prodotti consigliati
User Manual Download link: https://ontrd.com/our-books/ For all who are asking about indicator  ON Trade Numerology Station It obtain about 16 numerology strategies it make together completed unit control your trading . Basic strategies to work with it are 3 strategies statistics about them are the following : 1. RBA levels success rate more then 95%. 2. FF more then 96%  3.RBA SUN 98% We will not say 100 % as they are .. Ratio rates as following :  1.Rba levels more then 1/3 to 1/6 . 2.FF MORE
This is a trend scanner that uses the Forecast System technology. Link to the FREE version of the   Forecast System  -->  https://www.mql5.com/en/market/product/110085?source=Site It scans up to 30 pairs for having an oversight of trending pairs and reversals. With this system you make every day about 10 profitable trades. The scanning comes with popup alert feature and mobile phone notifications. The scanner is free of charge for those who bought or rented the Forecast System. Please contact me
DMS Fibo
Diogo Mitsunaga Dos Santos
Fibonacci retracements are trend lines drawn between two significant points, usually between absolute lows and absolute highs, plotted on a chart. Intersecting horizontal lines are placed at the Fibonacci levels. Fibonacci retracements are useful tools that help traders identify support and resistance levels. With the information gathered, they can place orders, identify stop-loss levels, and set price targets. Although useful, traders often use other indicators to make more accurate assessments
Galactic Volume spread analysis (VSA), is an indicator designed for the visualization of the Volume, and the proportion in which it affects the volatility of the spread of the different pairs. The strategy consists of the following: Bull Trend: Always going in favor of the trend, open buying operations at the lows of the trend, provided that it coincides with a high volume shown by the Galactic VSA indicator. Downtrend: Always going in favor of the trend, open sales operations at the highs of
Turn Every Market Reversal Into a Money-Making Opportunity With the U-turn Detector Indicator! Imagine having a tool that visually reveals the exact moment price is about to flip — before the crowd catches on. The U-turn Detector isn’t just another indicator... it's your edge in spotting clean, confident entries and exits in forex. If you've ever been frustrated by fake breakouts, late signals, or messy charts — you're about to fall in love with this tool. URGENT REMINDER: PRICE MAY DOUBLE
YK-Fibo Pivot Indicator: Trade Smarter with Fibonacci Pivot Points The YK-Fibo Pivot Indicator is a powerful technical analysis tool that combines the precision of Fibonacci retracements with the insights of Pivot Points. Whether you're a novice or seasoned trader, this indicator empowers you to spot profitable opportunities in the market with ease. Why Choose YK-Fibo Pivot? Pinpoint Support & Resistance: By calculating Fibonacci levels based on the previous day's high, low, and close prices, y
This indicator is designed for scalping on low timeframes (M1-M15) in volatile markets like major forex pairs (e.g., EURUSD, GBPUSD). It generates non-repainting buy (green up arrow) and sell (red down arrow) signals based on EMA crossover confirmed by RSI momentum and MACD crossovers, minimizing false signals in ranging markets. How to Use: Attach the indicator to your MT4 chart. Look for arrows on the chart: Buy on green up arrow, Sell on red down arrow. Signals appear at the open of the new
This is an arrow indicator without a future function,developed based on the most advanced profit trading algorithms.It has the most innovative and advanced dual trend analysis module, as well as the latest and highly effective market trend prediction algorithm.Trends are your friends, and following larger trends can earn the maximum profit in foreign exchange. This indicator helps traders identify current trends and track them. Someone once made a profit of 10 times in a week by relying on it.No
Questo indicatore funziona con la teoria delle onde di Elliott in due modi: Modalità automatica: In questa modalità, l'indicatore rileverà automaticamente le cinque onde motrici sul grafico in conformità alla teoria delle onde di Elliott. Fornirà previsioni e individuerà potenziali zone di inversione. Inoltre, avrà la capacità di generare avvisi e messaggi push per informare i trader sugli sviluppi importanti. Questa funzionalità automatica semplifica il processo di identificazione e analisi dei
DualVWAP
Kourosh Hossein Davallou
Dual Timeframe VWAP Indicator for MT4  Description Professional VWAP indicator that displays both **Daily** and **Weekly** VWAP simultaneously on your chart.   Features: - Dual VWAP Lines: Blue for Daily, Red for Weekly - Configurable Bands: Two deviation bands for each timeframe - Session Control: Customizable trading hours for Daily VWAP - Clean Visuals: Solid lines for main VWAP, dashed for bands - Optimizable: Parameters can be optimized using Genetic Algorithm Key Settings: - Enable/di
Ticks Size
Viktor Kolmakov
This indicator displays in a separate window the difference between the number of points which increased the price, and the number of points that decreased the price during the time interval specified in the settings. The time interval for calculation is expressed as the number of bars of the chart the indicator is attached to. This approach allows you to evaluate the movement direction (growth or fall) of the instrument's price, the strength of the movement and the size of the movement in point
Classic Fractals indicator for MT4, with additional Trendlines connecting the latest couples of fractals ( fractals are showing highest high, and lowest low on each period) Rules for trendlines: -if new top fractal is below the last one = new resistance line -if new bot fractal is above the last one = new support line -Trendlines can be hidden -Fractals can be hidden Fractal Period = can be both even or uneven number, as it is setting for half (one side) of the bars sequence for findin
Fibonacci Wave Bands Indicator The Fibonacci Wave Bands indicator utilizes Fibonacci ratios to create dynamic bands around a central moving average. These bands are derived from key Fibonacci ratios (typically 38.2%, 50%, 61.8%) and adapt to market volatility, offering insights into potential support and resistance zones. Key Features: Fibonacci Levels: The indicator plots multiple bands above and below a central moving average based on Fibonacci ratios. Dynamic Support and Resistance: Bands ser
MultiFiboDynamicMT4 is a powerful, professional indicator for estimating the most important support and resistance levels. The main advantage is that it plots the Fibonacci levels at all timeframes simultaneously, which allows the trader to see the full picture of the possible price movement of the trading instrument! Advantages of the indicator The indicator is perfect for scalping and trading binary options. Suitable for beginners and experienced traders. Works on all timeframes. Works on any
FREE
The Arrow Scalper
Fawwaz Abdulmantaser Salim Albaker
1 (2)
Dear Friend..  I share with you this simple Expert Adviser .. it is full automatic  this Expert Adviser following the trend of the pair you install on or any stocks or indices , it is works like that: - when the trend on H4 chart show a start of up trend the expert will wait till the 15M & 1H charts show an up trend the EA will open a buy order directly , and do the same for down trend and open a sell order the buy or sell  order lot size and take profit and stop loss will measured manually  by
FREE
BONUS INDICATOR HERE :  https://linktr.ee/ARFXTools BBMA Fibo Musang Alert Trend Scanner Smart Indicator Powered by 3 Proven Trading Systems – All in One! Take your trading to the next level with this intelligent indicator that combines three of the most powerful and time-tested strategies in the market: BBMA Oma Ally – Your main reference for trend direction & market mapping Fibo Musang CBR – Automatically alerts you on key breakout opportunities Multi Trend Scanner – Fully custom
Introduction It is common practice for professional trades to hide their stop loss / take profit from their brokers. Either from keeping their strategy to the themselves or from the fear that their broker works against them. Using this indicator, the stop loss / take profit points will be drawn on the product chart using the bid price. So, you can see exactly when the price is hit and close it manually.  Usage Once attached to the chart, the indicator scans the open orders to attach lines for t
Tract
Andriy Sydoruk
Tract - Channel indicator, by which you can place orders like a classic channel indicator. Trading can be carried out inside the channel when the price reaches its borders and turns in the opposite direction from them. In such cases, reversal strategies are used. The channel indicator is designed to work with support and resistance levels and help traders find opportunities to enter the market. Another way to trade a breakout - assumes a situation when the price, upon reaching one or another cha
Binary Scalper 6 – Potente indicatore per opzioni binarie su MT4 Binary Scalper 6 è uno strumento avanzato per l'analisi delle tendenze e il trading di opzioni binarie su MetaTrader 4 (MT4) . Ideale per trader di tutti i livelli, fornisce segnali chiari e statistiche dettagliate. Caratteristiche principali: Rilevamento delle tendenze : Identifica con precisione i mercati in tendenza. Compatibile con qualsiasi coppia di valute : Flessibilità per operare sui tuoi mercati preferiti. Funziona su qu
Free automatic Fibonacci is an indicator that automatically plots a Fibonacci retracement based on the number of bars you select on the BarsToScan setting in the indicator. The Fibonacci is automatically updated in real time as new highest and lowest values appears amongst the selected bars. You can select which level values to be displayed in the indicator settings. You can also select the color of the levels thus enabling the trader to be able to attach the indicator several times with differe
FREE
EARLY REMINDER: The Starting price is 65 price will rise soon up to 365$ and then 750$ after first 10 copies of sales. Grab this offer now! Introduction Hello, traders! Welcome to the demonstration of the Forex Beast Indicator , a comprehensive tool designed to assist aspiring traders in navigating the complexities of the forex market. This indicator incorporates seven essential components to provide a well-rounded trading experience: Moving Averages Colored Zones Support and Resistance Levels
Questo indicatore rileverà i pattern armonici disegnati sul grafico tramite metodi manuali e automatici. Aggiungi la tua recensione, per favore. Note: Questo indicatore ha un pannello di controllo e salverà ogni impostazione (grafico e timeframe). Puoi ridurlo per avere più spazio sul grafico e puoi premere il pulsante di chiusura per nascondere tutti i dati dell'indicatore sul grafico se preferisci lavorare con altri strumenti di analisi. Quando utilizzi questo indicatore e modifichi le imposta
Auto AndrewFork
Noor Ghani Rahman
1 (1)
Auto Pitchfork Indicator The indicator calculate the Pitch fork for the previous Day (Selectable) with multiple Support and Resistance lines from the Median price which acts as Magnet for the Price that if price touch the above warning (1) or below warning (1) lines and not cross up or down then there is maximum possibilities that it will return to the Median Line, and thus maintain the Price Action in Cyclic Pattern to the Market Move. You are able to select how many warning lines you want to k
Pirate
Anatoliy Lukanin
3.9 (20)
Deposit :   from 100 deposit units Trading pairs: I recommend currency pairs: EURAUD, CHFJPY, EURCHF, EURGBP, AUDCHF, CADCHF, USDCHF. Trading period :  Any Account: You should use ECN-ECN.Pro accounts with five-digit quotes with a moderate size (spread). Parameters: USING - Choice, trading risk or fixed lot RISK/LOT - Lot Risk Value RESTORING_THE_BALANCE - Restoring balance* HOW_THE_RESET_WINDOW - Reset the Global Variable TAKE_PROFIT - Set profit STOP_LOSS - Set loss COUNT_BUY - The number of s
Embark on the pinnacle of Binary Options evolution. Our indicator isn't just adaptive—it's relentless. Picture a ninja riding a serpent, shadowing its every move; that's how this tool trails the market trend, unwavering till the end. Built upon the foundational prowess of the Ichimoku indicator and honed with an array of fine-tuned oscillators, it epitomizes accuracy and precision. Dive deep without getting lost in the Ichimoku's intricacies—our indicator simplifies the process for you. Perhaps
Real Super Trend ORM
Hassan Amundsen
5 (1)
The ORM indicator is very effective in identifying changing trends, breakouts, and trading opportunities in Forex, Stocks, and commodities. It gives at a glance a clear picture of the marked. ORM makes it easy to see the beginning of a trend, the end of a trend, and when there is a consolidation period. ORM identifies three groups of traders: The blue belt is the day traders, the green belt is the swing traders, the red belt is traders that hold their position for a longer period of time. When t
VR Cub
Vladimir Pastushak
VR Cub è un indicatore per ottenere punti di ingresso di alta qualità. L'indicatore è stato sviluppato per facilitare i calcoli matematici e semplificare la ricerca dei punti di ingresso in una posizione. La strategia di trading per la quale è stato scritto l'indicatore ha dimostrato la sua efficacia per molti anni. La semplicità della strategia di trading è il suo grande vantaggio, che consente anche ai trader alle prime armi di commerciare con successo con essa. VR Cub calcola i punti di apert
Launch promotion For a limited time only:  30$ instead of 157$ Summary Shows multiple Fibonacci retracements, projections and expansions ratios at a glance Description A Fibonacci confluence level is a price zone where Fibonacci retracements, projections and expansions meet closely when measuring a swing This technique is used by  intermediate and advanced traders to detect possible reversal zones Tired of manually drawing the same Fibonacci ratios for the same X, A, B, C points to eventually f
Binary Options Support Resistance Indicator This indicator is designed for binary options trading and effectively shows retracements from support and resistance levels. Signals appear on the current candle. A red arrow pointing downwards indicates a potential selling opportunity, while a blue arrow pointing upwards suggests buying opportunities. All that needs adjustment is the color of the signal arrows. It is recommended to use it on the M1-M5 timeframes as signals are frequent on these timef
R Factor EA
Raphael Minato
4.7 (40)
R FACTOR Multi Strategy Expert Advisor with Proprietary Dynamic Portfolio Management System After 4 years of development and more than    3    years  of real positive results , R Factor is available for MQL5 community! It has always been important for us that the strategies performed positively for the creator before it could be shared.     Skin In The Game  is essential to demonstrate the belief in the strategy and also to provide a continuous improvement of it. Anyone who has been in this ma
Gli utenti di questo prodotto hanno anche acquistato
Presentiamo l'Indicatore F-16 Plane, uno strumento all'avanguardia per MT4 progettato per rivoluzionare la tua esperienza di trading. Ispirato alla velocità e alla precisione imbattibili dell'aereo da combattimento F-16, questo indicatore combina algoritmi avanzati e tecnologia all'avanguardia per offrire prestazioni senza precedenti sui mercati finanziari. Con l'Indicatore F-16 Plane, volerai al di sopra della concorrenza poiché fornisce analisi in tempo reale e genera segnali di trading estrem
Meravith
Ivan Stefanov
5 (1)
L'indicatore analizza il volume da ogni punto e calcola i livelli di esaurimento del mercato per quel volume. È composto da tre linee: Linea di esaurimento del volume rialzista Linea di esaurimento del volume ribassista Una linea che indica la tendenza del mercato. Questa linea cambia colore per riflettere se il mercato è rialzista o ribassista. Puoi analizzare il mercato da qualsiasi punto di partenza tu scelga. Una volta che una linea di esaurimento del volume è raggiunta, identifica un nuovo
BinaryIndicator
Andrey Spiridonov
BinaryIndicator is a highly accurate indicator for trading binary options. It shows excellent results in scalping. This indicator is based in multifactor analysis of trend indicators, as well as confirmation oscillators, which in the end gives an increased accuracy of signals. Advantages of the indicator Increased accuracy of signals. Excellent results when trading binary options with a short expiration time from M30 to M1 . It works on any timeframes. Works with any trade symbols. Parameters
SHOGUN Trade [Concept: Command the Market Structure] To win a war, one must see the entire battlefield, not just the skirmishes. SHOGUN Trade elevates your perspective from a reactive foot soldier to a strategic "Commander." By synchronizing analysis across 7 timeframes and identifying the maturity of trends, it allows you to govern your trades with the authority and patience of a "Shogun," entering the market only when the structural advantage is undeniable. 5 Strategic Benefits of Installi
L'indicatore " Dynamic Scalper System " è progettato per il metodo di scalping, ovvero per il trading all'interno di onde di trend. Testato sulle principali coppie di valute e sull'oro, è compatibile con altri strumenti di trading. Fornisce segnali per l'apertura di posizioni a breve termine lungo il trend, con ulteriore supporto al movimento dei prezzi. Il principio dell'indicatore. Le frecce grandi determinano la direzione del trend. Un algoritmo per generare segnali per lo scalping sotto fo
OrderFlow Absorption – Indicatore professionale di Delta e Segnali di Assorbimento per MT4 Sblocca la potenza della vera analisi del flusso degli ordini con OrderFlow Absorption – l’indicatore definitivo di istogramma delta e segnali di assorbimento per MetaTrader 4. Progettato per i trader che vogliono vedere cosa succede davvero dietro ogni movimento di prezzo, questo strumento rivela la pressione nascosta di acquisto/vendita e gli eventi di assorbimento che muovono il mercato. Caratteristiche
Il sistema di trading tecnico delle frecce BB è stato sviluppato per prevedere punti inversi per prendere decisioni al dettaglio. L'attuale situazione di mercato è analizzata dall'indicatore e strutturata per diversi criteri: l'aspettativa di momenti di inversione, potenziali punti di svolta, segnali di acquisto e vendita. L'indicatore non contiene informazioni in eccesso, ha un'interfaccia comprensibile visiva, che consente ai trader di prendere decisioni ragionevoli. Tutte le frecce sembrano
"Dragon's Tail" is an integrated trading system, not just an indicator. This system analyzes each candle on a minute-by-minute basis, which is particularly effective in high market volatility conditions. The "Dragon's Tail" system identifies key market moments referred to as "bull and bear battles". Based on these "battles", the system gives trade direction recommendations. In the case of an arrow appearing on the chart, this signals the possibility of opening two trades in the indicated directi
The Nihilist 5.0 Indicator includes Forexalien and Nihilist Easy Trend trading strategies and systems. It is composed of an MTF Dashboard where you can analyze the different input possibilities of each strategy at a glance. It has an alert system with different types of configurable filters. You can also configure which TF you want to be notified on your Metatrader 4 platform and Mobile application The indicator has the option to view how could be a TP and SL by using ATR or fixed points, even w
「New Release Special Offer」 [Concept: Return to the Truth] Many traders get lost in a forest of complex algorithms and forget the fundamental truth: Price is King. The Authentic Price Action Dashboard was developed to end the "Search for the Holy Grail" and bring traders back to the universal principles of Dow Theory and Candlestick Analysis. It is not just a tool, but a discipline enforcer that creates an environment where you only trade when the "Truth" of the market aligns. Special Launch Off
BinaryUniversal
Andrey Spiridonov
BinaryUniversal is a signal indicator for binary options and Forex. In its work, the indicator uses a complex algorithm for generating signals. Before forming a signal, the indicator analyzes volatility, candlestick patterns, important support and resistance levels. The indicator has the ability to adjust the accuracy of the signals, which makes it possible to apply this indicator for both aggressive and conservative trading. The indicator is set in the usual way, it works on any time period and
Delta Swing Pro  [Concept: Synchronization of the Waves] The greatest enemy in trading is the "contradiction" between timeframes. The 5-minute chart says Buy, but the 1-hour chart says Sell. Many traders get lost in this noise. Delta Swing Pro is designed to "Synchronize" the vectors of different timeframes. It identifies the precise moments when all market waves align in the same direction, providing a clear, hesitation-free environment for execution. 5 Core Benefits of Installing Delta Swing
Gold Channel is a volatility-based indicator, developed with a specific timing algorithm for the XAUUSD pair, which consists of finding possible corrections in the market. This indicator shows two outer lines, an inner line (retracement line) and an arrow sign, where the theory of the channel is to help identify overbought and oversold conditions in the market. The market price will generally fall between the boundaries of the channel. If prices touch or move outside the channel it is a tradi
This indicator is a multifunctional technical analysis tool based on the combination of an adaptive exponential moving average and volatility filters calculated through the Average True Range (ATR). It is designed to accurately identify the current price direction, highlight key trend reversal areas, and visualize potential turning zones. The algorithm is built upon the dynamic construction of a trend ribbon using two levels of volatility — outer and inner ranges. The outer boundaries serve as i
#EasyWayTradePanel indicator for #MetaTrader4 , is trade assistants for manual trading in any #currency in #FOREX , #CRYPTOCURRENCY as #Bitcoin , #Ethereum , #Lightcoin and more. Also is EasyWay to use for #COMMODITY as #Gold , #Silver , #Oil , #Gas ...... and #CFDs . When installed on the chart in your chosen time frame and trading tool, the indicator automatically draws the following custom indicators used in the EasyWayTradePanel trading strategy. 1) Zigzag_Extreme_Indicator, 2) Regression_C
ECM Elite Channel is a volatility-based indicator, developed with a specific time algorithm, which consists of finding possible corrections in the market. This indicator shows two outer lines, an inner line (retracement line) and an arrow sign, where the channel theory is to help identify overbought and oversold conditions in the market. The market price will generally fall between the boundaries of the channel. If prices touch or move outside the channel, it's a trading opportunity. The ind
Rtc ML Ai Predictor MT4
Muhammad Faisal Sagala
Rtc ML Ai | Predictor CORE MACHINE LEARNING ENGINE Adaptive ML Market Predictor – Multi-Bar Trend & Candle Forecast What This Indicator Does This indicator is a  real-time market prediction engine  designed to analyze price behavior and estimate  future market tendencies . Unlike conventional indicators, this system  does not rely on static parameters or historical curve-fitting , but adapts its internal state dynamically during live market operation. Instead of using static rules, the indic
Gold Titan King Scalper
Dodong Christian Arnon
Indicator Description GOLD TITAN KING SIGNAL INDICATOR High-Precision Gold Scalping Buy/Sell Signals – Manual Trading Assistant Overview The Gold Titan King Signal Indicator is a manual trading assistant tool designed for high-frequency scalping on Gold (XAUUSD) and other major pairs. It generates clear BUY/SELL signals with precise entry levels, along with adjustable Stop Loss and Take Profit levels displayed directly on the chart. ️ This tool is NOT an EA. It does not execute trades
Algo Trading Indicaor  With this indicator , you’ll have zones and trends that hight probability the price will reverse from it. so will gives you all the help that you need  Why should you join us !?  1-This indicator is logical since it’s working in previous days movement , to predict the future movements. 2-Algo trading indicator will help you to draw trends which is special and are too strong than the basics trend , trends will change with the frame time that you work on . 3-We can use
How to use Pair Trading Station Pair Trading Station is recommended for H1 time frame and you can use it for any currency pairs. To generate buy and sell signal, follow few steps below to apply Pair Trading Station to your MetaTrader terminal. When you load Pair Trading Station on your chart, Pair Trading station will assess available historical data in your MetaTrader platforms for each currency pair. On your chart, the amount of historical data available will be displayed for each currency pai
Oracle flow
Adolfina Denysenko
Purpose of the indicator: Oracle Flow is designed to identify BUY/SELL market entry points using a combination of technical indicators and filters. The indicator displays arrows on the chart to signal possible trend reversals or continuations. Main elements used: Exponential moving averages (EMAs) – two periods are used: Faster and Slower. These are used to identify crossovers that confirm the strength of the movement. RSI (Relative Strength Index): – assesses the strength of the trend.
FFx Engulfing Setup Alerter gives trade suggestions with Entry, Target 1, Target 2 and StopLoss. Below are the different options available: Entry suggestion - pips to be added over the break for the entry 3 different options to calculate the SL - by pips, by ATR multiplier or at the pattern High/Low 3 different options to calculate the 2 TPs - by pips, by ATR multiplier or at Risk/Reward Offset the dashboard - any place on the chart Remove the suggestion once the price reached the SL line Lines
FFx InsideBar Setup Alerter gives trade suggestions with Entry, Target 1, Target 2 and StopLoss. Below are the different options available: Entry suggestion - pips to be added over the break for the entry Minimum candle size - to avoid too close buy/sell entry suggestions 3 different options to calculate the SL - by pips, by ATR multiplier or at the pattern High/Low 3 different options to calculate the 2 TPs - by pips, by ATR multiplier or at Risk/Reward Offset the dashboard - any place on the c
FFx OutsideBar Setup Alerter gives trade suggestions with Entry, Target 1, Target 2 and StopLoss. Below are the different options available: Entry suggestion - pips to be added over the break for the entry. 3 different options to calculate the SL - by pips, by ATR multiplier or at the pattern High/Low. 3 different options to calculate the 2 TPs - by pips, by ATR multiplier or at Risk/Reward. Offset the dashboard - any place on the chart. Remove the suggestion once the price reached the SL line.
FFx PinBar Setup Alerter gives trade suggestions with Entry, Target 1, Target 2 and StopLoss. Below are the different options available: Entry suggestion - pips to be added over the break for the entry Minimum candle size - to avoid too small candles 3 different options to calculate the SL - by pips, by ATR multiplier or at the pattern High/Low 3 different options to calculate the 2 TPs - by pips, by ATR multiplier or at Risk/Reward Offset the dashboard - any place on the chart Remove the sugges
Automatic, live & interactive picture of all trendlines. Assign push, email and sound alerts to the lines of your choice and be informed about price rollback, breakout, rollback after breakout, number of rollbacks, line expiration by double breakout. Correct, drag or delete the lines and interactively tune the line system. https://youtu.be/EJUo9pYiHFA . Chart examples https: //www.mql5.com/en/users/efficientforex Price Interaction Events All events are effective immediately and only after one
Adaptive Stochastic
Rasoul Mojtahedzadeh
Stochastic Oscillator is one of the most popular and accurate oscillators widely used by traders to capture overbought and oversold areas of price action. Although the Stochastic indicator works fine for an interval of the market, it fails to generate profitable signals when the market conditions change, and hence it produces wrong signals resulting in big losses. Have you ever thought about an adaptive Stochastic indicator that adapts its period of calculation based on the market conditions? Th
The purpose of this new version of the MT4 standard indicator provided in your platform is to display in a sub-window multiple timeframes of the same indicator with its divergences. See the example shown in the picture below. But the display isn't like a simple MTF indicator. This is the real display of the indicator on its timeframe. Here's the options available in the FFx divergences indicator: Select the timeframes to be displayed (M1 to Monthly) Define the width (number of bars) for each tim
Altri dall’autore
+++++++++++++++++++++++++++++++++++++++++++++++++++++++++++++++++++++++++++++++++++++++++++++++++ +++ Link to EURUSD Only Free Version -->  https://www.mql5.com/en/market/product/156904?source=Unknown +++++++++++++++++++++++++++++++++++++++++++++++++++++++++++++++++++++++++++++++++++++++++++++++++ Hallo Trader, This is a traditional GANN & FIBONACCI strategy based on detection of an impulsive move in the opposite direction. This is called a Breakout. At the moment of Breakout, the indicator draw
Optimal Entry
Peter Maggen
5 (1)
Hi Trader, ================================================================================ If you like my indicator, please do not hesitate to give a review and/or comment. Thank you! ================================================================================ This indicator draws trade entry zone and target levels based on the levels of the previous day. A blue zone (BUY) or red zone (SELL) is drawn and two targets. The optimal trade entry value is also indicated. A second gray zone is
FREE
+++++++++++++++++++++++++++++ +++ FREE VERSION - EURUSD ONLY +++++++++++++++++++++++++++++ Please add PREFIX and/or SUFFIX via settings if your Broker Chart Symbol is different (e.g. suffix = .r). +++ This is forecast system. On the moment of the breakout/forecast: the indicator draws retrace zone (yellow) and three targets. The levels act as support and resistance. It can be used on all pairs/indices/timeframes/periods. For the higher timeframes (H4, H1, M30) it's better to engage at Optima
FREE
+++++++++++++++++++++++++++++++++++++++++++++++++++++++++++++++++++++++++++++++++++++++++++++++++++++++ +++ Link to EURUSD Only Free Version -->  https://www.mql5.com/en/market/product/156904 +++ Full License -->  https://www.mql5.com/en/market/product/156842 +++++++++++++++++++++++++++++++++++++++++++++++++++++++++++++++++++++++++++++++++++++++++++++++++++++++ +++ XMAS SALE +++ Get this indicator for free when renting the Forecast System Full License  (one license for one account)   +++ Please
++++++++++++++++++++++++++++++++++ +++ Trend Tool ++++++++++++++++++++++++++++++++++ Hallo Trader, This is a trend tool that I use... based on four moving averages. Price below or above the EMA200 is indication for the long term trend. Also the direction of the slope counts. You can customise in settings if you want. The tool is aligned with my Forecast System and the Bounce Zones. - Forecast System --> https://www.mql5.com/en/market/product/156904 - Bounce Zones -->  https://www.mql5.com/en/mar
FREE
--- FREE VERSION - WORKS ONY ON EURUSD ------------------------------------------------------------------- This is a unique breakout strategy that is used for determination of the next short term trend/move. The full system is available on MQL5 under the name "Forecast System". Here is the link -->  https://www.mql5.com/en/market/product/104166?source=Site Backtest is not possible, because calculations are done based on the data of all timeframes/periods. Therefore I propose you use the technolo
FREE
This is a trend scanner that uses the Forecast System technology. Link to the FREE version of the   Forecast System  -->  https://www.mql5.com/en/market/product/110085?source=Site It scans up to 30 pairs for having an oversight of trending pairs and reversals. With this system you make every day about 10 profitable trades. The scanning comes with popup alert feature and mobile phone notifications. The scanner is free of charge for those who bought or rented the Forecast System. Please contact me
Filtro:
Nessuna recensione
Rispondi alla recensione