Guarda i video tutorial del Market su YouTube
Come acquistare un Robot di Trading o un indicatore
Esegui il tuo EA
hosting virtuale
hosting virtuale
Prova un indicatore/robot di trading prima di acquistarlo
Vuoi guadagnare nel Market?
Come presentare un prodotto per venderlo con successo
Indicatori tecnici per MetaTrader 4 - 133

Indicatore che mostra tutta una serie di informazioni che il broker non mi dice cioè: volumi, swap, cioè quello che spendo ogni giorno per lasciarla aperta, poi si vede il pivot con un suggerimento sulla operazione e lo stop loss da adottare. Vediamo che con questo nuovo indicatore, quando il prezzo si avvicina alla linea di zero del trade, che viene suggerito in automatico, tendenzialmente con dei segnali a schermo di Price Action, siamo avvantaggiati perchè nella barra inferiore abbiamo indica
Il prodotto è stato convertito da un'altra piattaforma e creato in origine da TradeMaster Lite. L'indicatore utilizza fondamentalmente il concetto di MACD, ma rafforza le sue capacità con diversi tipi di tecniche di mediazione. È potente per l'identificazione di trend e inversioni.
Ecco alcuni dettagli forniti dal proprietario originale:
Presentiamo un indicatore MACD personalizzabile, con le seguenti caratteristiche: Multi-timeframe Bande di deviazione per individuare una volatilità insolit

Presentiamo l'indicatore Gold Massive Arrow, appositamente progettato per i trader dell'oro, sia a lungo termine che a breve termine. Questo strumento all'avanguardia fornisce segnali di trading ad alta probabilità senza la necessità di numerosi indicatori, semplificando la tua esperienza di trading nel dinamico mercato dell'oro.
Adatto a tutti gli stili di trader, questo indicatore di segnale di 15 minuti offre la possibilità per i trader sia a lungo termine che a breve termine di massimizzar

L'indicatore Accurate Gold è uno strumento user-friendly, intuitivo e facile da utilizzare, indipendentemente dal livello di esperienza dei trader. È progettato per i trader che cercano segnali precisi nel timeframe M5 nel mercato dell'oro. Questo indicatore utilizza algoritmi matematici avanzati per analizzare i movimenti dei prezzi e la dinamica dei volumi, generando segnali precisi di acquisto e vendita. Le caratteristiche distintive di questo indicatore, compresa la sua natura non ridipinta,

The Buyside & Sellside Liquidity indicator aims to detect & highlight the first and arguably most important concept within the ICT trading methodology, Liquidity levels. SETTINGS
Liquidity Levels
Detection Length: Lookback period
Margin: Sets margin/sensitivity for a liquidity level detection
Liquidity Zones
Buyside Liquidity Zones: Enables display of the buyside liquidity zones.
Margin: Sets margin/sensitivity for the liquidity zone boundaries.
Color: Color option for buysid
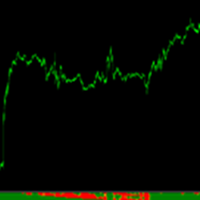
Power Real Trend es un indicador que no repinta y que muestra la dirección real que tiene el mercado, ofreciendo una clara manera de confirmar entradas. Es un indicador que para su constitución se realizan múltiples operaciones para formar los distintos rangos que se utilizan para su creación. Tiene un manejo muy sencillo dando sólo tres posibles valores (1,0,-1) altamente visual y de muy sencilla comprensión. La parte superior del mismo es la zona más sensible y la inferior corresponde a la te

Sei un investitore alla ricerca di opportunità a lungo termine nel mercato finanziario? Ti presento l'Indicatore Personalizzato a Lungo Termine. Questo indicatore è progettato per i trader che desiderano negoziare posizioni su intervalli temporali più lunghi rispetto a grafici giornalieri, settimanali e mensili. Con segnali chiari e precisi, avrai l'assistenza necessaria per prendere decisioni informate. Caratteristiche principali: Strategia a Lungo Termine: Questo indicatore è perfetto per gli

TMA - Indicatore della Media Mobile Triangolare L'indicatore TMA - Media Mobile Triangolare è uno strumento potente per i trader che cercano di analizzare e identificare le tendenze nei mercati finanziari. Questo indicatore calcola in modo intelligente le medie mobili triangolari, fornendo preziose intuizioni sulla direzione del mercato. Caratteristiche principali: Ideale per time frame più lunghi: Consigliato per l'uso su periodi superiori a D1/W1/MN, offrendo una visione completa delle tendenz

Fnix Ma a colori. Questo è un indicatore personalizzato progettato per aiutare i trader nell'identificazione delle tendenze nei mercati finanziari. Il MA - Master Trend Position Trade è uno strumento che calcola e visualizza medie mobili per agevolare l'analisi delle tendenze degli asset. Caratteristiche principali: Calcola medie mobili per l'identificazione delle tendenze. Consigliato per l'uso su intervalli temporali superiori a D1/W1/MN (Giornaliero/Settimanale/Mensile). Suggerisce l'uso di
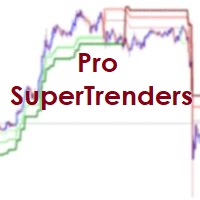
Dear traders! This indicator automatically plots SuperTrends across 3 timeframes. SuperTrend is a trend following indicator. However, it is not much useful on single timeframe, as that gives many whipsaws. Professionals analysis across multi timeframes before taking trades. This adds confluence to trade setups.For the same purpose, Pro SuperTrends shows trend (or absence of trend) on 3 timeframes. Our trading odds improve, when positions are aligned with higher timeframes. Further, SuperTren

The Book of Changes is a product of ancient civilization and a philosophical work that highly integrates natural and social sciences in China. The Book of Changes believes that all things in heaven and earth are constantly developing, and it explains the laws of nature. This law reveals the characteristics of the entire universe, covering the attributes of all things in heaven and earth. The Book of Changes is the crystallization of the wisdom of the Chinese nation. It is the crystallization of
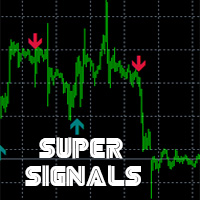
Indicador de Trading UltraPreciso para MetaTrader 4: "Mr Beast Signals no Repaint with alerts" Descubra la revolución en el análisis técnico con nuestro indicador Quantum Precision Pro diseñado para MetaTrader 4. Este avanzado indicador combina algoritmos de vanguardia con inteligencia artificial para ofrecer señales de compra y venta extremadamente precisas en tiempo real. Características destacadas: Precisión sin Igual: Nuestro algoritmo utiliza una combinación de análisis técnico y patrones d

The GGP Trendlines with Breaks Alert MT4 Indicator is a technical analysis tool that can assist investors in identifying market trends. The indicator returns pivot point based trendlines with highlighted breakouts. Users can control the steepness of the trendlines as well as their slope calculation method. This indicator is MT4 conversion of the Trendlines with Breaks Indicator by “ LuxAlgo “ in Trading View website and some alert methods are added to provide real-time alerts when a trading sign

The GGP Chandelier Exit Alert MT4 Indicator is a volatility-based indicator that identifies stop loss exit points for long and short trading positions. Chandelier Exit is based on the Average True Range (ATR) indicator. It is designed to keep traders in the trend until a defined trend reversal happens. Traders use CE to maximize their returns in a trade and make stop loss exit decisions. It is based on the principle that a trend reversal is highly probable when the price of an asset moves ag
RockTrader is an indicator that identifies market direction across chosen currency pairs and generates line signals for potential buy and sell opportunities within the selected timeframe. Its straightforward design makes it highly regarded and easily comprehensible for traders at basic and intermediate levels. The visual representation on the chart also enables users to conduct pure price action analysis. RockTrader is versatile, functioning across various financial assets, and boasts over an 85
The FX_ride custom indicator assists traders in recognizing market trends across preferred currency pairs and provides signals based on trend strength via a multi-colored histogram within chosen timeframes. It is particularly suited for day trading, swing trading, and position trading. Following signals from FX_ride in conjunction with employing sound money management practices can enhance the likelihood of profitable trading outcomes.

Gobbo è un indicatore professionale che evidenzia il trend del mercato con un aspetto grafico chiaro e comprensibile, è basato sulla Moving Average e può essere impostato su qualsiasi periodo di intervallo, di default impostato sul periodo 14, scegliendo un periodo più alto evidenzierà meno cambi di tendenza per un approccio sul medio o lungo periodo, con un periodo più basso più cambi di tendenza per un approccio sul breve termine L'aggiornamento e l'adattamento al time frame scelto avviene in
Vuoi migliorare davvero il tuo trading Forex? Allora AI Adaptive Scalper è esattamente ciò di cui hai bisogno. Questo indicatore di tendenza unico e innovativo è progettato specificamente per la coppia di valute EURUSD e l'intervallo temporale h1 per fornirti i segnali più accurati possibili.
AI Adaptive Scalper utilizza indicatori popolari come Stocastico, MACD, Ichimoku, Bollinger e ZigZag per scoprire punti di entrata e di uscita ottimali per le operazioni. Sarai in grado di identificare

If you are curious about the position of the stochastic, RSI, CCI curve, whether it is at the OBOS level or not, then this trading tool is for you. Introducing the advanced trading tools of 2024. ATF Trend Following Trend Bar OBOS. This indicator is similar to MTF PPAAF Model S but have two layers. Click here to learn more about MTF PPAAFS . This trading tool is equipped with various powerful features : MTF = Multi Time Frame = Time Frame can be changed. On/off button. Customizable parameter,

What if you could see trouble from far, just imagine having some ability to foresee danger. This indicator has the ability to see consolidations before they are clear to everyone else. In the market everything is always fun until the market starts consolidating and often times by the time people realise it it's often too late. This Indicator will spot consolidations very fast and let you know at the top right of the chart so that you can either avoid losses by stopping to trade using trend follo

BreakHarmony Multi-Timeframe Breakout Indicator for MT4
The BreakHarmony Multi-Timeframe Breakout Indicator for MT4 is a highly advanced tool providing information on breakout points across different timeframes, aiding traders in decision-making and understanding market movements. [ Features and Manual | MT5 version | All Products ] The indicator tracks breakout points on price charts across 6 timeframes. Breakout prices are indicated with the closing price of the corresponding candle

The Liquidation Estimates (Real-Time) experimental indicator attempts to highlight real-time long and short liquidations on all timeframes. Here with liquidations, we refer to the process of forcibly closing a trader's position in the market.
By analyzing liquidation data, traders can gauge market sentiment, identify potential support and resistance levels, identify potential trend reversals, and make informed decisions about entry and exit points.
USAGE (Img 1) Liquidation refers

The Swing Hit Perfect Master Indicator for MT4 displays accurate buy and sell signals on the chart and is no repaint and can be used on any pair, gold and indices. It's all in one the best indicator Swing and trend detection and is able to make precise entries. The indicator for MT4 points dots on the chart arrow after the swing high and low is maintained and takes perfect entries with the trend. The template shows the lows and highs of the market. They mark good entry and exit points. The blue

Vision è un indicatore professionale che legge i dati storici del periodo impostato e in base a tali elabora una previsione scrivendo l'andamento sul grafico, l'impatto visivo eccellente rende chiaro l'andamento del prossimo trend e mette a fuoco il prezzo d'ingresso il posizionamento di ordini e la distanza per SL e TP, di default è impostato con un rapporto bilanciato 24 a 24 ciò significa che in base alle ultime 24 candele prevederà scrivendo sul grafico l'andamento delle 24 candele successiv

The arrow indicator without redrawing shows potential entry points into the market in the form of arrows of the appropriate color: the up arrows (usually green) suggest opening a purchase, the red down arrows suggest selling. The appearance of arrows may be accompanied by beeps. It is usually assumed to enter at the next bar after the pointer, but there may be non-standard recommendations. Arrow indicators visually "unload" the price chart and save time for analysis: no signal – no deal, if ther
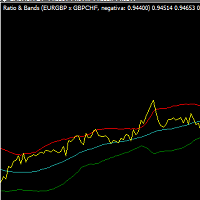
Hello everyone!
This incredible indicator for MT4 plataform calculates the ratio betwwen two symbols AND shows the bollinger bands for this ratio. It also considers if the two symbols have a positive or negative correlation for the calculations.
The result is a powerfull tool that brings very precious information to who that wants to trade in Forex based on correlation.
Enjoy!
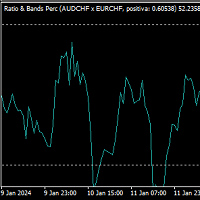
Hello everyone!
This incredible indicator for MT4 plataform calculates the ratio between two symbols, convert it into a percentual value and shows the result into a oscilation tunnel. It is derivated from the our other indicator (Ratio Bands). The basic diference is that instead of a bollinger bands, it uses a percentual oscillation that helps a lot during correlation trades.
It also considers if the two symbols have a positive or negative correlation for the calculations.
Good trades! Enjo

What if God Created a Trade System? No miracles... Just see how mathematics can be effective in the market. We managed to combine technical analysis / price action into indicators, creating the best setup for trading, be it in Forex, Indices, or stocks. It took us 2 years to create something that really works, and now it's time for you to discover it. TrendX3 is a revolution in trend analysis. Based on advanced algorithms and real-time data, it provides valuable insights so that you can make inf

Classic Fractals indicator for MT4, with additional Trendlines connecting the latest couples of fractals
( fractals are showing highest high, and lowest low on each period)
Rules for trendlines:
-if new top fractal is below the last one = new resistance line
-if new bot fractal is above the last one = new support line
-Trendlines can be hidden
-Fractals can be hidden
Fractal Period = can be both even or uneven number, as it is setting for half (one side) of the bars sequence for findin

Intro to APAMI, PROfessional edition Trace exactly how far prices trend between two price levels with fractional pip precision, while qualifying price movement between the same price levels.
Completely automate when trends change direction and volatility, without any lag . This is possible because the Accurate Price Action Measurement Indicator (APAMI) actually does what no other indicator can: measure price distance between two points and simultaneously qualify the price action that occurs

MCDX Pro is based on Buyer and Seller Volume analysis . Buyer also known as Banker is represented by GREEN BAR Seller also known as Retailer is represented by RED BAR The indicator is showing STACKED BAT representing BANKER (Green) and RETAILER (Red) activities Height of GREEN bar > 50% means Bull is in control while RED bar > 50% means Bear is in control. DARKER GREEN COLOR - STRONG BANKER - Active Buying Activity LIGHTER GREEN COLOR - STRONG Down - Weak Buying (Pullbac

Простой индикатор тренда в NRTR виде с отрисовкой линий стоплосса и тейпрофита, цвет и направление движения которых определяются действующим трендом. Индикатор имеет возможность подавать алерты, отправлять почтовые сообщения и push-сигналы при смене направления тренда. Следует учесть что значение входного параметра индикатора Deviation of the take profit line in points для каждого финансового актива на каждом таймфрейме необходимо подбирать индивидуально!
Enhance your trading strategy with this indicator from tr1cky.com . When the indicator turns red - Hold off When the indicator turns green - Proceed with the trade in the direction indicated by the indicator This indicator provides insights into the market’s momentum and the optimal trading direction. Derived from its successful Expert Advisor counterpart, the RSIMFI100 go indicator is now available. Happy trading!
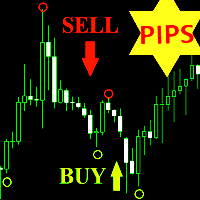
Pips Scalper Indicator - is a forex trading indicator specially designed for traders who are interested in scalping strategy. Scalping is a trading strategy in which a trader attempts to make a positive trade by snippets of small price movements. How to use the indicator? When the indicator draws a green circle on the chart of the currency pair, we open a buy deal and set a short TakeProfit of 20-25 points. In 87% of the signals, the price will go at least 20 pips in the direction of the arrow.

This is an arrow indicator without a future function,developed based on the most advanced profit trading algorithms.It has the most innovative and advanced dual trend analysis module, as well as the latest and highly effective market trend prediction algorithm.Trends are your friends, and following larger trends can earn the maximum profit in foreign exchange. This indicator helps traders identify current trends and track them. Someone once made a profit of 10 times in a week by relying on it.No
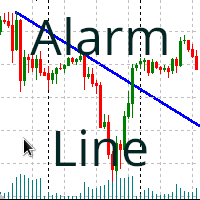
Avviso di rottura della linea di tendenza Descrizione: Questo indicatore attiva un allarme (suono, avviso o notifica) quando il prezzo supera una linea di tendenza, sia sopra che sotto di essa. Parametri: Names of the trendlines. : Nomi delle linee di tendenza separati da virgole (assicurarsi che il nome della linea di tendenza non abbia spazi all'inizio e sia preciso). Value over/under the line (E.g.: 0.03% or 500 pips). : Valore che definisce un margine sopra/sotto la linea di tendenza prima d

Introduction The Commodity Channel Index, commonly known as the CCI, is a versatile indicator used by traders and investors to identify cyclical trends in commodities, stocks, and other securities. It was developed by Donald Lambert in 1980, primarily for commodity trading, but has since found widespread application in various financial markets. The CCI is particularly favored for its ability to gauge overbought and oversold levels in price movements. Historical Background Donald Lambert, the

Preface: First of all, let me introduce myself. I am a programmer and have been working for over 20 years. 2023 has passed, and our studio has achieved a record of 500 times with 7 manual transmissions. Below, we will show you how to do it through a series of operations. The first step is to model. Modeling is to find a fixed trading pattern. I think everyone has heard of a 2/8 probability, and through this probability, we can further refine it, which means that 1 to 4 is the optimal state. We h
Modello di scansione è uno strumento all'avanguardia progettato per identificare sia la rotazione del trend ribassista che la rotazione del trend rialzista con una precisione senza precedenti,
consentendoti di prendere decisioni di trading informate e di rimanere un passo avanti rispetto al mercato. Versione MT5: WH Sweep Pattern MT5 Caratteristiche del modello di scansione:
Rileva e disegna automaticamente la rotazione del trend ribassista e rialzista sul tuo grafico, utilizzando diver
Description of work
The MA7 Agave indicator is based on the standard Average Directional Movement Index indicator. Shows the intersection of the +DI and -DI lines. Detailed information about the MA7 Agave indicator.
Indicator settings General settings: Period .
MA7 Flax settings: Period ; Multiplier ; Remove subsequent arrows – removes subsequent arrows in one direction.
Message settings: Send message to the terminal (Alert) – permission to send messages to the terminal using the Alert functi

The ICT Unicorn Model indicator highlights the presence of "unicorn" patterns on the user's chart which is derived from the lectures of "The Inner Circle Trader" (ICT) .
Detected patterns are followed by targets with a distance controlled by the user.
USAGE (image 2) At its core, the ICT Unicorn Model relies on two popular concepts, Fair Value Gaps and Breaker Blocks. This combination highlights a future area of support/resistance.
A Bullish Unicorn Pattern consists out of:

Presentiamo il nostro nuovo indicatore: [ON Trade Breakout Zone] Strumento di analisi di mercato semplice ma potente per tutti i trader! Adatto sia ai professionisti che ai trader principianti Sei pronto a potenziare la tua strategia di trading? Il nostro ultimo indicatore è progettato per semplificare l'analisi di mercato ed è uno strumento utile per trader di tutti i livelli. Che tu sia un esperto navigato o stia appena iniziando, [ON Trade Breakout Zone] è la tua chiave per sbloccare

Product Name: BicsOut - The Ultimate MT4 Breakout Indicator Introducing BicsOut, the indispensable tool for MT4 traders seeking precision in detecting breakouts across any currency pairs. BicsOut is meticulously designed to streamline your trading experience, providing automatic identification of breakout opportunities coupled with seamless entry and exit point calculations. Features: Breakout Detection: BicsOut excels in swiftly pinpointing breakout moments, enabling traders to capitalize on ma

StalkeR Arrow è un indicatore a freccia che fornisce segnali di acquisto e vendita sulla barra aperta/intra bar, questo indicatore si basa su modelli di azione dei prezzi e frattali
questo indicatore fornisce tp e sl per ogni segnale di acquisto e vendita, tp e sl sono sotto forma di linee sopra e sotto ciascun segnale, si estendono fino alla formazione di un nuovo segnale
questo indicatore dispone di un pannello/dashboard di backtest che fornisce statistiche di vincita/sconfitta dei segnali

This indicator is based on chart with specialty in volume, it clearly shows where the buying and selling force.
Note on images:
Settings and adjustments to the colors you prefer.
Being able to see the price that the market is at at the exact moment.
Able to accept more indicators in the same window, such as Bollinger Bands, Ma, Stochastic, MACD and many others that adapt to your best configuration.
SEEDER_Volume1 Mt4 indicator can be used on all types of charts, including RENKO charts

Calculate your account's consistency rule in one click! Works for all HFT Prop Firms: - Nova Funding - Infinity Forex Funds - KortanaFx - Next Step Funded - Quantec And many more! --------------------------------------------------- Settings: profitConsistencyPercentage = Max profit limit per order (%) according to your prop firm. lowerRangePercentage - Lowest range for lot size (%) according to your prop firm. upperRangePercentage - Upper range for lot size (%) according to your prop firm.
---

This indicator plots in the candles the divergence found in the selected indicator and can also send a notification by email and / or to the cell phone.
Works on all TIMEFRAMES. Meet Our Products
He identifies the divergences in the indicators:
Relative Strength Index (RSI); Moving Average Convergence and Divergence (MACD); Volume Balance (OBV) and;. iStochastic Stochastic Oscillator (STOCHASTIC).
It is possible to choose the amplitude for checking the divergence and the indicator has to b

Fair Value Gap is and MT4 Non Repaint and Non Lagging indicator which give alerts upon a signal is detected. It can be used for both scalping and swing trading.
The indicator is based on Trend following strategy and inbuilt trading algorithms of pure price action
Has alerts and also push notifications to your phone with signals to buy or sell.
Works on all Time-frames and MT4 brokers. It is as well a Multi-Currency Indicator, including Gold, Nasdaq and US30 pairs
Take advantage of this wond

Информационный индикатор, показывающий самые важные торговые уровни для внутридневной торговли, и не только. О понятии уровней «Поддержка» и «Сопротивление».
Всем известно, что исторический ценовой диапазон цен состоит из уровней от которых в прошлом, были значимые движения.
И уровни работающие в прошлом, наверняка будут работать и сейчас. К примеру, уровень, находящийся снизу текущей цены
является уровнем «Поддержки», если от него ранее было значительное движение. К примеру, уровень, нах
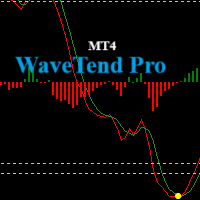
Wave Trend Oscillator Indicator for MetaTrader 4 Introducing the Wave Trend Oscillator Indicator , a robust technical analysis tool designed for MetaTrader 4 (MT4). This indicator helps traders better understand market movements by leveraging wave trend analysis. It is designed to provide visual cues that can assist you in analyzing market direction and potential shifts in momentum. The indicator is built to help identify key technical events, including: Divergence Detection : This feature can
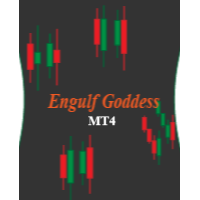
Introducing the Engulfing Goddess Indicator , a technical analysis tool for MetaTrader 4 (MT4) that helps traders identify engulfing candlestick patterns. This indicator is designed to provide visual signals that correspond to common patterns used in market analysis. The Engulfing Goddess Indicator is built to detect various types of engulfing patterns. It includes a range of optional filters to refine pattern detection, giving you the flexibility to customize your analysis. This feature can he
Description of work The MA7 Flax indicator is based on the standard Average True Range indicator and candle data. Shows candles that are larger in size relative to the ATR indicator value. Detailed information about the MA7 Flax indicator.
Indicator settings General settings: Period ; Multiplier ; Remove subsequent arrows – removes subsequent arrows in one direction.
Message settings: Send message to the terminal (Alert) – permission to send messages to the terminal using the Alert function; S

RaysFX Donchian Channel
Questo indicatore può essere utile per identificare i livelli di supporto e resistenza, nonché per visualizzare visivamente la gamma di prezzo di un determinato periodo. Variabili Valore Periodo 20 TimeFrame Current Mode High/Low(true) o Close (false) Modalità true Telegram: https://t.me/SmartSaverOfficial Store: https://www.mql5.com/it/users/rays96/seller
Questo indicatore è stato Progettato da RaysFX

Indicator for determining the direction of the current trend Sends signals about trend changes to the terminal, smartphone and email Allows you to quickly navigate when changing price direction Works on all timeframes, on any currency pairs, metals and cryptocurrencies Can be used when working with binary options Distinctive features Doesn't redraw Gives three types of signals Has simple settings Quickly adapts to any trading instrument; Works on all timeframes and all symbols; Suitable for trad
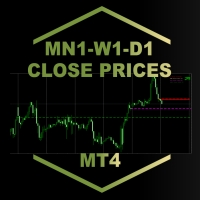
MN1-W1-D1 Close Price Indicator to Index Trading for MT4
The indicator draws lines to the close prices of the last closed bars of monthly, weekly and daily timeframes. Observably, these prices are significant support and resistance prices at major indices, like Nasdaq, DAX. The info panel always shows the prices relative to each other in the correct order. If the current price is the highest - i.e. higher than the last monthly, weekly and daily closing price - it is in the first row. The lowest
L'indicatore Scalper Signal Tarek per mt4 (Metatrader 4) fornisce segnali di scalping per qualsiasi coppia di valute in qualsiasi intervallo di tempo, anche sul grafico giornaliero.
L'indicatore è molto affidabile, leggero e non rallenterà la tua piattaforma di trading.
I segnali appaiono sulla finestra principale del grafico MT4 sotto forma di frecce di segnale di colore verde e rosso.
Segnale di acquisto e vendita:
Apri una posizione di acquisto quando la freccia verde viene stampata sul

Miko Trend is a hybrid trend indicator, as it is based on signals from elementary indicators and a special algorithm for analysis. The indicator shows favorable moments for entering the market. The indicator's intelligent algorithm determines the trend, filters out market noise and generates input signals.
The indicator can be used primarily to determine the trend. The indicator can work both for entry points and as a filter. Uses two parameters for settings. The indicator uses color signaling

RaysFX TMAT3 è uno strumento potente che combina due tipi di medie mobili per aiutarti a identificare e seguire le tendenze del mercato. L’indicatore utilizza una media mobile triangolare centrata (TMA) e un T3 Moving Average. Queste due medie mobili lavorano insieme per fornire segnali di trading chiari e tempestivi. Quando il T3 Moving Average è inferiore alla TMA, l’indicatore considera che la tendenza del mercato sia al rialzo e genera un segnale di acquisto. Al contrario, quando il T3 Movin
The Ruby Trend indicator calculates the saturation levels of the price chart. A signal to exit the resale area is a buy signal. A signal to exit the overbought area is a signal to sell. Usually you need to set relative values for the overbought and oversold levels Bottom and Top for this indicator.
Most often, a good trend is visible visually on the price chart. But an experienced trader must clearly understand the current balance of power in the market before entering. And the indicator will
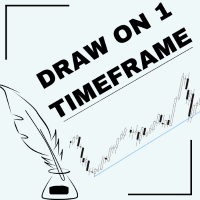
Draw On 1 Timeframe: Does exactly what the name says! When you draw a rectangle or trendline - the timeframe you draw it in, is the one it is visible. When you look at a higher or lower timeframe - the drawn object is not seen, but when you change back to the timeframe you originally draw in - the object can be seen. How to use it: This is an indicator that interacts with all trendline or rectangle objects drawn. Once running - it will automatically make any drawn trendline or rectangle objec

Market Structure MTF Dashboard Alerts: Is an fast way of checking the currently market structure on 4 timeframes! It lets you know if you are trading in the direction of both long-term and shor-term market bias. It is setup to track the High and Low positions to determine the current bias. Once the bias is shifting on the any of the 4 timeframes - you have the option to have an alarm notify you of the change. Once the alarm has gone off - you will be able to see a break of structure (BOS) form

Using the Neo Forex indicator algorithm, you can quickly understand what trend is currently developing in the market. The NeoX indicator accompanies long trends and can be used without restrictions on instruments or timeframes. Using this indicator you can try to predict future values. But the main use of the indicator is to generate buy and sell signals. The indicator tracks the market trend, ignoring sharp market fluctuations and noise around the average price. The indicator implements a type

The Compare Graphs indicator is an analysis tool that allows traders to compare two or more graphs on the same chart window. This indicator is commonly used in trading platforms such as MetaTrader and provides a clearer comparison of different financial instruments or time frames.
Functions of the Compare Graphs indicator may include: Selecting Charts: The trader can select the charts he wants to compare, such as price charts of different currency pairs or indicators on the same chart. Setting
Description of work The MA7 Viola indicator is based on the standard Moving Average indicator. Shows a sharp increase or decrease in the moving average. Detailed information about the MA7 Viola indicator.
Indicator settings General settings: Period ; Method ; Apply to ; Difference – difference between the last two MA values; Remove subsequent arrows – removes subsequent arrows in one direction.
Message settings: Send message to the terminal (Alert) – permission to send messages to the terminal
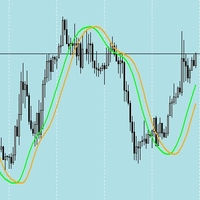
The Hull Moving Average (HMA) is renowned for its ability to smooth price movements effectively while maintaining responsiveness to recent price changes. When combined with a shifted Hull Moving Average crossover strategy, it offers a robust approach for identifying trends. Here's why: 1. Smoothness and Responsiveness : The HMA reduces noise in price data due to its weighted moving average calculation, which prioritizes recent prices. This smoothness helps filter out insignificant price fluctuat

RaysFX Forcaster è un indicatore avanzato per MetaTrader 4, progettato per fornire previsioni accurate del mercato. Questo indicatore utilizza un algoritmo sofisticato per calcolare i valori futuri basandosi su una serie di parametri configurabili dall'utente.
Caratteristiche principali: - TimeFrame : Permette all'utente di impostare il timeframe desiderato. Supporta diversi timeframes come M1, M5, M15, M30, H1, H4, D1, W1 e MN. - HalfLength : Questo parametro determina la lunghezza della metà

MEGA TREND DASHBOARD
This Dashboard shows the Currency Strength across multiple timeframes. This SUPER DASHBOARD, Not only does it get your watchlist of currency pairs and shows the strength of each currency across the timeframes you Select - but also does it in a way that You can check it in 1 second!!! This indicator is very powerful because it is based on our custom algorithm to show the trends that are existing right now! The indicator does all the work for you by showing you what is

RaysFX Engulfing
RaysFX Engulfing è uno strumento potente per identificare i pattern di engulfing nel mercato Forex. Questi pattern sono segnali di inversione di tendenza che possono fornire opportunità di trading preziose. Caratteristiche principali : Rilevamento di pattern engulfing : L’indicatore identifica i pattern engulfing rialzisti e ribassisti, che sono segnali di possibili inversioni di tendenza. Segnali visivi : I pattern rilevati vengono evidenziati sul grafico con frecce blu e ro

RaysFX DMI
Presentiamo l’Oscillatore RaysFX DMI, un indicatore personalizzato per la piattaforma di trading MetaTrader 4. Questo indicatore unico è progettato per fornire segnali di trading chiari e precisi basati sull’Indice di Movimento Direzionale (DMI). Caratteristiche principali: Oscillatore DMI: Calcola un oscillatore DMI basato su un periodo DMI specificato e un metodo di media mobile. Smoothing: L’oscillatore DMI viene ulteriormente lisciato in base a un periodo di lisciatura e a un
Description of work The MA7 Galega indicator is based on the standard Moving Average indicator. Shows a puncture of the moving average. Detailed information about the MA7 Galega indicator.
Indicator settings General settings: Period ; Method ; Apply to ; Consider the direction of the candle .
Message settings: Send message to the terminal (Alert) – permission to send messages to the terminal using the Alert function; Send message to the mobile terminal (Push) – permission to send messages to t
Il MetaTrader Market offre un luogo pratico e sicuro dove acquistare applicazioni per la piattaforma MetaTrader. Scarica versioni demo gratuite di Expert Advisors e indicatori direttamente dal tuo terminale e testali nello Strategy Tester.
Prova le applicazioni in diverse modalità per monitorare le prestazioni ed effettuare pagamenti per i prodotti desiderati, utilizzando il sistema di pagamento MQL5.community.
Ti stai perdendo delle opportunità di trading:
- App di trading gratuite
- Oltre 8.000 segnali per il copy trading
- Notizie economiche per esplorare i mercati finanziari
Registrazione
Accedi
Se non hai un account, registrati
Consenti l'uso dei cookie per accedere al sito MQL5.com.
Abilita le impostazioni necessarie nel browser, altrimenti non sarà possibile accedere.