Guarda i video tutorial del Market su YouTube
Come acquistare un Robot di Trading o un indicatore
Esegui il tuo EA
hosting virtuale
hosting virtuale
Prova un indicatore/robot di trading prima di acquistarlo
Vuoi guadagnare nel Market?
Come presentare un prodotto per venderlo con successo
Indicatori tecnici gratuiti per MetaTrader 4 - 13
Highly configurable Trader Dynamic Index (TDI) indicator.
Features: Highly customizable alert functions (at levels, crosses, direction changes via email, push, sound, popup) Multi timeframe ability (higher and lower timeframes also) Color customization (at levels, crosses, direction changes) Linear interpolation and histogram mode options Works on strategy tester in multi timeframe mode (at weekend without ticks also) Adjustable Levels Parameters:
TDI Timeframe: You can set the lower/higher ti
FREE

Indicatore Slope Channel per MetaTrader
Stai cercando uno strumento per analizzare le tendenze di mercato adatto a qualsiasi stile di trading? Slope Channel – il tuo assistente affidabile per identificare i movimenti dei prezzi e i livelli chiave del mercato! Cos'è Slope Channel? Slope Channel è un indicatore innovativo che costruisce un canale inclinato sul grafico, calcolando automaticamente i suoi parametri in base agli estremi locali. Questo strumento evidenzia l'opzione di canale ot
FREE

FTU Fibonacci Questo indicatore traccia i livelli di Fibonacci per i sistemi di ingresso di tipo ritracciamento ** Guarda il video per suggerimenti sulla strategia Caratteristiche: Più livelli di Fibonacci regolabili Cambia colore e quantità di barre dall'intervallo 2 linee per 50 barre prima del ritracciamento alto-basso e 2 linee per 20 barre Le linee mostrano 38 e 61 livelli di Fibonacci Utilizzo: Lo scopo è studiare o misurare il ritracciamento dei prezzi Cambia colore e quantità di barre d
FREE

Market Power Index (MPI): The Trader's Battlefield Intelligence When bulls and bears clash, MPI shows you who's winning. It measures the real-time balance of power between bulls (buyers) and bears (sellers) in any given market.
Now you can make informed decisions with the only indicator that measures both sides of the market simultaneously!
Professional-grade market analysis, simplified for every trader.
Available on both mt4 and mt5 platforms Free! Who Needs This? Forex traders (all exper
FREE

Volume Oscilator is a popular indicator available in trading view which is very popular among traders Definition The Volume Oscillator is an indicator made up of two Moving Averages (MA) surrounding volume, one being fast and the other slow. The slow volume MA value is then subtracted from the value of the fastlow Moving Average. The Volume Oscillator measures volume by analyzing the relationship between the two Moving Averages mentioned. When combined with other indicators it provides a very st
FREE
Like most things that work in trading, it's really simple. However, it's one of the most powerful tools I have that makes entries of many systems much more precise.
In its essence, it measures the recent volatility against the medium-term average. How does it work? Markets tend to be prone to strong trending movements when relative volatility is low and tend to be mean-reverting when relative volatility is high.
It can be used with both mean-reversion systems (like the Golden Pickaxe) and mo
FREE
This indicator displays the historical spread values on the chart. This is an extremely useful tool for watching the spread rise and fall, allowing you to enter the market at just the right time. This indicator will help you stay out of the market when the spread begins to rise and help you get into the market as the spread begins to fall again.
ON SALE FOR FREE, GET IT FREE FOR A LIMITED TIME ONLY
FREE

EMA Separation Coefficient reflects the separation between short-term and long-term exponential moving average trend resistance, as well as the direction of the current movement. Pay attention to potential crossover points when the coefficient approaches zero, this may indicate an upcoming breakout or reversal. Wait for confirmation of the trend before entering the trade, and exit when the coefficient forms a max (for calls) or a min (for puts). This is a small tool to help visualize the differe
FREE
Multi-Timeframe EMA Momentum Filter — Version 1.0 This indicator is designed to help traders evaluate short-term EMA crossovers in the context of higher timeframe momentum. Its purpose is to reduce noise and highlight setups that align with the broader market trend. How it works: On the main chart, arrows appear when a fast EMA crosses a slow EMA on the current timeframe, provided that higher timeframe momentum confirms the direction. In the subwindow, a histogram displays the difference betwee
FREE

Detailed blogpost: https://www.mql5.com/en/blogs/post/766378
Key Features
Adaptive Upper/Lower bands Smooth Center Line Customizable Length (sensitivity) Non-Repainting (only current ongoing bar is updated every "Refresh After Ticks" number of ticks) Multiple Price Sources - Choose from close, open, high, low, median, typical, or weighted close Components:
The Basis Line The smooth center line represents the weighted average of price. Think of this as the "true" price level when all the noise
FREE

Using the indicator you can 1 Identify the trend and follow the large and small trends by drawing lines. When the price leaves the corridor of the lines, then with a high probability the price will go to the next line and reverse on it. 2 Long-line - Lay lines along the centers of fractals, the indicator can detect the fractal of the second point (Number bars analysis). Often the price can approach the line even after a week or a month and you can open a reversal trade. If the wave has passed w
FREE

Identification of support and resistance areas
A useful indicator for traders
completely free
Can be used in all symbols
Can be used in all time frames
It has three different trends: short term, medium term, long term
Settings:
Clr1,2: You can change the color of the lines
Type Trend: You can determine the trend
Message me for questions, criticism and suggestions
FREE

You've probably heard about the Dow trend Theory, where higher highs and lows indicate an uptrend, and lower highs and lows indicate a downtrend. This indicator determines this trend based on the Dow Theory. You just need to enter a number representing the number of candles between extremes. The optimal solution is the number 3, unless you want to have the trend from M5 but you're on M1, then you need to multiply this number by 5. Check various combinations to trade with the trend. In the scree
FREE

AdvaneZigZag Indicator
Are you tired of the limitations of the traditional ZigZag indicator? Meet AdvaneZigZag, the ultimate tool to simplify your market structure analysis and enhance your trading strategies. Designed with flexibility and precision in mind, AdvaneZigZag brings you advanced features to navigate the market with confidence.
Key Features:
1. Enhanced Flexibility:
- While maintaining the familiar simplicity of the conventional ZigZag indicator, AdvaneZigZag offers superior a
FREE

Clock GMT Live ha tutto quello che ti serve per sapere di più sul nostro broker, molte volte ti sarai chiesto su che gmt mi trovo o su che gmt sta lavorando il mio broker, ebbene con questo strumento potrai conoscere in tempo reale sia il GMT time offset del broker e della tua ora locale, inoltre conoscerai costantemente il ping del broker Semplicemente posizionandolo in un momento della giornata puoi ottenere le informazioni
Il prezzo aumenta per ogni acquisizione, con questo proteggeremo in
FREE
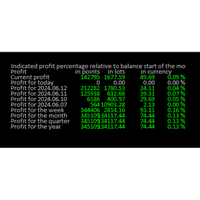
Online Diary: This indicator is designed to help traders keep track of profits and losses over various time periods, such as current profit, today’s profit, yesterday’s profit, and so on, up to the profit for the current year. The indicator offers several configuration options, such as the calculation of profit percentage relative to the balance at the beginning of the day, week, month, quarter, or year. It also allows for the customization of text placement and colors to suit the user’s needs
FREE

This tools is design to easily forecast the projection of the current trend through the inputs of Zigzag and get out of the market when the trend do not the ability to maintain it's volatility to go further... the indicator gets the initial and final price from the value of zigzag automatically by adjusting the intdepth of zigzag. You can also switch from Projection to Extension from the inputs tab of indicator.
FREE

The indicator displays two Moving Average lines on the chart with parameters specified in the settings. It issues a signal in the form of arrows and a sound at the intersection of these Moving Average. In the indicator settings, you can set the period of fast Moving Average ( Fast MA Period ) and slow Moving Average ( Slow MA Period ). And also Shift, Applied Price, Method and Timeframe for two Moving Averages separately. Important:
The main difference from othe
FREE

This channel is based on the Hodrick-Prescott filter, which is a type of zero-lag digital filter. First, filtered Close price values are calculated. Then, a second filtering with a longer period is applied. This results in two arrays: HP and HPSlow. In the next step, the standard deviation of HP relative to HPSlow is computed, and a channel is constructed. The VHP channel PRT indicator displays the average spread value and the channel width relative to HPSlow (expressed as a percentage) at th
FREE
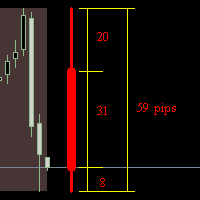
The indicator 'draws' a daily, weekly or monthly candlestick on the current chart. Shows in points the sizes of the upper and lower shadows, the body and the entire candlestick. Real time work. Works in the strategy tester. Indicator parameters: How_much_to_show - how many blocks to show. Block_period - block period (day / week / month) Shift - shift from the edge of the chart in bars. language - language selection.
FREE

Check out other great products from https://www.mql5.com/en/users/augustinekamatu/seller
This indicator is the best so far at determining the currency strength of each pair. It provides stable values and is highly adaptive to market changes. It is a great tool to add to your arsenal to make sure you are on the right side of the trend at all times. No inputs required, it is simple plug and play. A Winning Trading Strategy This article describes the components and logic needed to develop a tra
FREE

QuantumAlert CCI Navigator is a free indicator available for MT4/MT5 platforms, its work is to provide "alerts" when the market is inside "overbought and oversold" regions in the form of "buy or sell" signals. This indicator comes with many customization options mentioned in the parameter section below, user can customise these parameters as needful. Join our MQL5 group , where we share important news and updates. You are also welcome to join our private channel as well, contact me for the pri
FREE
The MT4 indicator that we are describing is designed to provide traders with an alert, notification, and email when Fibonacci levels are crossed. The Fibonacci levels are calculated based on the zigzag indicator, which helps to identify potential trend reversals in the market. When the indicator detects that a price has crossed a Fibonacci level, it will trigger an alert and send a notification to the trader's MT4 mobile app. Additionally, the indicator can be configured to send an email to the
FREE

Features:
- Moving Average Slope for Max Past Bars - Slope Period - Slope Thresholds - Multiple Slope Type options - See slope visually as a histogram - Info Panel Show/Hide Slope Calculations and Types:
The slope value is calculated using the Slope Period. Suppose Period is 5, it will check the MA value for bar (x) and bar (x+5). And find the slope angle between them.
Read detailed description about Slope Types and Settings here: https://www.mql5.com/en/blogs/post/747651
FREE
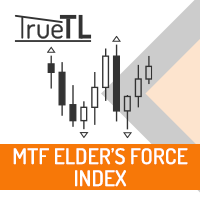
Indicatore Elder's Force Index (EFI) con supporto multi-timeframe, segnali visivi personalizzabili e sistema di allarme configurabile.
Cos'è EFI? L'Elder's Force Index (EFI) è un indicatore tecnico sviluppato dal Dr. Alexander Elder che misura la potenza dietro i movimenti dei prezzi combinando variazione di prezzo, direzione e volume. L'indicatore è calcolato come (Chiusura - Chiusura Precedente) × Volume, poi levigato con una Media Mobile Esponenziale (EMA). L'EFI oscilla attorno alla linea
FREE

MT5 version Overview
The Lowess Channel indicator is a smoothed trend-following tool designed to help traders identify the direction of the trend , detect flat or ranging markets , and spot breakouts from consolidation zones. It creates a central smoothed line with upper and lower channel boundaries, adapting to market noise while maintaining clarity. How It Works The indicator builds a channel around a smoothed price line. The central line reflects the current trend. The upper and lower bound
FREE
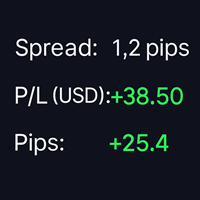
SpreadPipsProfit – Real-Time Spread, P/L & Pip Tracker SpreadPipsProfit is a lightweight, non-intrusive MT4 indicator that displays your key trading metrics in real time — directly on your chart. It’s designed for traders who value clarity, precision, and clean visuals. Key Features Right-Aligned Display Panel – Perfectly positioned in the top-right corner with adaptive spacing and safe edge margins. Live Spread Monitor – Shows the current spread in pips , helping you avoid overpaying on e
FREE

This indicator is the basis for an Expert Advisor that can be categorized as "almost Grail". See details below. This indicator displays the projection of the Renko chart on the price chart. This projection is displayed as a stepped line, not as "bricks" (rectangles). See slides 1 and 2. Abbreviated name of the indicator: LRC – L ine of R enko on the price C hart. The principle of its construction is very simple. First, a grid of horizontal lines (levels) is bu
FREE
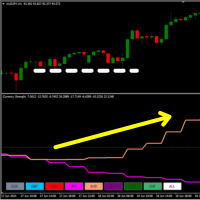
28 mercati in un unico indicatore! Sono disponibili 8 linee e ognuna rappresenta una valuta { EUR - USD - GBP - JPY - AUD - NZD - CAD - CHF }.
Cosa fa? Calcola un oscillatore personalizzato su tutte i 28 cambi del Forex e traccia la forza di ciascuna valuta. In questo modo è possibile analizzare la tendenza e la volatilità su multivaluta. Inoltre, cliccando su due valute diverse, il mercato cambia istantaneamente, quindi è molto utile per navigare i mercati valutari.
Come usarlo? È possibile
FREE

Developed by Etienne Botes and Douglas Siepman, the Vortex Indicator consists of two oscillators that capture positive and negative trend movement. In creating this indicator, Botes and Seipman drew on the work of Welles Wilder and Viktor Schauberger, who is considered the father of implosion technology. Despite a rather involved formula, the indicator is quite straightforward to understand and easy to interpret. A bullish signal triggers when the positive trend indicator (VI+ green line) crosse
FREE

Check my p a id tools they work perfect please r ate Here is an Upgraded version with Bonus Ea in case of purchase it costs 30$ only and you get Ea as Bonus: https://www.mql5.com/en/market/product/96835 This indicator is experimetal, it shows TMA channel arrows with Volatility filter built in to avoid lagging. Try to experiment with it, search for better conditions of use. It is possible to adjust different timeframes for TMA and for Volatility filter Same time on the current chart, so it ma
FREE

Th indicator is a technical analysis tool that helps identify significant changes in price trends and filter out minor price fluctuations. It is used to highlight price swings and provide a clearer picture of market movements. The Pivots are found by checking if a certain candle is the highest/lowest in a given number of candles that come before and after it. This indicator has only one input, its period. The Higher the period, the more strict the indicator is about what constitutes a Pivot. Th
FREE

Defines extremes. This indicator consists of two parts. The first draws lines on the chart indicating low volatility in relative daily market activity. The second is responsible for determining the extremum and gives signals to buy or sell. This system is suitable for all instruments. It is recommended to use a timeframe from m15 to h4. Before using, you need to choose the settings for yourself. Configure lines deviation. Specify volatility coefficient. Advantages The indicator does not repaint
FREE

Il nostro indicatore “Verve Ai Auto Fib” potenziato dall’IA identifica dinamicamente le tendenze di mercato e i canali di prezzo, quindi traccia automaticamente i livelli di Fibonacci basati sull’azione del prezzo in tempo reale. Niente più regolazioni manuali – solo ritracciamenti ed estensioni di Fibonacci precisi, su misura per le condizioni di mercato!
Caratteristiche principali e vantaggi: • Rilevamento automatico dei canali – algoritmo IA identifica le strutture di mercato chiave. • Liv
FREE

Transform your MetaTrader 4 chart into a professional trading cockpit. Apex Dashboard is a high-performance utility designed for serious traders who need complete situational awareness. It moves beyond simple monitoring by providing a comprehensive overview of your account's solvency, performance, and risk exposure in real-time. Unlike standard indicators, Apex Dashboard features a Persistent Data Engine . It records your historical Peak Drawdown to a local file, ensuring your risk metrics remai
FREE

Pivot levels is indicator showing 7 pivot levels. It is adjusted for major use, including: all standard time frames
choice of periods to show three popular calculation formulas (typical, median, weighted) 9 level Camarilla pivot
pivot day shift choice of properties for lines and labels choice of showing alerts when crossing pivot lines Parameters: ----------Main parameters----------- Timeframe - time frame for pivot levels
Number of periods to show - displays pivot levels for number of periods
FREE

Future prediction is something any trader would love to know, through this simple prediction algorithm can give a picture of the future. This algorithm is based on past data and the average prices of the data to simulate future candles. This is an indicator that will be redrawn. This indicator is completely free, can be used as a trend reference but absolutely do not use for trading.
FREE
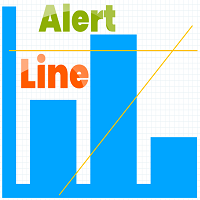
Indicator Rua Alert Line. This indicator will notify when the High-price of candle breaks any TrendLine or HorizontalLine on the chart. Notifications will be sent to the phone and on MT4. And it have ArrowBuy/ArrowSell on chart. It is very useful for those of you who use the TrendLine or HorizontalLine but do not have time to observe the chart. Timeframe M1 to W1 Symbol: All
FREE

Heiken Ashi Toggle – Instant Chart Mode Control for MT4 Heiken Ashi Toggle (Also spelled Heikin Ashi) is a small utility indicator for MetaTrader 4 that provides Heiken Ashi candles — with one key upgrade: instant ON/OFF control directly from the chart . Instead of constantly adding, removing, or reloading indicators, this tool allows traders to switch between standard candlesticks and Heiken Ashi visualization with a single click. What This Indicator Does Displays classic Heiken Ashi candles
FREE

This automated AK Edge Scalping Indicator can be employed to oversee trades and identify optimal entry points for all time frames and both buying and selling when the price starts trending upwards or downwards. It is designed to recognize zones for Sell/Buy trades by utilizing the Moving Average and the MACD. Additionally, it incorporates the Average True Value to fine-tune the Stop Loss and the Take Profit. It can be effectively used in conjunction with other strategies to facilitate prompt en
FREE
The purpose of this new version of the MT4 standard indicator provided in your platform is to display in a sub-window multiple timeframes of the same indicator. See the example shown in the picture below. But the display isn’t like a simple MTF indicator. This is the real display of the indicator on its timeframe. Here's the options available in the FFx indicator: Select the timeframes to be displayed (M1 to Monthly) Define the width (number of bars) for each timeframe box Alert pop up/sound/ema
FREE

This indicator is based on the ADX indicator and indicates the trend very easily.
You can customize the indicator to your needs: ADXPeriod ADXSignal_Level BarWidth CandleWith HeikenAshi
The Adx color candles indicator is fully FREE and compatible with the other part of the system; the Acc arrow >>>> https://www.mql5.com/en/market/product/33770 ENJOY and check out my other indicator: https://www.mql5.com/en/market/product/32111
FREE

Multi Timeframe Indicator includes a lot of functions and can be considered as a universal helper for a trader. It's main objective is to display up to 10 indicators at a time using just one small brick per each of them. These indicators involve Awesome Oscillator, CCI, DeMarker, MACD, RSI, RVI, Stochastic, Larry Williams' Percent Range, Bulls Power and Bears Power. An important function of the indicator is an ability to monitor signals from different timeframes. You can choose different combina
FREE
Che cos'è lo Schaff Trend Cycle? Lo Schaff Trend Cycle (STC) è un indicatore di tipo oscillatore progettato per rilevare tempestivamente i cambiamenti di tendenza. A differenza degli indicatori tradizionali come le medie mobili o il MACD, lo STC combina cicli di mercato e momentum per identificare in modo più chiaro l'inizio e la fine di una tendenza. Caratteristiche principali Segnali chiari di inversione di tendenza: la linea del ciclo sale durante un trend rialzista e scende durante un trend
FREE

Synchronize objects from one chart to multiple charts. Synchronize objects from one chart to multiple charts. 1. Allows automatic synchronization of new and edited objects to other charts. 2. Allows synchronization of all objects on the chart to other charts at the current time. 3. Allows setting the charts to synchronize based on the position of the chart in the MT4 window. Version 1.2: Allow set list of object names that you don't want to sync (Separated by commas ",")
Allow set 5 types of o
FREE

Key Level Key Level is a MetaTrader 4 Indicator that uses a proprietary algorithm based on Price Retracement/Breakout Method to show the Entry-Line on your trading.
Instead, it analyzes data of market and identify entry points and opportunities. (Price Retracement / Price Breakout)
It's also a trading tool that be used to practice and enhance your manual trading skills.
Key Level is an amazing tool for Scalping Trader. It also a trading tool that be used to practice and enhance your manual trad
FREE

Simple Candlestick Timer – Free MT4 Indicator Simple Candlestick Timer is a lightweight and easy-to-use MT4 indicator that displays a precise countdown until the current candlestick closes. This tool helps traders improve timing, discipline, and decision-making by showing exactly how much time remains before the next candle begins. Key Features: Clean countdown display directly on your chart. Helps with entry and exit timing. Lightweight, simple, and beginner-friendly. Works on all symbols and t
FREE
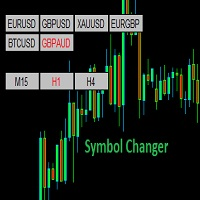
Symbol Changer (Custom) Indicator
This is a simple yet intuitive indicator. And its free.
The indicator provide easy navigation across various symbols and across different time frames all in a chart.
The buttons are displayed on the main chart.
It is flexible and easy to use with fast response speed.
FEATURES
UniqueID : This identifies the pairs for each chart
Use Custom Pairs : If set to true, load all the available symbols in the Market Watch. No means it loads the pairs selected be
FREE

STOCH AND RSI ALERT https://www.mql5.com/en/users/earobotkk/seller#products (I have created a dashboard from this product, please take a look by clicking here ) (I have also created an EA from this product, NOW user can go automation, click here ) P/S: If you like this indicator, please rate it with 5 stars in the review section, this will increase its popularity so that other users will be benefited from using it. This indicator notifies and draws an arrow on the chart whenever the main sto
FREE
Drawdown Alerts Free ! Meta Trader 4 Indicator. Please leave a review about this product to help other users benefit from it. This Drawdown Alerts indicator shows the drawdown percentage in real time and alerts you when the limit you specify is reached. Calculation of drawdown depends on the amount of the trade balance. You can customize Drawdown Alerts for Corner - Left , Right , Up , Down X Y Color Number of decimal digits Popup messages and sound - Turn on / off notifications Notification
FREE

This classic "old school" MAGIC MACD indicator gives you the cross of the parameters you set. Standart setting is (12,26,9) . The arrows give you a possible change of trend. Be careful and do not use this indicator as a single signal source.
FREE version Please feel free to check out our other REX indicator series. We do have other free indicators.
"OLD BUT GOLD"
FREE

Индикатор рисует уровни Фибоначчи с выделенными Ценовыми метками.При установке индикатора на график необходимо создать трендовую линию с именем указанным в поле" Unique name of trend line to place fib on ". По умолчанию имя=" Unique name of trend line to place fib on" = "+" .В индикаторе можно заменить уровни фибоначчи по своему усмотрению.Также меняются цвет,стиль,толщина линий и т. д.
FREE
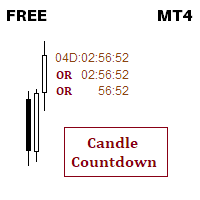
This indicator is about candle countdown timer
You can change timer color 3 colors can be set for different time range You can set font size, you can set font name If you need anything extra, ping me, I will add that functionality. Thank you :) Always open to feedback and criticism if it helps me provide you more value. - Rahul
My other indicators you may like
[I have been trading forex for last 6 years and i publish every indicator that i build for my personal use so everyone can benefit]
FREE

This indicator signals about crossing of the main and the signal lines of stochastic (lower stochastic) in the trend direction which is determined by two stochastics of higher time frames (higher stochastics). It is not a secret that stochastic generates accurate signals in a flat market and a lot of false signals in a protracted trend. A combination of two stochastics of higher time frames performs a good filtration of false signals and shows the main tendency. The indicator is recommended for
FREE

The indicator displays information about:
the name of the currency pair and timeframe. current price bid. time before the close of the candle. the current difference between the ask and bid (spread). Trading volume stats can also be displayed.
Displayed data
Name, account number, and account currency. A deposit in the account currency. Balance at the current time and a percentage of the balance. Current profit and its percentage. Current transaction and the percentage of the total deposit. Pr
FREE

RSI Candle Signal Indicator will change bars’ color when set overbought or oversold levels reach.
How to Use RSI Candle Signal Uptrend/Downtrends - RSI may be used to detect trending markets. For example, the RSI may stay above the mid line 50 in an uptrend. Top and Buttoms - RSI may help in identifying the tops around the overbought readings (usually above 70), and the bottoms around the oversold area (usually below 30). Divergence - divergence occurs when RSI directional movement is not co
FREE

ITS FREE I Recommend www.CoinexxBroker.com as a great broker and the one I personally use Asia session 1:00 to 9:00 (6pm est to 2 am est) Eur means London Session 10:00 to 18:00 (3 am est to 11 am est) USA means New York Session 15:00 to 23:00 (8 am est to 4 pm est) Session indicator highlights the start of each trading session. You can show all sessions or edit the settings to only show the hours you want highlighted (Asia) means Asian Session ,(Eur) means London Session , (USA) means New
FREE

Perché lo stile è importante
So quanto sia fastidioso fare clic ogni volta sulle proprietà per cambiare il colore della candela, lo sfondo chiaro o scuro e inserire o rimuovere la griglia. Ecco la soluzione con un solo clic: Tre pulsanti personalizzabili per scegliere lo stile di candela che gli operatori desiderano. Un pulsante per passare dalla modalità Giorno a quella Notte. Un pulsante per mostrare o nascondere la griglia sui grafici. ***** Nelle impostazioni è possibile scegliere dove vi
FREE

APP System Signals è un indicatore tecnico progettato per gli utenti attivi nei mercati finanziari. Utilizza una combinazione di medie mobili esponenziali (EMA), medie mobili semplici (SMA) e analisi delle tendenze per generare segnali di acquisto e vendita basati sul comportamento storico dei prezzi e sulla struttura del mercato. Tutti i parametri sono completamente personalizzabili, permettendo agli utenti di adattarlo al proprio stile di analisi e approccio al trading. L'indicatore può essere
FREE

Il nostro indicatore è progettato per i trader che apprezzano accuratezza, affidabilità e versatilità nell'analisi di mercato. Combina un'interfaccia semplice con una logica avanzata di generazione del segnale, rendendolo uno strumento indispensabile sia per i principianti che per gli operatori di mercato esperti.
I. ️ Vantaggio principale: Affidabilità assoluta del segnale Il valore principale dell'indicatore risiede nella sua integrità algoritmica, che elimina il problema principale di molt
FREE

This indicator scans for you up to 30 trading instruments and up to 8 timeframes for occurrences of the high probability reversal patterns: Double Tops/Bottoms with fake breakouts . Please read also the blog post " Professional Trading With Double Tops/Bottoms And Divergences! " which explains the concepts behind the ULTIMATE Double Top/Bottom indicator and how you can use a professional top-down approach. This FREE Version of the Scanner scans only EURUSD and GBPUSD. The full version of the sca
FREE
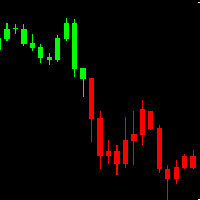
AH Candles MT4 AH Candles MT4 is a new product that allows identifying the current market phase (uptrend and downtrend ).
This indicator paints bars in different colors depending on the current state of the market trend ( Green and Red )
AH Candles MT4 is use for trading currencies
Advantages Suitable for intraday and swing trading. The indicator base on EMA method to calculate Period Parameters It can be used as a standalone tool or together with other indicators.
How to use the prod
FREE

This indicator is like a special kind of thermometer that measures the strength of the current currency pair you're looking at. Instead of showing temperature, it shows whether the pair is gaining strength or losing strength at any given moment, presented as an easy-to-read histogram (those vertical bars) in a separate window below your main chart.
Here's how it works in simple terms: The indicator uses two different speed settings to analyze the price - one "fast" setting (which reacts quickl
FREE
What is Squeeze Momentum? Squeeze Momentum is an innovative technical analysis indicator popularized by John Carter in "Mastering the Trade" that detects compression periods in markets. This indicator analyzes volatility changes using a combination of Bollinger Bands and Keltner Channel. What Does It Do? Squeeze Detection : Identifies periods when Bollinger Bands move inside the Keltner Channel Momentum Measurement : Shows momentum changes through linear regression calculations Color-Coded Signa
FREE

NOTE!: The trend vote and the buy sell option shall match to the same direction before you put a trade!!
Indicator that uses Kalman filters (same as used on autonomous vehicles for data fusion between different sensors / technologies such as RADAR, LIDAR and Camera with Artificial Intelligence for object detection) by using the high and low price in order to identify buy and sell signals as indicated on the graph.
This indicator can be used on any timeframe with any currency or symbol.
This i
FREE
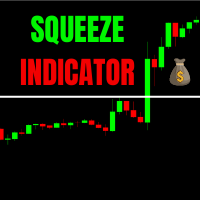
The one and only indicator that identifies Volatility Squeeze.
A Squeeze is a compression of volatility in the market.
If this compression of volatility reaches a certain percentage it means that the market could explode in moments.
I highly recommend using the indicator in conjunction with the economic calendar.
If there are important news and the indicator shows a BLUE HISTOGRAM on the exchange in question, a sign of a powerful compression of volatility.
Then get ready to grasp the next
FREE
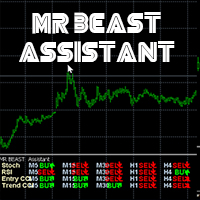
MRBEAST Assistant El indicador MR BEAST Assistant para MetaTrader es un indicador multitemporal que se basa en tres indicadores estándar: el oscilador estocástico, el RSI (Índice de Fuerza Relativa) y el CCI (Commodity Channel Index). Muestra las direcciones de la tendencia actual para los marcos temporales M1, M5, M15, M30, H1, H4, D1, W1 y MN1. Cuando se sigue un indicador de este tipo se tiene una visión clara de las tendencias en todos los marcos temporales importantes. No imp
FREE

Migliora la tua esperienza di trading con l'indicatore Your Chart! Questo strumento gratuito e altamente personalizzabile consente ai trader di unire più timeframe in un'unica visualizzazione pulita delle candele, senza alterare il grafico originale. Con Your Chart, puoi impostare il numero di barre per ogni candela personalizzata – ad esempio, combinare ogni 18 candele M1 in una sola per una visione più ampia delle tendenze di mercato. Caratteristiche principali: Formazione di candele personali
FREE
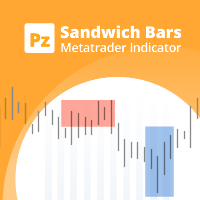
Spot high-probability trades: sandwich bar breakouts at your fingertips This indicator detects Sandwich Bars of several ranges, an extremely reliable breakout pattern. A sandwich setup consists on a single bar that engulfs several past bars, breaking and rejecting the complete price range. [ Installation Guide | Update Guide | Troubleshooting | FAQ | All Products ] Easy and effective usage Customizable bar ranges Customizable color selections The indicator implements visual/mail/push/sound aler
FREE

Nermal Round Levels is an indicator of round numbers in the form of a grid drawing horizontal lines. You can use it in many ways ... as it could be activating for an expert advisor to enter the market, confirmation of entry for your strategy, entrance area, mark areas of important levels, possible rebounds and others. Place it in your chart and verify as the price respects those round levels.
Inputs GridSpace linecolor lineStyle
FREE
Scopri come acquistare un robot di trading dal MetaTrader Market, il negozio di applicazioni per la piattaforma MetaTrader.
Il sistema di pagamento di MQL5.community supporta le transazioni tramite PayPal, carte bancarie e gli altri sistemi di pagamento più diffusi. Per essere pienamente soddisfatto, ti consigliamo vivamente di testare il robot di trading prima di acquistarlo.
Ti stai perdendo delle opportunità di trading:
- App di trading gratuite
- Oltre 8.000 segnali per il copy trading
- Notizie economiche per esplorare i mercati finanziari
Registrazione
Accedi
Se non hai un account, registrati
Consenti l'uso dei cookie per accedere al sito MQL5.com.
Abilita le impostazioni necessarie nel browser, altrimenti non sarà possibile accedere.