Unisciti alla nostra fan page
- Visualizzazioni:
- 10152
- Valutazioni:
- Pubblicato:
- Aggiornato:
-
Hai bisogno di un robot o indicatore basato su questo codice? Ordinalo su Freelance Vai a Freelance
Real author:
Ulterior (FF)
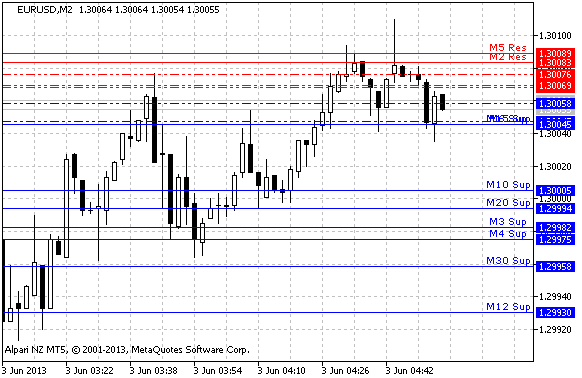
An interpretation of Stieve Nisson's 'Three Line Break' strategy. Levels are determined by the closing prices. Blue lines denote support, red - resistance, dotted lines - candidates.
The parameter of the LB indicator sets the number of levels for a breakthrough. After a certain number of points, the lines of the levels on the specified timeframe are trailed. Only levels of a higher timeframe are shown on the chart.
This indicator was first implemented in MQL4 and published in Code Base at mql4.com on 07.11.2008.

Figure 1. The SR_TLB indicator
Tradotto dal russo da MetaQuotes Ltd.
Codice originale https://www.mql5.com/ru/code/1753
 Damiani_volatmeter
The volatility meter with the indication in the form of a colored cloud
 MQL4 to MQL5 compatibility library
Version 1.2 - MQL5\Include\mql4compat.mqh