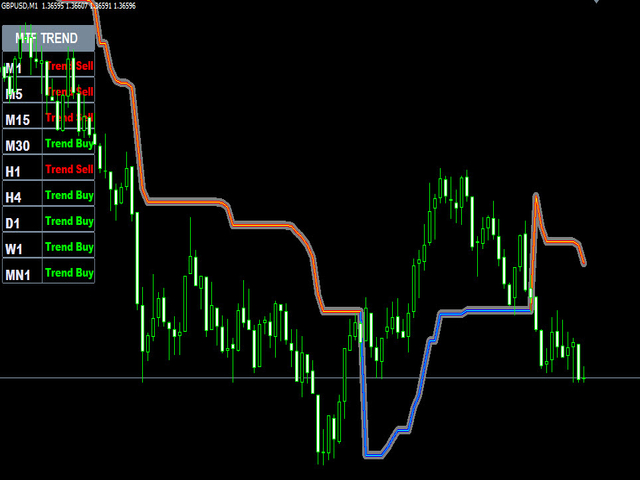
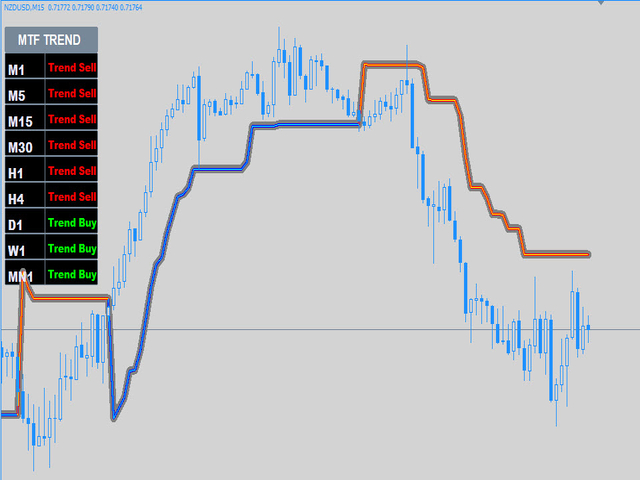
Atr Mtf Trend

The Average True Range (ATR) is a tool to measure volatility. ATR MTF (Multi Time Frame) indicator provides all timeframe trends helps to identify in which kind of volatility environment the market .This indicator can be used with any Trading Systems for additional confirmation of trading entries or exits. It is a very helpful tool to calculate Targets and Stops according the current market conditions.


Produits recommandés
Eurusdkiller
Nehemiah Rono
EUTUSDKILLER is a trend EA that works in all market conditions (i)It buys when the indicator confirms a trend  (ii)Sell when the same indicator confirms a down trend. (iii)Easy visual and effective trend detection. (iV)It filters and improve your trading strategies. (v) It scans previous data and give real time output. (vi) It can be set to auto calculate lots size.
Introducing the Donchian Channels indicator for MQL4, a powerful technical analysis tool designed to boost your trading success. This indicator consists of four lines that represent the upper and lower boundaries of price movement over a specified period. With the Donchian Channels indicator, you can easily identify potential breakouts and reversals in the market. The upper line shows the highest high of the specified period, while the lower line represents the lowest low. The space between thes
This is a simple arrow system based on Engulfing Candlestick Pattern. It gives you alerts on your smartphone when there is an engulfing candlestick pattern happens. Which type of alerts available? 1. It paints on chart Up/Down Arrows. 2. Popup message and sound alert in trading terminal window. 3. Push notification or Alert on your Android and IOS mobile phones (requires MT4 or MT5 app installed!) *Note: Use it on higher timeframes like H4 (4 hours), D1 (1 Day) then find trade opportunities on s
The foreign exchange market, and the stock and futures markets have almost the same model of price behavior, which boils down to the fact that the market first subsides and consolidates, after which new strong breakthroughs occur, which become the beginning or loud continuation of a certain trend. As a rule, breakouts occur after a breakout by the price of local lows and highs, which in turn are support and resistance lines for the trend. As a rule, the very moment of a breakthrough can take min
Super volumes
Yerzhan Satov
4 (1)
L'indicateur de flèche pour le Forex et les options Binaires est créé sur la base des volumes de tiques. Contrairement à de nombreux indicateurs de volume, l'indicateur "Super volumes" calcule les volumes haussiers et baissiers et donne des signaux sur la prédominance de l'un d'eux. Si nous disons en ce moment dans cette gamme il y avait un avantage des volumes haussiers, alors le signal sera sur Buy. Ou si la prédominance était des volumes baissiers, le signal sera respectivement sur Sell. Da
Indicateur Crypto_Forex « Histogramme de tendance » pour MT4, sans refonte. - L'indicateur Histogramme de tendance est beaucoup plus sensible et efficace que les moyennes mobiles croisées standard. - L'indicateur est disponible en deux couleurs : jaune (doré) pour une tendance baissière et vert pour une tendance haussière (les couleurs peuvent être modifiées dans les paramètres). - L'Histogramme de tendance intègre des alertes mobiles et PC. - Il est judicieux de combiner cet indicateur avec d
MACD Scanner With Alerts
Niravkumar Maganbhai Patel
4 (2)
MACD Dashboard Panel   This indicator helps you to scan symbols which are in the Market Watch window and filter out a trend according to MACD. Moving Average Convergence Divergence (MACD) is a trend-following momentum indicator that shows the relationship between two moving averages of a security’s price. The MACD is calculated by subtracting the 26-period Exponential Moving Average (EMA) from the 12-period EMA. The result of that calculation is the MACD line. A nine-day EMA of the MACD called
FREE
What is the Super Ichi Indicator? Super Ichi is an advanced combination of Ichimoku Kinko Hyo and SuperTrend indicators. This powerful technical analysis tool is designed to identify market trends and generate trading signals. What Does It Do? Dual-Level Trend Analysis : Uses customized versions of Tenkan-sen and Kijun-sen lines Automatic Signal Generation : Displays visual markers (arrows) at crossover points Real-Time Alert System : Provides audio and visual alerts when new signals occur Dynam
FREE
Cloud Power
Andriy Sydoruk
Implementation of indication of trend movement with moments for potential stops in the Cloud Power indicator. The transition to the shadow warns of a possible reversal. The entry of the price inside the shadow speaks of a flat movement. The indicator tracks the market trend with unmatched reliability, ignoring sharp market fluctuations and noise around the average price. Simple, visual and efficient use. The indicator does not redraw and does not lag. It can be easily used as an independent t
KT Tether Line MT4
KEENBASE SOFTWARE SOLUTIONS
The KT Tether Line is a trend-following tool consisting of three indicators that work together to generate trading signals. It can correctly identify market trends while signaling trade entries. It was first introduced by Bryan Strain in the Stock & Commodities magazine in 2000 in "How to get with the trend and out at the end." The Concept When a market trend is confirmed, the most challenging part is determining the timing of the entries. This indicator alerts you to potential trend reversals
Special Agent
Vitalii Zakharuk
The advantage of working on the Special Agent signal indicator is that the trader does not need to independently conduct a technical analysis of the chart. Determining the market trend is an important task for traders, and the tool gives ready-made signals in the form of directional arrows. This tool is an arrow (signal). Special Agent is a trend indicator, a technical analysis tool that helps to determine the exact direction of the trend: either up or down price movement for a trading pair of
Oscillator helps determine the direction of the market Shows the direction of the price movement and is painted in the appropriate color. Allows you to conduct trend and counter trend trading It works on all timeframes, on any currency pairs, metals and cryptocurrency Can be used when working with binary options Distinctive features Does not redraw; Simple and clear settings; It works on all timeframes and on all symbols; Suitable for trading currencies, metals, options and cryptocurrency (Bitco
Range Exhaustion
Robert Gerald Wood
L'épuisement de la fourchette se produit lorsque le prix atteint ou dépasse la fourchette attendue pour la période en cours. À ces niveaux, le prix commence à perdre son élan par rapport au début de la période, c'est donc un bon point pour vous assurer que vous ne prenez pas de nouvelles positions. Cet indicateur vous montrera où cela est susceptible de se produire sur votre graphique, montrant les niveaux pour les périodes quotidiennes, hebdomadaires et mensuelles. Lorsque vous voyez un prix dé
Please contact me at telegram  https://t.me/smartforex7 After purchasing SmartForex Indicator then Use This Indicator...................... SMART EXIT PROFIT LINE Indicator is very Helpful with SmartForex Indicator ........................................ SMART EXIT PROFIT LINE Indicator Attach with SmartForex Indicator after then Red Line Show Exit buy Profit , Green Line show Exit Sell Profit................
FREE
Scalp Arrow Exit Signals (MT4 Indicator) A powerful all‑in‑one MT4 indicator providing precise entries, exits, and re‑entries across any timeframe or trading style. The Scalp Arrow Exit Signals is a complete “black‑box” signal system engineered for MT4 traders who want clarity, speed, and reliability. It generates clean buy/sell arrows along with exit, re‑entry, retracement, and pull‑back entry signals — all supported by flexible alerts and customizable risk settings. Whether you scalp fast ch
TDI Signals generates buy and sell arrows based on a TDI(Traders Dynamic Index) algorithm. It looks for price breakouts, continuations and reversals. By default it runs in the trend mode but user is provided with the option to change that to reversal mode. Trader can use the mode which compliments his/her trading style.  Usage:-   TDI Signals can be used as a stand alone indicator with context or even be added to strategies to make confirmations more strong. Volatility based stop loss, take pro
Currency StrengtT
Hafis Mohamed Yacine
What Is Currency StrengtT Indicator? A currency strengthT indicator is a graphical tool that shows the strength of a currency. Common indicators usually show the strength of a currency in relation to another currency, however, with some calculations it is possible to find the absolute strength of each individual currency. Therefore, a currency strength matrix indicator (or meter) is a tool that tries to express the absolute strength of a currency, so that you can compare this strength with the
BinaryMartini
Abdulkarim Karazon
un indicateur de trading binaire basé sur le croisement 3ma avec macd, il donne des signaux d'achat et de vente à l'ouverture de la barre et il ne repeint ni ne peint en arrière l'indicateur ne se concentre pas sur un taux de victoire élevé car il est conçu pour le trading de martingale, l'indicateur se concentre sur le nombre de signaux perdants le plus bas d'affilée. Stratégie : Le dépôt minimum est de 1 000 unités, nous commençons le trading avec 1 unité (la taille de la transaction est de 1
Hydra Trend Rider is a non-repainting, multi-timeframe trend indicator that delivers precise buy/sell signals and real-time alerts for high-probability trade setups. With its color-coded trend line, customizable dashboard, and mobile notifications, it's perfect for traders seeking clarity, confidence, and consistency in trend trading. Setup & Guide:  Download  MT5 Version here. To learn how to use the Indicator: Indicator Manual & Guide -   Read Here Exclusively for you: It's your chance to st
Cet indicateur est un indicateur d'analyse automatique des vagues, parfait pour le trading pratique ! Cas... Remarque :   je n'ai pas l'habitude d'utiliser des noms occidentaux pour l'évaluation des vagues. En raison de l'influence de la convention de dénomination de Tang Lun (Tang Zhong Shuo Zen), j'ai nommé la vague de base comme   un stylo   et la bande d'onde secondaire comme   un segment   . en même temps, le segment a la direction de la tendance.Le   segment de tendance principal   est no
TREND HARMONY MT4 –  Multi Timeframe Trend and Phase and Pullback Level Visualizer indicator for Metatrader4 The TREND HARMONY indicator automates deep trend analysis and generates visualizations for you. Take control of your trades by eliminating uncertainty! Revolutionize your trading experience with precision and insight through the TREND HARMONY Multi Timeframe Trend Indicator – your ultimate MT4 trend visualization indicator. Are you tired of missing trading opportunities or consistently e
Niubility Trend  Niubility Trend displays the trend direction for all time frames in real time. You'll see at a glance at which direction the trends are running, how long they last and how powerful they are. All this makes it an easy-to-use trend trading system for beginners, advanced and professional traders. Features Easy to trade Customizable colors and sizes It is non-repainting and non-backpainting It is fantastic as a trailing stop method It implements alerts of all kinds
The Strong Volume Trend  MT4 indicator is a powerful tool designed to help traders identify and capitalize on significant volume trends in the financial markets. With its advanced algorithm, this indicator accurately detects the strength and direction of volume movements, allowing traders to make informed trading decisions. Features: Volume Strength Analysis: The indicator analyzes the volume data and identifies strong volume trends, helping traders spot potential market reversals, breakouts, or
Esse indicador mede o 1º Canal de referencia e a 1º  Zona Neutra * configurar o canal macro para verificar a frequencia MAIOR H1 H4 1D * configurar o canal micro para verificar a frequencia Menor 1M 5M 15M Como instalar o Indicador fimathe. E uma pré mentoria tem uma estrategia Secreta bonus nesse video . assitao o video para enteder as logicas que podemos iniciar com esse indicador. https://www.youtube.com/playlist?list=PLxg54MWVGlJzzKuaEntFbyI4ospQi3Kw2
FREE
PTW NON REPAINT TRADING SYSTEM + HISTOGRAM Non-Repainting ,   Non-Redrawing   and   Non-Lagging  Trading System. Does the following: - Gives Accurate Entry and Exit Points - Scalping, Day and Swing Trading  - 95% Accuracy  - Targets, where to take profits. - Shows Trends, Support and resistance levels - Works on All Brokers - Works on All Currencies, CFDs and Stocks - It does not place trades for you, it only shows you what trades to place. - It works on All Timeframes - It is for Trend or ran
Forex Hunter a fully automated Expert Advisor. This EA based on Engulfing signal and Moving Average, Have a good winning percentage.The Engulfing signal means that current candlestick patterns fully covered previous candlestick. If the market and the order of the opposite direction, you can set the stop loss parameters. If you want to enable Martingale system, set the stop loss parameter above 1000 points. This EA have dynamic lot sizing (something like DynamicLots =10000, equity = 1000 > lot =
Rira VWAP Bands
Vitor Palmeira Abbehusen
VWAP Bands gives you the regular Volume-Weighted Average Price and also the deviation bands. Use this indicator to see the possible amount of market movement, find support and resistance lines, find good spots for entry and exit,  and the most important feature is to find possible pivot points. This indicator has been mathematically improved by Rira team. The calculation begins at the start of each trading day
Flying Volume
Paul Geirnaerdt
1 (1)
The Flying Volume indicator is a specialized volume indicator. It deciphers the volume data after heavy proprietary number crunching. When a main signal is found Flying Volume will look for possible continuation points. The main signal is shown by arrows, the continuation points by dots. Volume indicators are most often used on higher timeframes. Features Main Buy or Sell signals Continuation signals No repainting One signal per bar Settings Flying Volume default settings are good enough most
Colored indicator of the linear channel based on the Fibonacci sequence. It is used for making trading decisions and analyzing market sentiment. The channel boundaries represent strong support/resistance levels, as they are the Fibonacci proportion levels. Users can select the number of displayed lines of channel boundaries on the chart by means of the input parameters. Attaching multiple instances of the indicator to the chart with different calculation periods leads to displaying a system of c
BullsBears Action
Thushara Dissanayake
Le   conseiller expert BullsBears Action   est une solution de trading avancée conçue pour les traders qui s'appuient sur une analyse de marché basée sur les volumes. Exploitant les données de volume des marchés haussiers et baissiers, cet EA identifie automatiquement les opportunités de trading potentielles en fonction de la vigueur du marché et exécute les ordres d'achat ou de vente selon des paramètres définis par l'utilisateur. Entièrement personnalisable, il permet aux traders d'affiner le
Les acheteurs de ce produit ont également acheté
Gann Made Easy
Oleg Rodin
4.83 (162)
Gann Made Easy est un système de trading Forex professionnel et facile à utiliser qui est basé sur les meilleurs principes de trading en utilisant la théorie de mr. WD Gann. L'indicateur fournit des signaux d'ACHAT et de VENTE précis, y compris les niveaux Stop Loss et Take Profit. Vous pouvez échanger même en déplacement en utilisant les notifications PUSH. VEUILLEZ ME CONTACTER APRÈS L'ACHAT POUR RECEVOIR GRATUITEMENT DES INSTRUCTIONS DE TRADING ET D'EXCELLENTS INDICATEURS SUPPLÉMENTAIRES! Vou
M1 Sniper
Oleg Rodin
5 (22)
M1 SNIPER est un système d'indicateurs de trading facile à utiliser. Il s'agit d'un indicateur à flèche conçu pour l'unité de temps M1. Cet indicateur peut être utilisé seul pour le scalping sur l'unité de temps M1 ou intégré à votre système de trading existant. Bien que conçu spécifiquement pour le trading sur l'unité de temps M1, ce système peut également être utilisé avec d'autres unités de temps. Initialement, j'avais conçu cette méthode pour le trading du XAUUSD et du BTCUSD. Cependant, je
Le système PRO Renko est un système de trading très précis spécialement conçu pour le trading de graphiques RENKO. Il s'agit d'un système universel qui peut être appliqué à divers instruments de négociation. Le système neutralise efficacement ce qu'on appelle le bruit du marché en vous donnant accès à des signaux d'inversion précis. L'indicateur est très facile à utiliser et n'a qu'un seul paramètre responsable de la génération du signal. Vous pouvez facilement adapter l'outil à n'importe que
Advanced Supply Demand
Bernhard Schweigert
4.91 (299)
Offre spéciale : 40 % de réduction La solution idéale pour les traders débutants comme experts ! Cet indicateur est un outil de trading unique, performant et abordable grâce à l’intégration de nombreuses fonctionnalités exclusives et d’une nouvelle formule. Cette mise à jour vous permet d’afficher des zones sur deux unités de temps. Vous pourrez ainsi visualiser non seulement une unité de temps supérieure, mais aussi l’unité de temps du graphique, ainsi que l’unité de temps supérieure : des z
Market Makers
Mohamed Hassan
5 (3)
After purchase, contact me privately to receive 1 month of free testing with EA Forex Proton! This advanced MT4 trading robot automatically executes signals from any MT4 indicator, including Market Makers. The latest version also includes AI integration, allowing each trade signal to be analyzed using Artificial Intelligence. Live Signal with EA Forex Proton: Click here Market Makers is a powerful price action trading system designed to identify high-probability Buy and Sell opportunities based
Trend Screener
STE S.S.COMPANY
4.79 (95)
Indicateur de tendance, solution unique révolutionnaire pour le trading et le filtrage des tendances avec toutes les fonctionnalités de tendance importantes intégrées dans un seul outil ! Il s'agit d'un indicateur multi-période et multi-devises 100 % non repeint qui peut être utilisé sur tous les symboles/instruments : forex, matières premières, crypto-monnaies, indices et actions. OFFRE À DURÉE LIMITÉE : L'indicateur Support and Resistance Screener est disponible pour seulement 65 $ et à vie. (
Signal GoldRush Trend Arrow L'indicateur GoldRush Trend Arrow Signal fournit une analyse précise et en temps réel des tendances, spécialement conçue pour les scalpers à haute vitesse et à court terme sur la paire XAU/USD. Conçu spécialement pour les intervalles de temps d'une minute, cet outil affiche des flèches directionnelles indiquant clairement les points d'entrée, ce qui permet aux scalpers de naviguer en toute confiance dans des conditions de marché volatiles. L'indicateur se compose
NAM Divergences
NAM TECH GROUP, CORP.
5 (1)
MT4 Multi-timeframe Divergence and Overbougt/Oversold detection indicator. Features - Fully customizable on chart control panel, provides complete interaction. - Hide and show control panel wherever you want. - Real time information about non-capitalized divergences. - Real time information about overbougt / oversold situations. - Real time information about regular divergences. - Real time information about hidden divergences. - Oscillators available for divergences detection: AO, RSI, CCI, MA
Super Signal – Skyblade Edition Système de signaux de tendance professionnel sans repaint / sans latence, avec un taux de réussite exceptionnel | Pour MT4 / MT5 Il fonctionne mieux sur des unités de temps inférieures, comme 1 minute, 5 minutes et 15 minutes. Caractéristiques principales : Super Signal – Skyblade Edition est un système de signaux intelligent conçu spécifiquement pour le trading de tendance. Il utilise une logique de filtrage multicouche pour détecter uniquement les mouvements d
L'indicateur « Dynamic Scalper System » est conçu pour la méthode de scalping, permettant de trader au sein des vagues de tendance. Testé sur les principales paires de devises et l'or, il est compatible avec d'autres instruments de trading. Fournit des signaux pour l'ouverture de positions à court terme le long de la tendance, avec un support supplémentaire pour les fluctuations de prix. Principe de l'indicateur : De grandes flèches déterminent la direction de la tendance. Un algorithme de gén
Auto Optimized Parabolic RSI : Moteur de Momentum 3D Avancé La plupart des indicateurs pour les particuliers échouent car ils s'appuient sur des paramètres statiques qui se brisent dès que la volatilité du marché change. L'Auto Optimized Parabolic RSI résout le problème de l'« obsolescence des indicateurs » en recalculant continuellement son propre avantage mathématique, apportant une adaptation quantitative de niveau institutionnel directement sur votre terminal MT5. L'Avantage Principal : Opti
Scalper Inside PRO
Alexey Minkov
4.74 (69)
Scalper Inside PRO – Since 2020. An exclusive indicator that utilizes an innovative algorithm to swiftly and accurately determine the market trend. The indicator automatically calculates opening, closing, and profit levels, providing detailed trading statistics. With these features, you can choose the most appropriate trading instrument for the current market conditions. Additionally, you can easily integrate your own arrow indicators into Scalper Inside Pro to quickly evaluate their statistics
Apollo SR Master est un indicateur de support/résistance doté de fonctionnalités spéciales qui simplifient et fiabilisent le trading basé sur les zones de support/résistance. Cet indicateur calcule ces zones en temps réel, sans aucun décalage, en détectant les sommets et les creux locaux des prix. Pour confirmer la nouvelle zone de support/résistance, il affiche un signal spécifique indiquant que cette zone peut être prise en compte et utilisée comme un véritable signal d'achat ou de vente. Dans
ACTUELLEMENT 40% DE RÉDUCTION La meilleure solution pour tout débutant ou trader expert ! Cet indicateur est un outil de trading unique, de haute qualité et abordable car nous avons incorporé un certain nombre de caractéristiques exclusives et une nouvelle formule. Avec seulement UN graphique, vous pouvez lire la force de la devise pour 28 paires Forex ! Imaginez comment votre trading va s'améliorer parce que vous êtes capable de repérer le point de déclenchement exact d'une nouvelle tendance
Ultimate Sniper Dashboard
Hispraise Chinedum Abraham
4.82 (22)
Prix réduit à 299 $ ! Les prix peuvent augmenter à l'avenir ! Lisez la description ci-dessous ! Meilleur système d'entrée pour le tableau de bord Ultimate Sniper : NIVEAUX DYNAMIQUES ULTIMES. (Veuillez consulter mes produits) L'Ultimate Sniper Dashboard fonctionne UNIQUEMENT sur les marchés en direct en raison des limites des tests multidevises de MT4. Voici l'Ultimate-Sniper Dashboard ! Notre meilleur produit qui contient à la fois HA-Sniper, MA-Sniper et de nombreux modes spéciaux. L'Ultima
Currency Strength Wizard est un indicateur très puissant qui vous offre une solution tout-en-un pour un trading réussi. L'indicateur calcule la puissance de telle ou telle paire de devises en utilisant les données de toutes les devises sur plusieurs périodes. Ces données sont représentées sous la forme d'un indice de devise facile à utiliser et de lignes électriques de devise que vous pouvez utiliser pour voir la puissance de telle ou telle devise. Tout ce dont vous avez besoin est d'attacher l'
Atomic Analyst
Issam Kassas
5 (5)
Tout d'abord, il convient de souligner que cet indicateur de trading n'est ni repainting, ni redrawing et ne présente aucun délai, ce qui le rend idéal à la fois pour le trading manuel et automatisé. Manuel de l'utilisateur : réglages, entrées et stratégie. L'Analyste Atomique est un indicateur d'action sur les prix PA qui utilise la force et le momentum du prix pour trouver un meilleur avantage sur le marché. Équipé de filtres avancés qui aident à éliminer les bruits et les faux signaux, et à
BTMM State Engine Pro is a MetaTrader 4 indicator for traders who use the Beat The Market Maker approach: Asian session context, kill zone timing, level progression, peak formation detection, and a multi-pair scanner from a single chart. It combines cycle state logic with a built-in scanner dashboard so you do not need the same tool on many charts at once. What it does Draws the Asian session range; session times can follow broker server offset or be set in inputs. Tracks level progression (L
Arrêtez de deviner. Commencez à trader avec un avantage statistique. Les indices boursiers ne se négocient pas comme le forex. Ils ont des sessions définies, des gaps overnight et suivent des modèles statistiques prévisibles. Cet indicateur vous fournit les données de probabilité dont vous avez besoin pour trader des indices comme le DAX, S&P 500 et Dow Jones avec confiance. Ce qui le rend différent La plupart des indicateurs vous montrent ce qui s'est passé. Celui-ci vous montre ce qui va proba
KT Alpha Hunter Arrows MT4
KEENBASE SOFTWARE SOLUTIONS
La plupart des indicateurs à flèches vous donnent un signal, puis vous laissent gérer tout le reste seul. KT Alpha Hunter Arrows vous fournit un plan de trading complet. Chaque flèche de signal s’affiche avec un plan déjà tracé : ligne d’entrée, stop loss, quatre niveaux de take profit et un verdict d’edge en temps réel indiquant si ce symbole et cette unité de temps méritent d’être tradés maintenant. Le package inclut un Trade Manager EA qui prend en charge l’exécution après votre entrée, afin
Dynamic Forex28 Navigator
Bernhard Schweigert
4.43 (7)
Dynamic Forex28 Navigator - L'outil de trading Forex de nouvelle génération. ACTUELLEMENT 49 % DE RÉDUCTION. Dynamic Forex28 Navigator est l'évolution de nos indicateurs populaires de longue date, combinant la puissance de trois en un : Advanced Currency Strength28 Indicator (695 avis) + Advanced Currency IMPULSE avec ALERT (520 avis) + CS28 Combo Signals (Bonus). Détails sur l'indicateur https://www.mql5.com/en/blogs/post/758844 Qu'offre l'indicateur de force de nouvelle génération ? Tout
ACTUELLEMENT 40% DE RÉDUCTION ! ! La meilleure solution pour tout débutant ou Expert Trader ! Cet indicateur est un outil de trading unique, de haute qualité et abordable car nous avons incorporé un certain nombre de caractéristiques exclusives et une formule secrète. Avec seulement UN graphique, il donne des alertes pour les 28 paires de devises. Imaginez comment votre trading s'améliorera parce que vous serez capable de repérer le point de déclenchement exact d'une nouvelle tendance ou d'un
- Real price is 80$ - 50% Discount (It is 39$ now) - just for 2 purchases. Contact me for instruction, add group and any questions! - Non-repaint - I just sell my products in Elif Kaya profile, any other websites are stolen old versions, So no any new updates or support. - Lifetime update free Related product:   Bitcoin Expert Introduction The breakout and retest strategy is traded support and resistance levels. it involves price breaking through a previous level.  The break and retest strateg
FX Volume
Daniel Stein
4.63 (38)
FX Volume : Découvrez le Sentiment du Marché tel que perçu par un Courtier Présentation Rapide Vous souhaitez faire passer votre approche de trading au niveau supérieur ? FX Volume vous fournit, en temps réel, des informations sur la manière dont les traders particuliers et les courtiers sont positionnés—bien avant la publication de rapports retardés comme le COT. Que vous visiez des gains réguliers ou recherchiez simplement un avantage plus solide sur les marchés, FX Volume vous aide à repére
TPSpro RFI Levels
Roman Podpora
4.86 (28)
INSTRUCTIONS RUS  /  INSTRUCTIONS   ENG  /  Version MT5 Fonctions principales : Affiche les zones actives des vendeurs et des acheteurs ! L'indicateur affiche tous les niveaux/zones de première impulsion corrects pour les achats et les ventes. Lorsque ces niveaux/zones sont activés, là où commence la recherche de points d'entrée, ils changent de couleur et se remplissent de certaines couleurs. Des flèches apparaissent également pour une perception plus intuitive de la situation. LOGIC AI - Affi
Cycle Sniper
Elmira Memish
4.39 (36)
Please contact us after your purchase and we will send you the complimentary indicators to complete the system Cycle Sniper is not a holy grail but when you use it in a system which is explained in the videos, you will feel the difference. If you are not willing to focus on the charts designed with Cycle Sniper and other free tools we provide, we recommend not buying this indicator. We recommend watching the videos about the indiactor and system before purchasing. Videos, settings  and descri
Documentation for connecting Metatrader 4 with Python with a simple drag and drop EA.   A full end-to-end solution ,fully tested ,fast and efficient! The Pytrader ecosystem consists of a python script and a MT4 EA. (  MT5  version ) Further for the licensing an indicator is used.  The communication between the python script and the EA is based on sockets. EA is the  Server   and the python script the  Client .  It is always query(function / python script) and output(data / server). The EA doe
Route Lines Prices - est un indicateur conçu pour identifier les directions des prix. Son interface simple intègre plusieurs algorithmes de calcul du comportement des prix et de leur direction future. Ces algorithmes incluent le calcul de la volatilité et le lissage des prix en fonction des unités de temps utilisées. L'indicateur possède un unique paramètre permettant de modifier la valeur « Calculating price values ». La valeur par défaut de 1 assure un calcul automatique équilibré, utilisabl
Volatility Trend System - un système de trading qui donne des signaux pour les entrées. Le système de volatilité donne des signaux linéaires et ponctuels dans le sens de la tendance, ainsi que des signaux pour en sortir, sans redessiner ni retarder. L'indicateur de tendance surveille la direction de la tendance à moyen terme, montre la direction et son changement. L'indicateur de signal est basé sur les changements de volatilité et montre les entrées sur le marché. L'indicateur est équipé de pl
Stratos Pali
Michela Russo
4.43 (7)
Stratos Pali Indicator   is a revolutionary tool designed to enhance your trading strategy by accurately identifying market trends. This sophisticated indicator uses a unique algorithm to generate a complete histogram, which records when the trend is Long or Short. When a trend reversal occurs, an arrow appears, indicating the new direction of the trend. Important Information Revealed Leave a review and contact me via mql5 message to receive My Top 5 set files for Stratos Pali at no cost! Dow
Plus de l'auteur
Half Trend TPSL Buy Sell Indicator calculates the open and close of the price bars over the selected period of time and applies its own  calculation method to find an average line of the price movement.  ATR based Take Profit and Stop Loss ATR is a measure of volatility over a specified period of time. The most common length is 14, which is also a common length for oscillators, such as the relative strength index (RSI) and stochastics. A higher ATR indicates a more volatile market, while a lowe
Advanced Camarilla Calculator is one of the most commonly used trading calculators. This calculator can be used to generate levels. Scenario 1 Open price is between H3 and L3 For Long  - Wait for the price to go below L3 and then when it moves back above L3, buy. Stop loss will be when price moves below L4. Target1 - H1, Target2 - H2, Target3 - H3  For Short  -  Wait for the price to go above H3 and then when the price moves back below H3, sell. Stop loss will be when price moves above H4. Targe
Multi Trend Analyzer MT4 indicator provides signals from the following technical trading indicators: RSI, STOCH, STOCHRSI, MACD, ADX, Williams % R, ATR, Oscillator, ROC and Bull/Bear Power. It supports all time frames, from the 1 minute up to the monthly charts. You can change all indicator inputs. Indicator provide total trend summary. We can easily analysis and study market movement .
MACD MULTI TIME FRAME WITH MULTI SYMBOLS  INDICATOR  MACD MTF Indicator visualize all MT4 time frame  and trend based on  Moving Average Convergence Divergence (MACD) strategy . Indicator have settings for MACD customizing and variable "Symbols "EURUSD,USDCHG,...", which is used to define symbols. , Signals are displayed  Buy  , Strong buy  ,  Sell,  Strong Sell,   ### - No Trend Strong  Description The Moving Average Convergence/Divergence indicator is a momentum oscillator primarily used to tr
Super Trend Filter Indicator Super trend Arrow Consider as a Master Candle , If super trend in Buy signal , then signal candle calculate as master candle  and master candle close above the open candle then calculate filter Buy Arrow.  If super trend in Sell signal , then signal candle calculate master candle  and master candle close below the open candle calculate filter Sell Arrow. 3 Target with Trailing Stop Loss 
Multi Indicators Scanner Indicator Scan  ADX ,Moving Average ,ENVELOPE ,SAR , MACD ,RSI  and ATR . We can change all input parameters in chart window. scanner works Multiple Time Frame we can change Timeframe .  Symbol button based on Trend color , we can click button and open chart .  We can also save templates in input.   Default settings Time Frame   1Hour Templates Name  Default Auto Arrange Chart  true
Fibonacci calculator is used with Elliot Waves, it can generate remarkable results. A trader could use these levels or ratios to find high probability trades with very small stop loss. You may also use these ratios to find Elliott Waves extensions and to book profit near those levels. For Elliot Wave experts, Fibonacci calculator is a highly useful tool that can assist them in calculating Fibonacci extension and retracement levels for the market price. The indicator proves itself as a useful one
This MACD Magic indicator coded due to inspired in a another similar indicator ,Here Macd Magic calculate Double trend confirmation. With ATR Ratio Based TP point , ATR value input are available in input settings . MACD Magic indicator provides Accurate signals on all Major currency pair and stocks. This indicator Very easy to analysis trend and set target point 
Wolfe Wave Scanner
Jalitha K Johny
4.5 (2)
Wolfe Waves scanner - It scans all the Symbols and identify the movement of price and it gives confidence in trade. It automatically plots  fifth wave breaks out of the channel. According to the theory behind the pattern, a line drawn from the point at the beginning of the first wave and passing through the beginning of the fourth wave predicts a target price for the end of the fifth wave. If a trader properly identifies a Wolfe Wave as it forms, the beginning of the fifth wave represents an op
Half Trend TPSL Buy Sell Indicator calculates the open and close of the price bars over the selected period of time and applies its own  calculation method to find an average line of the price movement.  ATR based Take Profit and Stop Loss ATR is a measure of volatility over a specified period of time. The most common length is 14, which is also a common length for oscillators, such as the relative strength index (RSI) and stochastics. A higher ATR indicates a more volatile market, while a lowe
An RSI (Relative Strength Index) MT4 (MetaTrader 4) scanner is a tool used in forex trading to identify overbought or oversold conditions across multiple currency pairs and timeframes. The RSI is a momentum oscillator that measures the speed and change of price movements, typically used to identify potential reversal points in the market. Key Features and Functions of an RSI MT4 Scanner: Multiple Timeframe Analysis : The scanner can analyze various timeframes (e.g., 1 minute, 5 minutes, 15 minut
Product Description: MT4 Trade Copier with Advanced Features MT4  Trade Copier is designed to streamline and enhance your trading experience by allowing seamless replication of trades across multiple accounts. It offers advanced features to cater to different trading needs and preferences. Features: Master/Slave Selection: Easily choose between master and slave modes to manage trades effectively. Multiplier for Slave Accounts: Set a multiplier to adjust the size of trades copied to slave a
BB Scanner MT4  is a powerful, next-generation market scanner that detects Bollinger Bands breakouts across multiple symbols and timeframes. It provides a modern, interactive dashboard that displays signals, entry price, target levels, stop loss, and real-time status — all in one place. Key Features Multi-Symbol & Multi-Timeframe Scanning (auto or custom list) Precise BB Breakout Detection (Buy/Sell with ATR-based targets) Automatic Target 1, Target 2, Stop Loss calculation ️ Modern
The Super Trend is one of the best trend-following indicator for MT5 platforms. It's working fine for real-time trend alerts and accurate signals and it help to identify the best market entry and exit positions.  This indicator is the tool you can  refers to a trend following overlays. It contains two major parameters: the period and the multiplier. Besides, traders should consider default values that include 10 for every true range aтd 3 for the multiplier. 2 Types TP SL you set in input Point
A HalfTrend scanner for MT5 (MetaTrader 5) is a technical analysis tool designed to help traders identify trend reversals and trade opportunities in the market. The HalfTrend indicator itself is based on price movements and a specific algorithm that identifies changes in market direction. Here’s a detailed description of an MT5 HalfTrend scanner: Overview The MT5 HalfTrend scanner is an advanced tool that scans multiple currency pairs or financial instruments for potential trend reversal signals
Super Trend Filter Indicator SuperTrend Filter V5.2 MT5 Indicator, as provided in the code, is a custom technical analysis tool designed for  MetaTrader 5 (MT5) to identify market trends, provide trading signals, and display key price levels with a visually appealing interface. Super trend Arrow Consider as a Master Candle, If super trend in Buy signal, then signal candle calculates as master candle  and master candle close above the open candle then calculate filter Buy Arrow.  If super tre
MACD Multi Time Frame Scanner MACD Scanner MT5 is a powerful and easy-to-use dashboard tool that scans the MACD indicator across multiple symbols and multiple timeframes in real-time. It gives you a complete market overview at a glance, helping you spot bullish and bearish MACD crossovers instantly — without switching between charts. 1. Multi-Symbol / Multi-Timeframe Scanning Allow user to set a watchlist (symbols to scan). Scan across multiple timeframes (M1 → MN). Show signals (Bullish / Beari
Filtrer:
Aucun avis
Répondre à l'avis