Quant Trend Cloud

Quant Trend Cloud

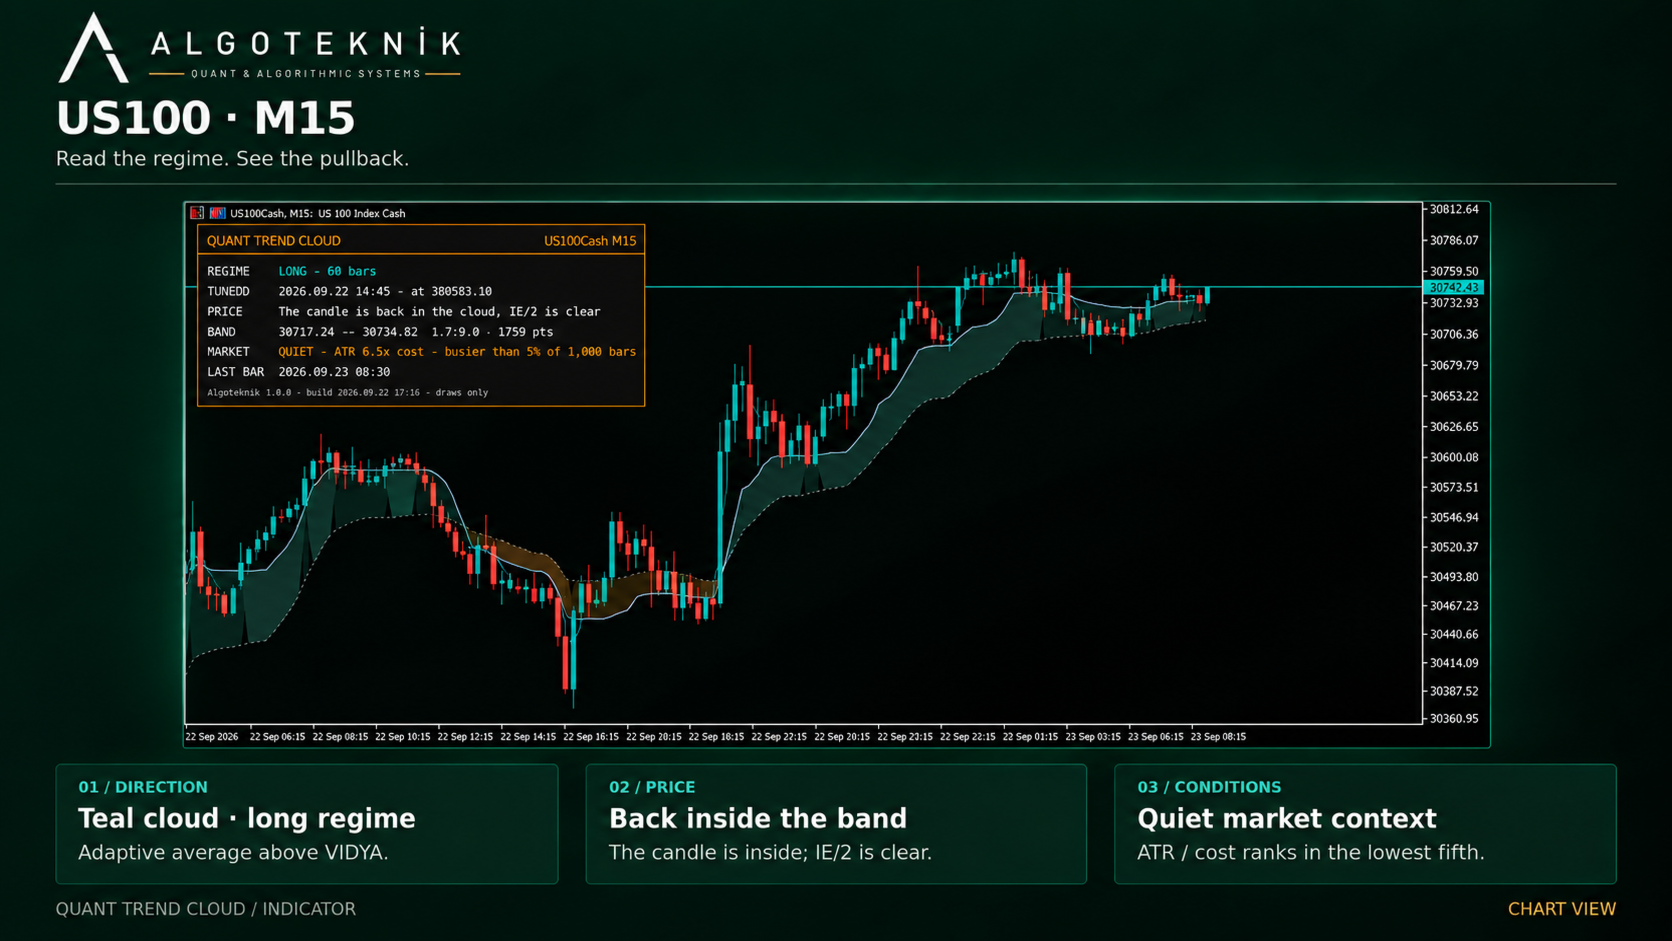
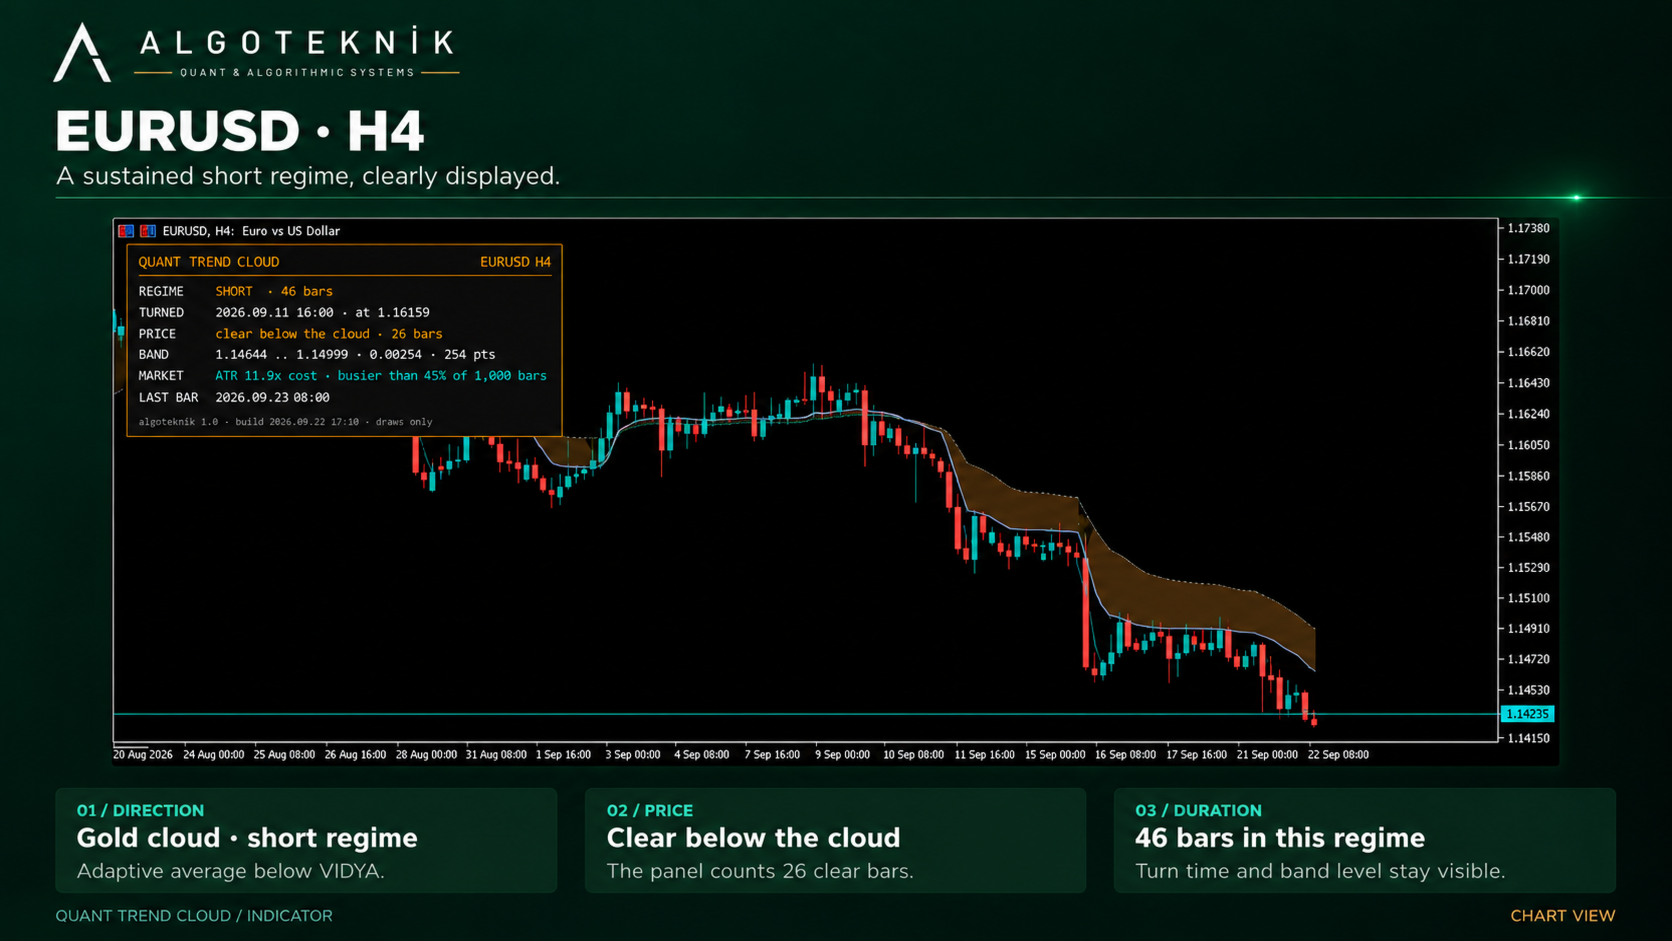
A cloud that is a regime, not a thread: the band between two slow adaptive lines. No arrows and no dots - the colour says which way the regime stands, and the brightness says whether the candle and the fast line stand clear of the band on that bar. Version 1.0.

Release notes, chart examples and new product announcements are posted on the TrendTower channel: https://www.mql5.com/en/channels/trendtower

What It Is

The cloud is the band between Kaufman's adaptive average and VIDYA. Both lines are slow, so the band is a regime: measured on gold M5, M20 and H1 and on EURUSD M5 and H1, it changes colour about twenty times in a thousand bars and a colour lives a median of thirty-odd bars. A third line, IE/2, is drawn over it and stays a line - a band between IE/2 and the average turns over about ninety times in a thousand bars, which is price being followed, not a regime being shown. It holds one veto, below.

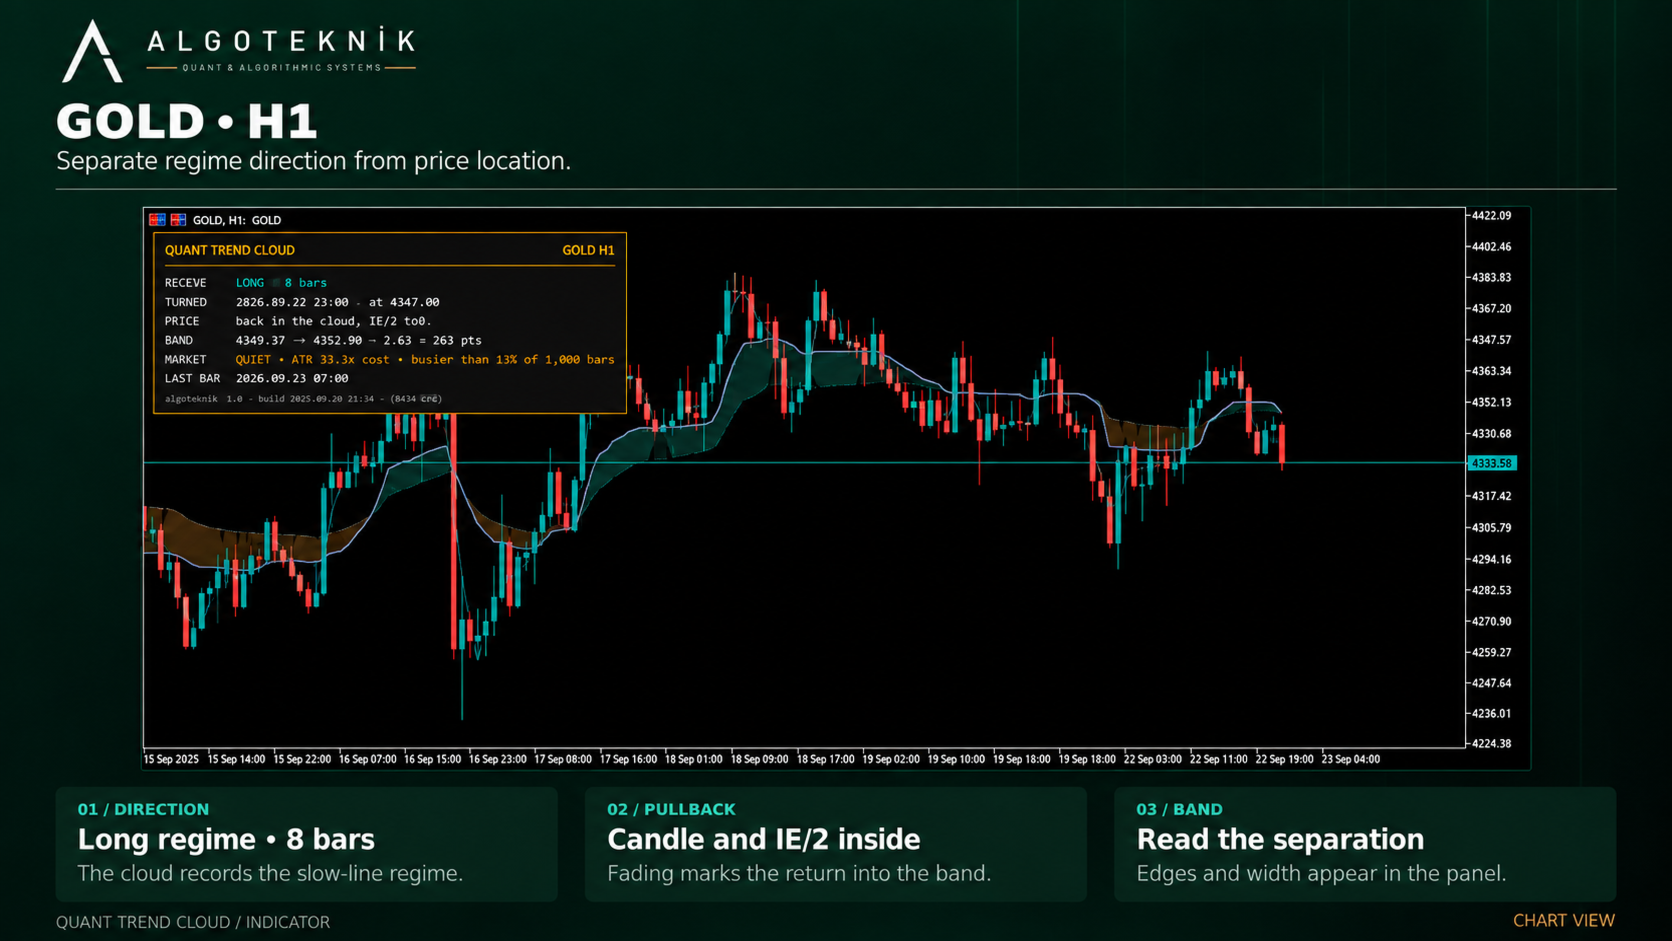
There are no arrows on this chart and no dots. Where the band turns over and where price leaves it are both plain to see, and a mark on top of them is a second opinion nobody asked for. The cloud is drawn in one of two strengths, bar by bar: full colour when the candle opened and closed clear of the whole band, on the cloud's own side, with the IE/2 line clear of it too, and faded when the candle or the line is back inside the band.

The brightness does not confirm a turn. At a crossing the two slow lines are equal, so the band has no thickness, and price - which moved the lines across each other - is already beyond it: measured on seven series (gold M5, M20 and H1, EURUSD M5 and H1, US100 M5, BTCUSD M15), the turn bar itself is already bright on 90 to 93% of turns. What the brightness separates is inside a regime: faded is price that has come back into the band, a pullback, and bright is price standing clear of it.

The line's half of that is a veto, and it is worth knowing what it costs. IE/2 sits a median of a quarter of an ATR from the close - price with the noise taken out - and it is almost never the late one: across gold M5, M20 and H1, EURUSD M5 and H1 and US100 M5 the candle is clear of the band while the line is still inside on four or five bars in a thousand, and those are all the veto removes at the period this ships with - under one in a hundred of the bars where the candle is clear. The traffic the other way is far heavier: on 11% of bars the line is out and the candle is not, and on those bars price joins the line about half the time and the line falls back about half the time. Slow the line to a period of 20 and it removes a third or more of the bars where the candle is clear, at 50 about three quarters - a stricter chart from one number, with the same rule behind it.

So a chart is read in one pass. The colour is which way the two slow lines stand, the brightness is whether the candle and the fast line stand clear of the band on that bar, and the width of the band is how far apart the two slow lines are. The panel writes all of it in words, and every value is published for an expert.

What The Measurement Says

This indicator makes no claim to make money, and the reason the quiet rule exists is worth stating plainly. The numbers below were measured on the crossing this indicator grew out of - IE/2 against the adaptive average, with a VIDYA trend filter - and not on the cloud it draws now, which has not been put through the same test. That crossing was measured on twelve years of gold, M5 resampled to M20, with the spread charged at tick level and one spread per round trip. Taken raw, a crossing's gross move was about a tenth of what it cost. With a trend filter, the gross move per crossing was 0.03 against a cost of 0.62 across 2015-2024, and 2.29 against 0.67 in the volatile, trending market of 2025-2026. Crossings taken while ATR was under twelve times the cost lost money over the whole period.

Twelve is gold's number, and that matters. ATR divided by the cost has a median of 19.6 on gold M20 and 1.3 on EURUSD M5 - the same ratio an order of magnitude apart, because the two markets differ in how much a bar offers per unit of spread. Read as a law, the limit would call a EURUSD M5 chart quiet for ever. So what ships is the same idea as a rank: a market is quiet when the range it offers per unit of cost sits in the lowest fifth of its own last 1,000 bars, which flags 20 to 22 percent of the bars on every series measured - the dead hours, not the cheap symbols. Gold's absolute limit is still in the settings, off by default. On a broker whose history records no spread - some record none at all, and a custom symbol never does - the rank is taken of ATR itself and the panel says so, instead of calling every bar quiet. The quiet market is reported, never hidden.

On The Chart

The cloud's edges are Kaufman's adaptive average, which speeds up in a trend and nearly stops in chop, and a VIDYA line whose step is scaled by how one-sided recent moves were. IE/2 - the integral of the linear regression slope averaged with the regression line, de-biased so its level does not depend on where the chart's history begins - is drawn over them, and has to be clear of the band for a bar to be bright. Hiding the line does not turn that off.

Nothing drawn on a closed bar is ever redrawn. The alerts - the band turning over, and the first bar of that regime where the candle and the line are both clear of it - are read from the last closed bar, once each per regime, whether or not the panel is shown; a fresh attach or a changed setting does not alert for a bar that closed before it. The lines and the cloud do update on the bar that is still forming, as every moving average does, so the colour and brightness of the forming bar are not a signal until it closes.

The Panel

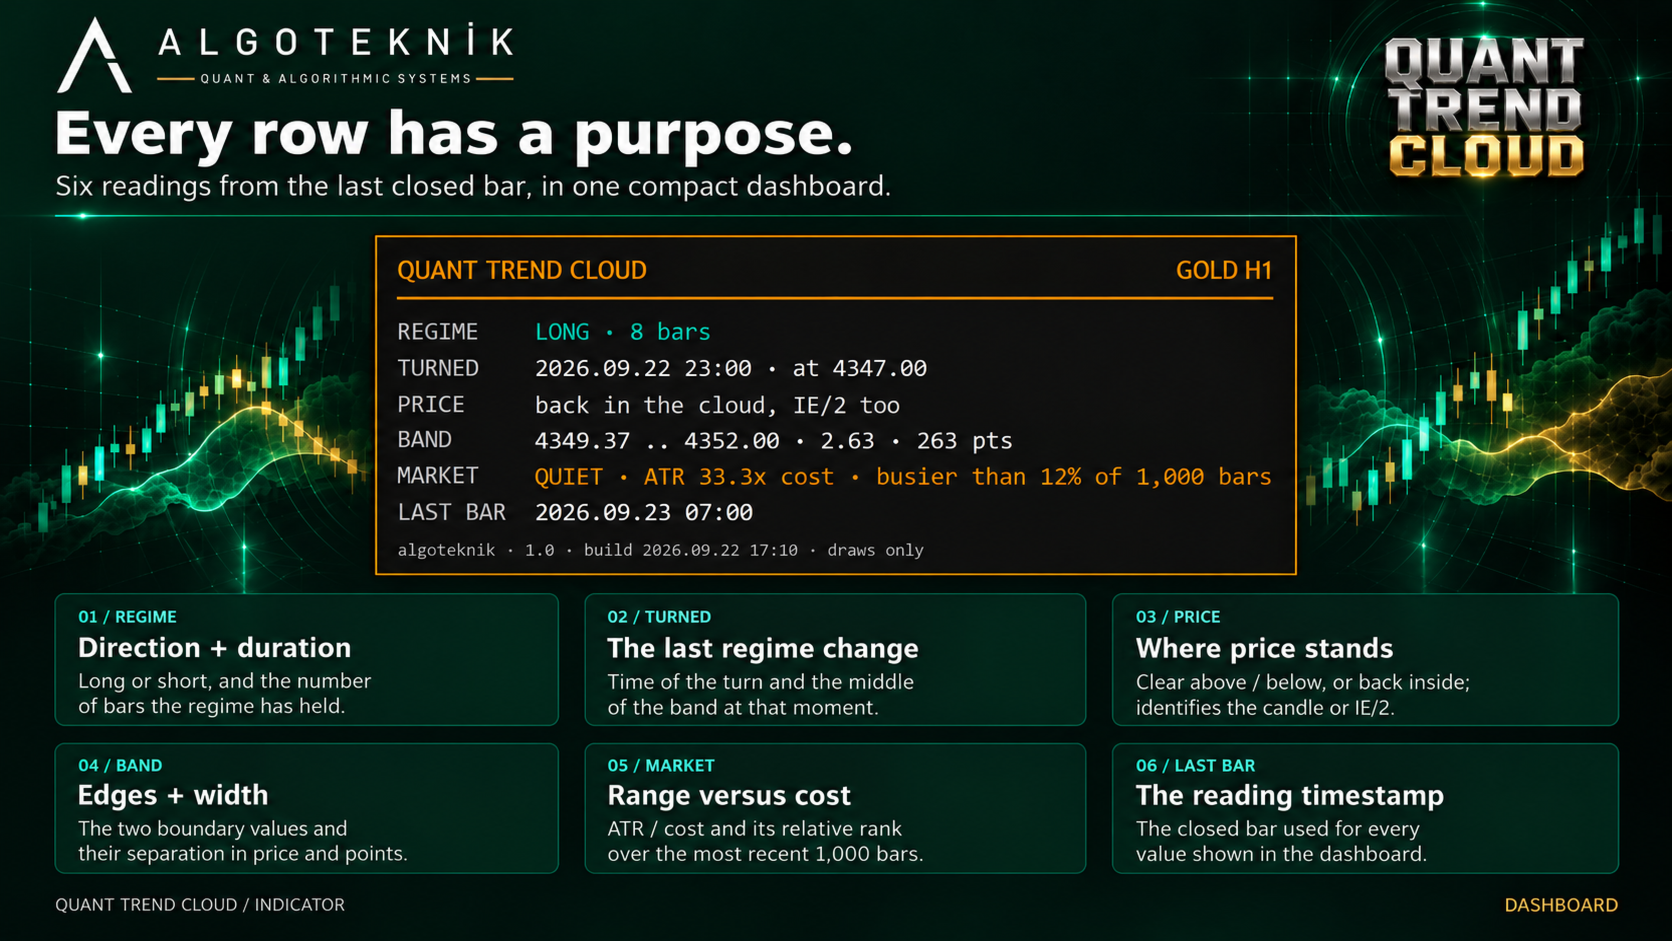
Six rows: the regime and how many bars it has held; when it last turned and the middle of the band at that moment; whether price is clear above or below the cloud and for how long, or - on a faded bar - which half is back in the band, the candle or the line; the two edges of the band and its width in price, in points or in both; ATR as a multiple of the cost with where that stands in the last 1,000 bars; and the closed bar every value was read from. An onyx plate with a gold rule under the header, Trebuchet for the headers and Consolas for the data so the columns line up. Every line is measured with the face that draws it and the plate is as wide as the widest line it holds, so a long value wraps onto a second line and the frame grows with it instead of letting text run past the border. Anchor it to any of the four corners, or drag it with the mouse, and it stays where you put it across restarts.

For Expert Advisors

Every value on the chart is published for iCustom: the three lines, the side of the band, whether the candle and the line are clear of it, where the fast line stands, whether the market is quiet, the ATR-to-cost ratio and its rank. The clear flag is a state of the bar and not a confirmation of the turn - on 90 to 93% of turns it is already on at the turn bar itself, so entering on its first appearance in a new regime is entering on the crossing. Inside a regime it marks the pullbacks: off while price is back in the band, on again where price leaves it. The buffer indexes are listed in the manual.

Settings

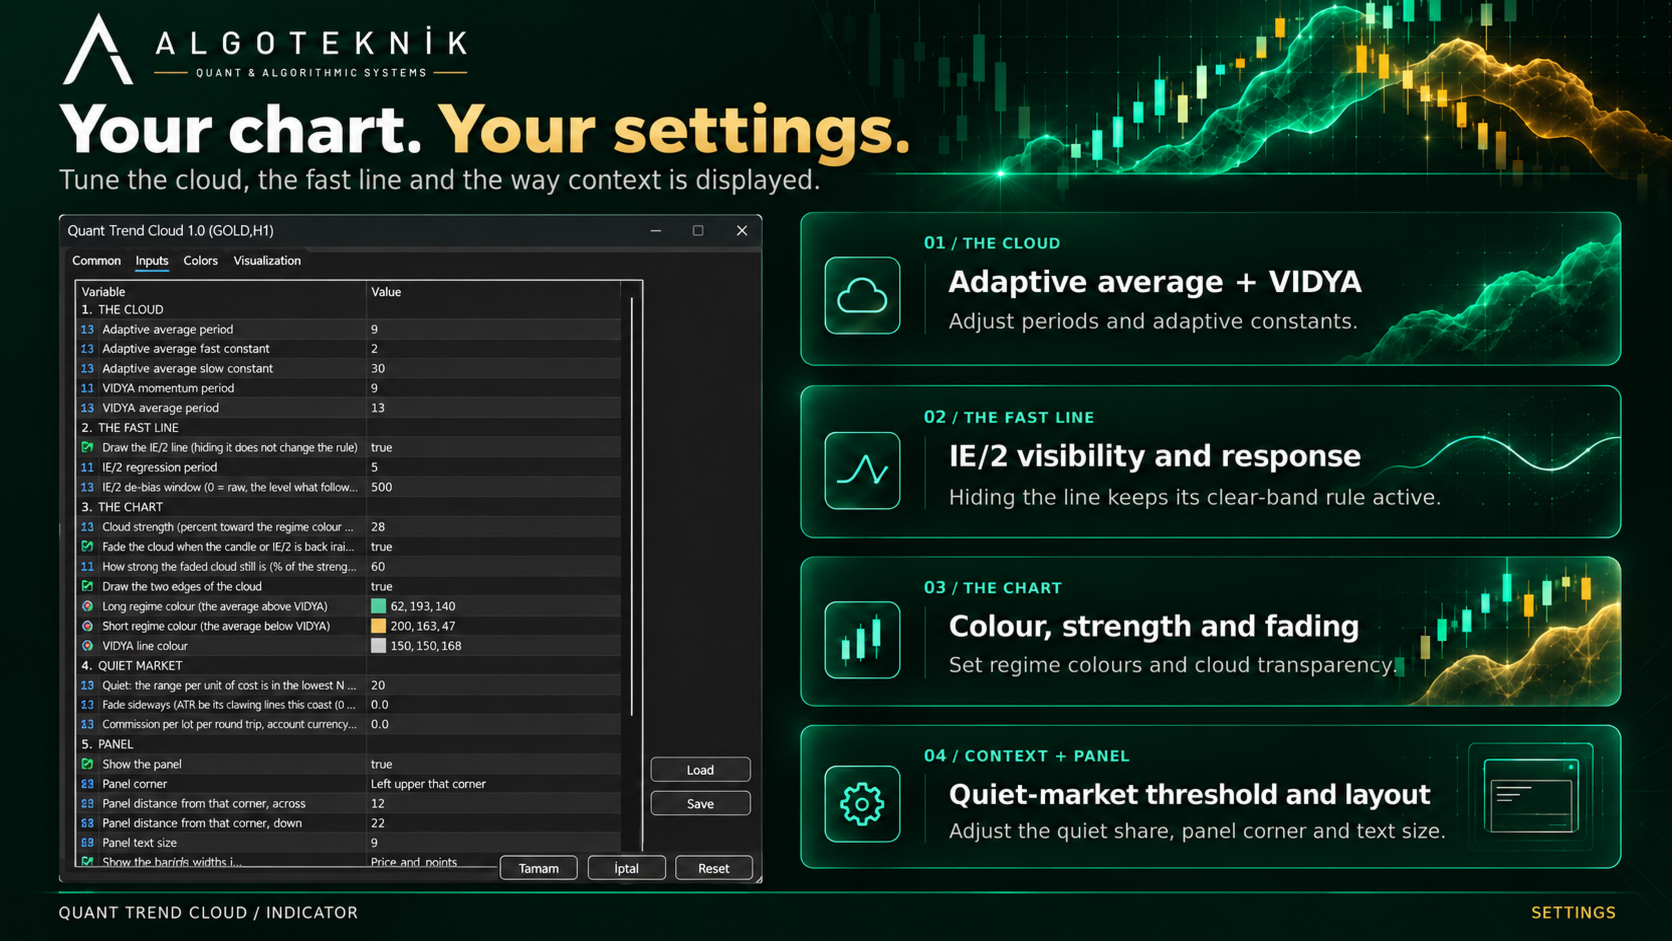
The cloud, the fast line and its veto, the chart, the quiet market, the panel and the alerts. The full reference, one line per setting with the value it ships at, is in the manual that comes with the product.

Attach one copy per chart: the panel's objects are named for the product, not for the copy, so a second copy on the same chart removes the first one's panel. Every period is accepted from 2 to 200, the IE/2 de-bias window from 0 to 5000, the cloud and faded strengths from 0 to 100, the quiet share from 0 to 90 and the panel text size from 7 to 16; anything outside is refused at start, with the limit named.

Questions, bug reports and feature requests are welcome on the TrendTower channel: https://www.mql5.com/en/channels/trendtower

Disclaimer

This is an indicator for analysis and decision support. It does not trade. Past measurement is a description of the past, not a forecast. Always test thoroughly before using any tool with real money. Trading involves risk.

algoteknik

Support, updates and every other product: mql5.com/en/users/bugraky123
Product channel: mql5.com/en/channels/trendtower
Produits recommandés
LT Donchian Channel
Thiago Duarte
4.86 (7)
Donchian Channel is an indicator created by Richard Donchian. It is formed by taking the highest high and the lowest low of the last specified period in candles. The area between high and low is the channel for the chosen period. Its configuration is simple. It is possible to have the average between the upper and lower lines, plus you have alerts when price hits one side. If you have any questions or find any bugs, please contact me. Enjoy!
FREE
Value Chart Candlesticks
Flavio Javier Jarabeck
4.57 (14)
The idea of a Value Chart indicator was presented in the very good book I read back in 2020 , " Dynamic Trading Indicators: Winning with Value Charts and Price Action Profile ", from the authors Mark Helweg and David Stendahl. The idea is simple and the result is pure genius: Present candlestick Price analysis in a detrended way! HOW TO READ THIS INDICATOR Look for Overbought and Oversold levels. Of course, you will need to test the settings a lot to find the "correct" one for your approach. It
FREE
How it works –   Base-departure detection — algorithmically finds consolidation bases (overlapping range with compressed volatility) followed by displacement departures. Patterns: Drop-Base-Rally, Rally-Base-Drop, Rally-Base-Rally, Drop-Base-Drop — detected structurally, not by candle names. –   Strength score (0–100) — from departure velocity, time-at-base, freshness (each revisit decays the score), higher-timeframe confluence and origin volume. –   Lifecycle — Fresh, Tested (decaying), Broken
FREE
Smart Structure Buy Sell Signals is a visual market structure indicator developed primarily for Gold (XAUUSD) intraday trading on MetaTrader 5. The indicator combines market structure, momentum, liquidity behaviour and supply-demand zones to identify potential Buy and Sell opportunities. It provides clear trading levels while keeping the final trading decision completely under the user’s control. This is a manual trading indicator. It does not open, modify or close real trades. Main Features • C
FREE
FX Clock
Abderrahmane Benali
FXClock – Professional Clock Indicator for Traders Please leave a 5 star rating if you like this free tool! Thank you so much :) The FXClock indicator is a practical and simple tool that displays time directly on your trading platform, allowing you to track multiple key pieces of information at the same time. It is specially designed to help traders synchronize their trading with market hours and global sessions. Key Features: Displays the broker server time with precision. Displays your local c
FREE
MACD Enhanced
Nikita Berdnikov
4 (4)
Introducing the MACD  Enhanced – an advanced MACD (Moving Average Convergence Divergence) indicator that provides traders with extended capabilities for trend and momentum analysis in financial markets. The indicator uses the difference between the fast and slow exponential moving averages to determine momentum, direction, and strength of the trend, creating clear visual signals for potential entry and exit points. Attention! To achieve the best results, it is recommended to adapt the indicator
FREE
TradeVision Pro
Ian Nganga Comba
TradeVisonPro Forex Analyzer Pro Tableau de bord d’analyse et de suivi des comptes de trading MT5 TradeVisonPro Forex Analyzer Pro est une solution d’analyse du trading et de suivi des comptes conçue pour les utilisateurs de MetaTrader 5. Le produit organise les données de trading MT5 dans un tableau de bord web structuré, permettant aux traders de consulter les informations du compte, de surveiller les positions ouvertes, d’analyser l’historique des transactions, de suivre les stratégies, de te
FREE
Girassol Sunflower MT5 Indicator
Saullo De Oliveira Pacheco
3.86 (7)
This is the famous Sunflower indicator for Metatrader5. This indicator marks possible tops and bottoms on price charts. The indicator identifies tops and bottoms in the asset's price history, keep in mind that the current sunflower of the last candle repaints, as it is not possible to identify a top until the market reverses and it is also not possible to identify a bottom without the market stop falling and start rising. If you are looking for a professional programmer for Metatrader5, please
FREE
QuantMatrix Candle Patterns is a free MetaTrader 5 indicator designed to identify classic candlestick formations directly on the chart. The indicator analyzes completed candles and detects recognized bullish, bearish and neutral price-action patterns. When a valid bullish or bearish formation is confirmed, the corresponding BUY or SELL signal is displayed on the following candle . This means the signal is only generated after the source pattern has been completed. The indicator also displays a c
FREE
Donchian Breakout And Rsi
Mattia Impicciatore
4.5 (2)
Description générale Cet indicateur est une version améliorée du Canal Donchian classique, enrichie de fonctionnalités pratiques pour le trading réel. En plus des trois lignes standard (supérieure, inférieure et ligne médiane), le système détecte les cassures et les affiche visuellement avec des flèches sur le graphique, en montrant uniquement la ligne opposée à la direction actuelle de la tendance pour une lecture plus claire. L’indicateur comprend : Signaux visuels : flèches colorées lors des
FREE
Friend of the Trend: Your Trend Tracker Master the market with Friend of the Trend , the indicator that simplifies trend analysis and helps you identify the best moments to buy, sell, or wait. With an intuitive and visually striking design, Friend of the Trend analyzes price movements and delivers signals through a colorful histogram: Green Bars : Signal an uptrend, indicating buying opportunities. Red Bars : Alert to a downtrend, suggesting potential selling points. Orange Bars : Represent cons
FREE
Follow The Line MT5
Oliver Gideon Amofa Appiah
4.6 (35)
This indicator obeys the popular maxim that: "THE TREND IS YOUR FRIEND" It paints a GREEN line for BUY and also paints a RED line for SELL. (you can change the colors). It gives alarms and alerts of all kinds. IT DOES NOT REPAINT and can be used for all currency pairs and timeframes. Yes, as easy and simple as that. Even a newbie can use it to make great and reliable trades. NB: For best results, get my other premium indicators for more powerful and reliable signals. Get them here: https://www.m
FREE
VFI Quantum
Nikita Berdnikov
5 (1)
Introducing VFI (Volume Flow Indicator) – a trading indicator that analyzes the relationship between volume and price movement to identify key trading opportunities. The indicator displays the strength and direction of volume flow, providing clear signals about potential entry and exit points. Signals are formed based on zero line crossovers, crossovers between the VFI line and its exponential moving average (EMA), and when the indicator exits overbought and oversold zones. Attention! This stra
FREE
PROMETHEUS TECHNICAN VERSION Free | By THE SONS A gift from The Sons — no strings, no trial, no expiry. Every trader deserves access to professional-grade market intelligence. That belief is why Prometheus Technical Version exists, and why it costs nothing. Consider it our handshake to the trading community. What You're Getting This is not a simplified tool dressed up as a gift. Prometheus Technican Version is a fully built, institutional-quality technical analysis indicator running a dual-model
FREE
VolumeBasedColorsBars
Henrique Magalhaes Lopes
VolumeBasedColorsBars — Free Powerful Volume Analysis for All Traders Unlock the hidden story behind every price bar! VolumeBasedColorsBars is a professional-grade, 100% FREE indicator that colorizes your chart candles based on real, adaptive volume analysis. Instantly spot surges in market activity, identify exhaustion, and catch the moves that matter. This indicator gives you:    • Dynamic color-coded bars for instant volume context    • Adaptive thresholds based on historical, session-awar
FREE
Free automatic Fibonacci is an indicator that automatically plots a Fibonacci retracement based on the number of bars you select on the BarsToScan setting in the indicator. The Fibonacci is automatically updated in real time as new highest and lowest values appears amongst the selected bars. You can select which level values to be displayed in the indicator settings. You can also select the color of the levels thus enabling the trader to be able to attach the indicator several times with differe
FREE
Pivot Points Indicator – a fast, reliable, and fully customizable pivot detection for MetaTrader 5. This indicator uses MetaTrader’s native iHighest and iLowest functions to identify pivot highs and lows by scanning for the highest and lowest prices within a user-defined window of bars. A pivot is confirmed only when the current bar is the absolute maximum or minimum within the selected range, ensuring accurate and timely signals based on robust built-in logic. Key Features No Repainting : Onc
FREE
L'indicateur de cadre temporel Wormhole pour MetaTrader 5 (MT5) n'est pas simplement un autre outil de trading, c'est votre avantage concurrentiel sur les marchés financiers. Conçu pour les traders novices et professionnels, le Wormhole transforme la manière dont vous analysez les données et prenez des décisions, vous assurant ainsi de toujours être un pas en avant. Pourquoi vous avez besoin de l'indicateur Wormhole (gratuit) Surpassez la concurrence : La possibilité d'afficher deux cadres tempo
FREE
Spike Catch Pro
Amani Fungo
4.14 (7)
Spike Catch Pro 22:03 release updates Advanced engine for searching trade entries in all Boom and Crash pairs (300,500 and 1000) Programmed strategies improvements Mx_Spikes (to combine Mxd,Mxc and Mxe), Tx_Spikes,   RegularSpikes,   Litho_System,   Dx_System,   Md_System,   MaCross,   Omx_Entry(OP),  Atx1_Spikes(OP),   Oxc_Retracement (AT),M_PullBack(AT) we have added an arrow on strategy identification, this will help also in the visual manual backtesting of the included strategies and see ho
FREE
Are you tired of drawing trendlines every time you're analyzing charts? Or perhaps you would like more consistency in your technical analysis. Then this is for you. This indicator will draw trend lines automatically when dropped on a chart. How it works Works similar to standard deviation channel found on mt4 and mt5. It has 2 parameters: 1. Starting Bar 2. Number of bars for calculation The   starting bar   is the bar which drawing of the trend lines will begin, while the   number of bars for c
FREE
HCS SessionPulse
HADDEN CAPITAL SOLUTIONS LLC
HCS SessionPulse is a free, read-only global trading session monitor for MetaTrader 5. A compact on-chart panel shows the current status of the Sydney, Tokyo, London, and New York trading sessions and continuously counts down to upcoming session transitions. SessionPulse displays: • Sydney session OPEN/CLOSED status • Tokyo session OPEN/CLOSED status • London session OPEN/CLOSED status • New York session OPEN/CLOSED status • Time remaining until each session's next open or close • Currently
FREE
Tabajara V5
Flavio Javier Jarabeck
4.84 (37)
Metatrader 5 version of the famous Andre Machado's Tabajara indicator. If you don't know Andre Machado's Technical Analysis work you don't need this indicator... For those who need it and for those several friend traders who asked this porting from other platforms, here it is... FEATURES 8-period Moving Average 20-period Moving Average 50-period Moving Average 200-period Moving Average Colored candles according to the inflexion of the 20-period MA SETTINGS You can change the Period of all MA's
FREE
Super Trend eu
Emin Ulucanli
4.83 (6)
SUPERTREND ; C'est un indicateur de suivi de tendance basé sur l'ATR SuperTrend créé par Olivier Seban. Il peut être utilisé pour détecter les changements de direction de la tendance et localiser les arrêts. Lorsque le prix tombe en dessous de la courbe indicatrice, il devient rouge et indique une tendance à la baisse. À l'inverse, lorsque le prix se déplace au-dessus de la courbe, l'indicateur passe au vert, indiquant une tendance haussière. Comme d'autres indicateurs, il fonctionne bien sur Su
FREE
Trade Behavior Mirror lit uniquement l'historique des transactions déjà clôturées de votre propre compte et compte un seul phénomène précis : l'ouverture d'une nouvelle position peu après une perte réalisée, avec un lot plus important que votre volume habituel. L'outil ne prédit rien et ne conseille rien. Chaque chiffre du panneau correspond à quelque chose qui s'est déjà produit sur ce compte. Comment les chiffres sont construits : l'outil lit jusqu'à 31 jours de transactions clôturées, tous s
FREE
WH Price Wave Pattern MT5
Wissam Hussein
4.15 (13)
Bienvenue dans notre   modèle de vague de prix   MT5 -- (modèle ABCD) -- Le modèle ABCD est un modèle de trading puissant et largement utilisé dans le monde de l'analyse technique. Il s'agit d'un modèle de prix harmonique que les commerçants utilisent pour identifier les opportunités potentielles d'achat et de vente sur le marché. Avec le modèle ABCD, les traders peuvent anticiper les mouvements de prix potentiels et prendre des décisions éclairées sur le moment d'entrer et de sortir des trans
FREE
PZ Three Drives MT5
PZ TRADING SLU
2.83 (6)
This indicator finds Three Drives patterns. The Three Drives pattern is a 6-point reversal pattern characterised by a series of higher highs or lower lows that complete at a 127% or 161.8% Fibonacci extension. It signals that the market is exhausted and a reversal can happen. [ Installation Guide | Update Guide | Troubleshooting | FAQ | All Products  |  Get Help ] Customizable pattern sizes Customizable colors and sizes Customizable breakout periods Customizable 1-2-3 and 0-A-B ratios It impl
FREE
Reversal Composite Candles
MetaQuotes Ltd.
3.69 (16)
The idea of the system is to indentify the reversal patterns using the calculation of the composite candle. The reversal patterns is similar to the "Hammer" and "Hanging Man" patterns in Japanese candlestick analysis. But it uses the composite candle instead the single candle and doesn't need the small body of the composite candle to confirm the reversal. Input parameters: Range - maximal number of bars, used in the calculation of the composite candle. Minimum - minimal size of the composite can
FREE
XAU VWAP Mean Reversion H4 Expert Advisor for MetaTrader 5 — Gold / XAUUSD focus Version: 1.00 What it is XAU VWAP Mean Reversion H4 is an Expert Advisor for gold on the H4 chart. Intraday VWAP mean-reversion style participation on gold H4. Built for structured automated participation — not grid , not martingale . Evaluate on your broker and risk profile before any live use. This product is a technical system . Exact thresholds and entry equations remain internal product design and are not publ
FREE
TLC MACD Multi-Timeframe plots a real MACD from a higher timeframe directly on your current chart, without you having to flip back and forth between windows. Most "multi-timeframe" MACD indicators fake it by just using a longer period on your current timeframe. This one doesn't do that. It reads the actual MACD from the timeframe you choose (daily, for example) and holds that same reading across every bar on your chart until the next higher-timeframe bar actually closes. So what you see is exa
FREE
QuantumAlert RSI Navigator is a free indicator available for MT4/MT5 platforms, its work is to provide "alerts" when the market is inside "overbought and oversold" regions in the form of "buy or sell" signals. This indicator comes with many customization options mentioned in the parameter section below, user can customise these parameters as needful. Join our MQL5 group , where we share important news and updates. You are also welcome to join our private channel as well, contact me for the priva
FREE
Les acheteurs de ce produit ont également acheté
SMART TREND TRADING SYSTEM — OFFRE SPÉCIALE Votre système de trading. Votre EA d’automatisation. Votre formation et votre accompagnement. Achetez Smart Trend Trading System pour MT5 à 99 USD et recevez Smart Universal Expert Advisor GRATUITEMENT pour automatiser ses signaux. STTS réunit la direction de la tendance, les signaux d’entrée et de sortie, les zones de retournement et les niveaux de prix importants directement sur votre graphique. Suivez le système manuellement ou connectez l’EA inclus
Trend Sniper X
Sarvarbek Abduvoxobov
4.9 (39)
Trend Sniper X est un indicateur de suivi de tendance multi-unités de temps pour MetaTrader 5 qui aide les traders à identifier la direction de la tendance et les points d'inversion potentiels avec clarté et précision. pour MT4: https://www.mql5.com/en/market/product/193245 Informations sur le prix : Le prix actuel est un prix promotionnel et est susceptible de changer lors des prochaines mises à jour et nouvelles fonctionnalités. Offre bonus : Pour obtenir GRATUITEMENT l'Auto-Trade Assistant E
Neuro Poseidon MT5
Daria Rezueva
4.75 (53)
Neuro Poseidon is a new indicator by Daria Rezueva. It combines precise trading signals with adaptive TP/SL levels - creating best possible trades as a result! Message me and get  Neuro Poseidon Assistant  as a gift to automize your trading process! What makes it stand out? 1. Proven profitability on all assets and timeframes 2. Only confirmed BUY and SELL signals present on the chart 3. Adaptive TP & SL levels generated by the software for each trade 4. Easy to understand - suitable for al
Unix Scalper
Issam Kassas
5 (3)
UNIX SCALPER — OFFRE SPÉCIALE Repérez la configuration. Consultez le plan. Choisissez comment intervenir. Achetez UNIX Scalper pour MT5 à 99 USD et recevez Smart Universal Expert Advisor GRATUITEMENT pour automatiser ses signaux. UNIX Scalper réunit l’analyse du marché, les décisions BUY/SELL/WAIT et les niveaux Entry, Stop Loss, TP1 et TP2 dans un panneau organisé. Suivez le plan de trading manuellement ou connectez l’EA inclus pour une exécution automatique selon vos paramètres. Le prix actuel
Zoryk Gold
Reda El Koutbane
5 (12)
ZORYK — Système avancé de signaux XAUUSD pour MetaTrader 5 Vous connaissez certainement cette sensation. Vous passez du temps à analyser l’or. Vous attendez le bon point d’entrée. Vous ouvrez enfin la position, puis le prix commence immédiatement à évoluer contre vous. Vous fermez trop tôt, déplacez le Stop Loss ou hésitez pendant quelques secondes. Ensuite, le marché atteint exactement l’objectif que vous aviez initialement prévu, mais sans vous dans la position. Le problème n’était pas toujour
Commençons par être honnêtes. Aucun indicateur ne vous rendra rentable à lui seul. Si quelqu’un vous dit le contraire, il vous vend un rêve. Tout indicateur qui affiche des flèches parfaites d’achat/vente peut être rendu impeccable — il suffit de zoomer sur la bonne partie de l’historique et de capturer uniquement les trades gagnants. Nous ne faisons pas cela.  SMC Intraday Formula est un outil. Il lit la structure du marché pour vous, identifie les zones de prix à la probabilité la plus élevée
SuperScalp Pro
Van Minh Nguyen
4.65 (34)
SuperScalp Pro - Professional Multi-Layer Confluence Scalping System SuperScalp Pro est un indicateur avancé de scalping qui améliore le Supertrend classique grâce à plusieurs filtres intelligents de confirmation. Il aide à identifier des opportunités de Buy/Sell présentant une probabilité plus élevée, tout en réduisant considérablement les faux signaux. Des flèches Buy et Sell claires apparaissent directement sur le graphique, tandis que les niveaux de Stop Loss et Take Profit basés sur l’ATR s
M1 Sniper MT5
Oleg Rodin
5 (7)
M1 SNIPER   est un système d'indicateurs de trading facile à utiliser. Il s'agit d'un indicateur à flèche conçu pour l'unité de temps M1. Cet indicateur peut être utilisé seul pour le scalping sur l'unité de temps M1 ou intégré à votre système de trading existant. Bien que conçu spécifiquement pour le trading sur l'unité de temps M1, ce système peut également être utilisé avec d'autres unités de temps. Initialement, j'avais conçu cette méthode pour le trading du XAUUSD et du BTCUSD. Cependant, j
Reversion King Indicator
Eugen-alexandru Zibileanu
5 (9)
Un nouveau Roi en ville - Indicateur + Gestion des ordres (TP1 + TP2 + TP3) + Envoi optionnel de signaux Telegram INCLUS (GRATUIT) (SYSTÈME COMPLET DE TRADING et DE SIGNAUX) Notre meilleur EA pour l’Or : Gold Slayer Cet indicateur inclut une stratégie avancée, un système de trading avec gestion des ordres personnalisable ainsi qu’un système de retour à la moyenne combinant des extensions d’enveloppes, soutenu par plusieurs filtres intelligents de confirmation comme le RSI afin de détecter des en
Gann Made Easy   est un système de trading Forex professionnel et facile à utiliser qui est basé sur les meilleurs principes de trading en utilisant la théorie de mr. WD Gann. L'indicateur fournit des signaux d'ACHAT et de VENTE précis, y compris les niveaux Stop Loss et Take Profit. Vous pouvez échanger même en déplacement en utilisant les notifications PUSH. VEUILLEZ ME CONTACTER APRÈS L'ACHAT POUR RECEVOIR GRATUITEMENT DES INSTRUCTIONS DE TRADING ET D'EXCELLENTS INDICATEURS SUPPLÉMENTAIRES! V
GoldenX Entry MT5
Kareem Abbas
5 (16)
GoldenX Entry est un indicateur MT5 doté d’un algorithme adaptatif Smart Entry Trend, d’un système de scoring des signaux, d’un détecteur de régime de marché et d’un filtre de volatilité. Chaque signal inclut un niveau d’entrée calculé, trois niveaux de Take-Profit (TP1, TP2, TP3) ainsi qu’un niveau de Stop-Loss. Il est construit sur plusieurs couches analytiques conçues pour s’adapter à différentes conditions de marché, combinant un système analytique multicouche avec un optimiseur intégré et u
La légende est de retour : Entry Points Pro 10. La relance de l'indicateur légendaire qui s'est maintenu 3 ans dans le Top-3 du MQL5 Market. Des centaines d'avis enthousiastes (589 sur les deux versions), des milliers de traders l'utilisent chaque jour, 31 000+ téléchargements de la démo   MT4+MT5 . J'ai lu chacun de vos avis publiés en cinq ans — et au lieu de promettre, j'ai intégré les réponses directement dans la version 10. Par un auteur présent sur les marchés depuis 1999, qui tient à l'ho
Welcome to ENTRY IN THE ZONE AND SMC MULTI TIMEFRAME Entry In The Zone and SMC Multi Timeframe is a real-time market analysis tool based on Smart Money Concepts (SMC), designed to analyze market structure, price direction, and key trading zones. It supports both Single-Timeframe Analysis and Multi-Timeframe Analysis, providing a clearer view of the overall market structure across multiple timeframes, with real-time BUY / SELL signals that do not repaint. It is designed to help filter trading opp
Gold Entry Sniper
Tahir Mehmood
5 (20)
Gold Entry Sniper – Tableau de Bord ATR Multi-Unités de Temps pour Scalping et Swing Trading sur l'Or Gold Entry Sniper est un indicateur avancé pour MetaTrader 5 qui fournit des signaux d'achat/vente précis sur XAUUSD et autres actifs, basé sur la logique de Trailing Stop ATR et l' analyse multi-unités de temps . Caractéristiques et Avantages Clés Analyse Multi-Unités de Temps – Affiche les tendances en M1, M5, M15 sur un seul tableau. Trailing Stop Basé sur l'ATR – Ajuste automatiquement selon
Tokyo mt5 Indicator
Vasiliy Strukov
5 (1)
Le Tokyo Indicator offre une vue d'ensemble visuelle et claire de l'orientation de la tendance, des signaux de trading potentiels et des conditions du marché. Sa ligne de tendance en escalier, codée par couleur, distingue les phases haussières (en bleu) des phases baissières (en magenta). Des flèches directionnelles associées mettent en évidence les opportunités d'achat et de vente potentielles lors des changements de tendance. Un tableau de bord intégré regroupe le signal actuel, l'orientation
Market Structure Order Block Dashboard MT5 est un indicateur MT5 conçu pour les traders qui veulent lire la structure de marché et les principales zones de réaction du prix directement sur le graphique. Il combine BOS, ChoCH, Order Blocks, Fair Value Gaps (FVG), Liquidité, Kill Zones, Volume Profile, et un dashboard compact pour une analyse rapide. Cet indicateur s'adresse aux traders qui utilisent la structure de marché, les concepts ICT et Smart Money comme cadre de décision. Il peut aider à r
FiboSniper Pro
Van Minh Nguyen
5 (3)
FiboSniper Pro – Multi-Filter Fibonacci System with Auto SL/TP and Control Panel FiboSniper Pro est un indicateur technique qui combine des Fibonacci Envelopes dynamiques avec plusieurs filtres de confirmation afin de générer des signaux Buy et Sell sélectionnés. Les niveaux de Fibonacci sont calculés à partir de Moving Average et ATR, puis filtrés par ADX, EMA, RSI, ATR, Volume, Time et la structure des bougies. L’indicateur affiche directement sur le graphique les niveaux automatiques de Stop
Adaptive Price Action Engine Achetez un indicateur, obtenez l'EA gratuitement Analyse auto-optimisée des tendances et des figures de chandeliers Multi-Timeframe Les marchés évoluent constamment, et tous les modèles de Price Action n’ont pas la même valeur dans toutes les conditions de marché. Adaptive Price Action Engine a été conçu pour s’adapter aux changements du marché en combinant structure de tendance, analyse Multi-Timeframe, figures de chandeliers et optimisation statistique au sein d’un
Currency Strength Wizard   est un indicateur très puissant qui vous offre une solution tout-en-un pour un trading réussi. L'indicateur calcule la puissance de telle ou telle paire de devises en utilisant les données de toutes les devises sur plusieurs périodes. Ces données sont représentées sous la forme d'un indice de devise facile à utiliser et de lignes électriques de devise que vous pouvez utiliser pour voir la puissance de telle ou telle devise. Tout ce dont vous avez besoin est d'attacher
Divergence Bomber
Ihor Otkydach
4.89 (94)
Chaque acheteur de cet indicateur reçoit également gratuitement : L’outil exclusif « Bomber Utility », qui accompagne automatiquement chaque opération de trading, fixe les niveaux de Stop Loss et de Take Profit, et clôture les positions selon les règles de la stratégie Des fichiers de configuration (set files) pour adapter l’indicateur à différents actifs Des set files pour configurer le Bomber Utility selon différents modes : « Risque Minimum », « Risque Équilibré » et « Stratégie d’Attente »
Atomic Analyst MT5
Issam Kassas
4.45 (58)
ATOMIC ANALYST — OFFRE SPÉCIALE Votre analyse de marché. Votre EA d’automatisation. Votre formation et votre accompagnement. Achetez Atomic Analyst pour MT5 à 99 USD et recevez Smart Universal Expert Advisor GRATUITEMENT pour automatiser ses signaux. Atomic Analyst réunit l’action des prix, la direction de la tendance, les signaux d’entrée et de sortie, le Stop Loss et plusieurs niveaux de Take Profit directement sur votre graphique. Tradez manuellement à l’aide de son analyse ou connectez l’EA
SMART PRICE ACTION CONCEPTS — OFFRE SPÉCIALE Observez la structure. Identifiez les zones. Construisez votre plan de trading. Achetez Smart Price Action Concepts pour MT5 à 49 USD et recevez Smart Universal Expert Advisor GRATUITEMENT. Réunissez Smart Money Concepts (SMC), analyse de style ICT et action des prix sur un graphique organisé. Identifiez la structure du marché, les blocs d’ordres, les niveaux de référence de liquidité et les déséquilibres, puis choisissez les éléments à afficher avec
Axiom Matrix
Issam Kassas
5 (8)
Axiom Matrix — OFFRE SPÉCIALE Achetez Axiom Matrix pour 49 USD et recevez Smart Universal Expert Advisor GRATUITEMENT. Explorez le marché. Comparez les configurations. Choisissez votre graphique. Axiom Matrix réunit l’analyse de plusieurs symboles et unités de temps dans un tableau de bord. Repérez où concentrer votre attention sans ouvrir chaque graphique. Analysez les symboles de l’Observation du marché ou votre sélection sur plusieurs unités de temps. Comparez tendance, momentum, volume, vola
Superhero
Ihor Otkydach
5 (3)
L'indicateur SUPERHERO est un système de trading multidevises conçu selon un principe « tout compris ». Cet indicateur analyse le marché de manière autonome et fournit des signaux indiquant quand ouvrir et clôturer des positions. Il utilise des ordres Stop Loss et Take Profit. Le rapport R:R est de 1:1. Ce système peut envoyer des notifications push sur votre smartphone, ce qui vous permet de passer des ordres « où que vous soyez », sans avoir à rester devant un ordinateur. C'est la solution idé
Volatility Master for MetaTrader is a real-time dashboard tool that scans up to  50 symbols  to identify high-volatility , trending markets instantly. With bullish/bearish signals, customizable alerts, and a user-friendly interface, it helps you avoid range-bound conditions and focus on high-probability trades. Clarity leads to confidence. Trade confidently and protect your capital effectively with this powerful dashboard. We don't offer free or bonus indicators in exchange of reviews from you.
CRT Candle Range Theory HTF MT5 - Ultimate CRT Indicator : Concepts ICT avancés et système de trading Malaysian SnR Maîtrisez les traces des Market Makers avec l'indicateur Candle Range Theory le plus avancé. Libérez la véritable puissance des Smart Money Concepts (SMC) et tradez avec la même précision que les institutions grâce à l'Ultimate CRT Indicator. Conçu exclusivement pour les traders sérieux, cet indicateur automatise la théorie CRT, un pilier central des concepts ICT (Inner Circle Trad
Power Candles MT5
Daniel Stein
4.58 (12)
Power Candles V3 - Indicateur de force à optimisation automatique Power Candles V3 transforme la force des devises et des instruments en un plan de trading exploitable sur chaque graphique auquel il est associé. Au lieu de se contenter de colorer les bougies, il effectue une optimisation automatique en temps réel en arrière-plan et vous fournit les meilleurs niveaux de Stop Loss, Take Profit et seuils de signal pour le symbole que vous avez sous les yeux. Un simple clic suffit pour l'adopter en
Trend Catcher ind mt5
Ramil Minniakhmetov
5 (18)
INDICATEUR DE DÉTECTEUR DE TENDANCE L'indicateur de détecteur de tendance analyse les mouvements de prix du marché grâce à une combinaison d'indicateurs d'analyse de tendance adaptatifs, propriétaires et personnalisés. Il identifie la véritable direction du marché en filtrant les fluctuations à court terme et en se concentrant sur la force de la dynamique sous-jacente, l'expansion de la volatilité et la structure des prix. Il utilise également une combinaison d'indicateurs personnalisés de lis
IQ FX Gann Levels a precision trading indicator based on W.D. Gann’s square root methods . It plots real-time, non-repainting support and resistance levels to help traders confidently spot intraday and scalping opportunities with high accuracy. William Delbert Gann (W.D. Gann) was an exceptional market analyst, whose trading technique was based on a complex blend of mathematics, geometry, astrology, and ancient mathematics which proved to be extremely accurate. We don't offer free or bonus indic
RelicusRoad Pro MT5
Relicus LLC
4.96 (24)
RelicusRoad Pro : Système d'Exploitation Quantitatif du Marché 70% DE RÉDUCTION ACCÈS À VIE (DURÉE LIMITÉE) - REJOIGNEZ 2 000+ TRADERS Pourquoi la plupart des traders échouent-ils même avec des indicateurs "parfaits" ? Parce qu'ils tradent des concepts isolés dans le vide. Un signal sans contexte est un pari. Pour gagner, il faut de la CONFLUENCE . RelicusRoad Pro est un Écosystème Quantitatif complet . Il cartographie la "Fair Value Road", distinguant le bruit des cassures structurelles. Arrête
Plus de l'auteur
Smart Chandelier Exit
Bugra Kaan Yildirim
5 (3)
Smart Chandelier Exit  Smart Chandelier Exit is an adaptive trailing-stop and trend-direction indicator. It plots a multi-layer ratchet stop line that follows price: green below price in an uptrend, red above price in a downtrend. The line only ever ratchets in the trend's favor, never against it, so it doubles as a mechanical trailing stop and a clear trend-state signal. What makes it smart is the built-in Pearson R trend-quality filter. A raw stop line tells you where the stop is; the Pearson
FREE
Refine OBV
Bugra Kaan Yildirim
Refine OBV  Refine OBV measures cumulative volume flow read against its own adaptive signal line with a color-coded spread and non-repainting divergence detection. Raw On Balance Volume answers one question: is volume being credited to the buyers or the sellers? While useful, raw OBV is a single wandering line with no reference point. Refine OBV adds an adaptive EMA of the flow itself as a reference line. The distance between the flow and its signal line (the spread) is rendered as a color-coded
FREE
Smart Exit EA
Bugra Kaan Yildirim
Smart Exit EA — Ride the Trend, Skip the Chop Smart Exit EA follows a trend with an adaptive ATR trailing line and stays in the move until the trend really turns. It is built for two problems every trend trader knows: getting shaken out of a good trade too early, and getting chopped up in a sideways market. Release notes, chart examples and new product announcements are posted on the TrendTower channel:   https://www.mql5.com/en/channels/trendtower What It Does Rides trends longer.   The trailin
FREE
Trix Trend
Bugra Kaan Yildirim
Trix Trend algoteknik · MetaTrader 5 Indicator Manual Overview Trix Trend is a momentum oscillator based on TRIX — the rate of change of a triple-smoothed exponential moving average of price. Triple smoothing removes most of the short-term noise, so the oscillator reacts to the underlying momentum of the move rather than to every small wiggle, while staying more responsive than a simple long moving average. The indicator draws a slope-colored TRIX line, a weighted signal line, a zero line, and t
FREE
SVS Assistant
Bugra Kaan Yildirim
SVS Assistant SVS Assistant is the execution half of Smart Volatility Squeeze MT5. It carries out the orders you request from that indicator's 1-Click Trading Desk, applies your risk rules to them, and manages the resulting positions. It is published free of charge. Please read this before downloading: it does not analyse the market and it produces no signals of its own. Without the Smart Volatility Squeeze indicator running on the same chart there is nothing for it to listen to, and it will do
FREE
Smart Volatility Squeeze MT5 Smart Volatility Squeeze MT5 is a volatility compression and momentum expansion indicator for MetaTrader 5. It builds on John Carter's Volatility Squeeze framework and extends the usual single-tier squeeze into three compression tiers, so you can see not only whether the market is compressed but how tightly it is compressed before it expands. The indicator opens in a separate window and draws two elements: a linear regression momentum histogram and a row of coloured
Quant Desk Pro
Bugra Kaan Yildirim
Quant Desk Pro An R-native trade manager for MetaTrader 5.   It manages the trades you have already opened: it measures what each one is really risking, protects it, scales out of it on a plan you set, trails what is left, and stops the whole book when the day has gone far enough wrong. Read this first.   Quant Desk Pro does not open trades and has no signal. And it ships in   VIEW ONLY : it will not send a single order until you set   I understand the risks   to true in the inputs. Until you do
Quant Key Levels
Bugra Kaan Yildirim
Quant Key Levels, version 1.0. The reference levels a discretionary trader actually works from, on one chart and in one visual language. Eleven families, each on its own switch, and nothing on the chart that a level does not earn. What separates it from a pivot pack is not the number of families. It is that the things most level tools assume, this one measures. How far your broker's clock sits from UTC, measured out of your own terminal rather than typed into a box. Where an exchange actually op
Smart Chandelier Exit EA Smart Chandelier Exit EA is the Expert Advisor for the Smart Chandelier Exit indicator. It runs the indicator's chandelier engine by itself, with the same formula, the same default settings and the same fake-flip confirmation, and turns the confirmed flips into trades. A flip is traded only when it agrees with the higher timeframe, and every position carries a stop on the broker's server that follows the chandelier line and is never loosened. By default there is no fixed
Trend Regime Line
Bugra Kaan Yildirim
Trend Regime Line Version 1.1 · algoteknik What This Indicator Is Trend Regime Line reads the trend through a triad: three Larry Williams tools that each answer their own question, and one line on the price chart that is coloured only when the answers fit together. Williams %R says which side price is thrusting to, the Ultimate Oscillator whether momentum confirms that side, and Williams Accumulation/Distribution whether buying or selling pressure still backs it. Green means the triad agrees on
Filtrer:
Aucun avis
Répondre à l'avis