AC Pivot Panel
- Indicateurs
- Version: 1.3
- Mise à jour: 18 février 2023

AC Pivot Panel – Your Ultimate Pivot Trading Tool
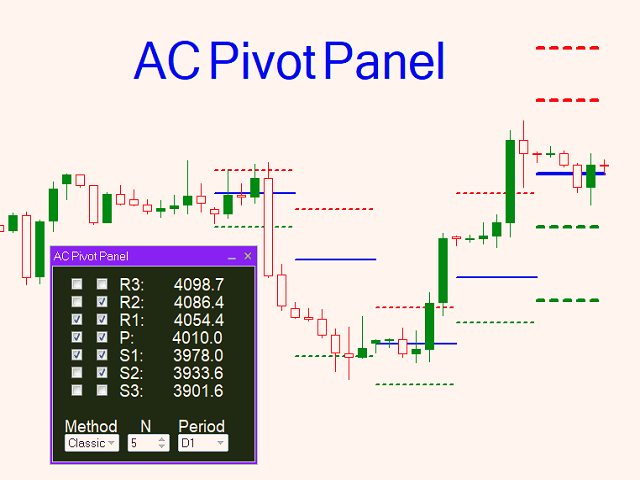
The AC Pivot Panel is a powerful yet user-friendly pivot point indicator designed to help traders identify key support and resistance levels with ease. Whether you’re a beginner or an experienced trader, this indicator simplifies pivot trading and enhances your decision-making process.
Key Features:
-
Interactive Selection Panel: Easily adjust pivot settings directly on the chart with a compact and intuitive panel.
-
Multiple Pivot Methods: Choose from Classic, Woodie, and Camarilla pivot calculation methods to suit your trading style.
-
Customizable Timeframes: Calculate pivots for H1, H4, D1, W1, and MN1 timeframes with just a few clicks.
-
Flexible Display Options: Show or hide specific pivot levels (supports and resistances) with a simple checkbox.
-
Visual Customization: Customize line colors and styles to match your chart setup.
Why Choose AC Pivot Panel?
-
User-Friendly: Designed for simplicity and speed.
-
Versatile: Supports multiple pivot methods and timeframes.
-
Reliable: Accurate and dynamic pivot calculations for real-time trading.
Free Version Available:
Try the AC Pivot Panel for free and experience its benefits firsthand. Your feedback and ratings are highly appreciated!
Very good product . Thanks to the owner.