QuantumBlocks

L'indicatore QuantumBlocks è uno strumento avanzato progettato per i trader che desiderano identificare con precisione zone di accumulazione o distribuzione nel mercato, comunemente note come "Order Blocks". Questi livelli rappresentano aree chiave dove istituzioni finanziarie o trader di grande volume piazzano i loro ordini, influenzando pesantemente il movimento dei prezzi.

Funzionalità principali:

  • Identificazione automatica dei blocchi di ordini rialzisti e ribassisti: L'indicatore scansiona il grafico e rileva con precisione sia i blocchi di ordini bullish (rialzisti) che bearish (ribassisti), fornendo una visualizzazione chiara delle zone in cui il prezzo potrebbe invertire o continuare il trend.

  • Impulso confermato: Per assicurare la validità dei blocchi di ordini, l'indicatore verifica la presenza di un impulso rialzista o ribassista che conferma la forza del movimento, utilizzando un numero configurabile di barre consecutive che rispettano i criteri di impulso.

  • Verifica delle ombre: L'indicatore calcola se la candela presenta ombre relativamente piccole rispetto al corpo, filtrando così solo i blocchi di ordini più rilevanti, dove l’azione del prezzo è ben definita.

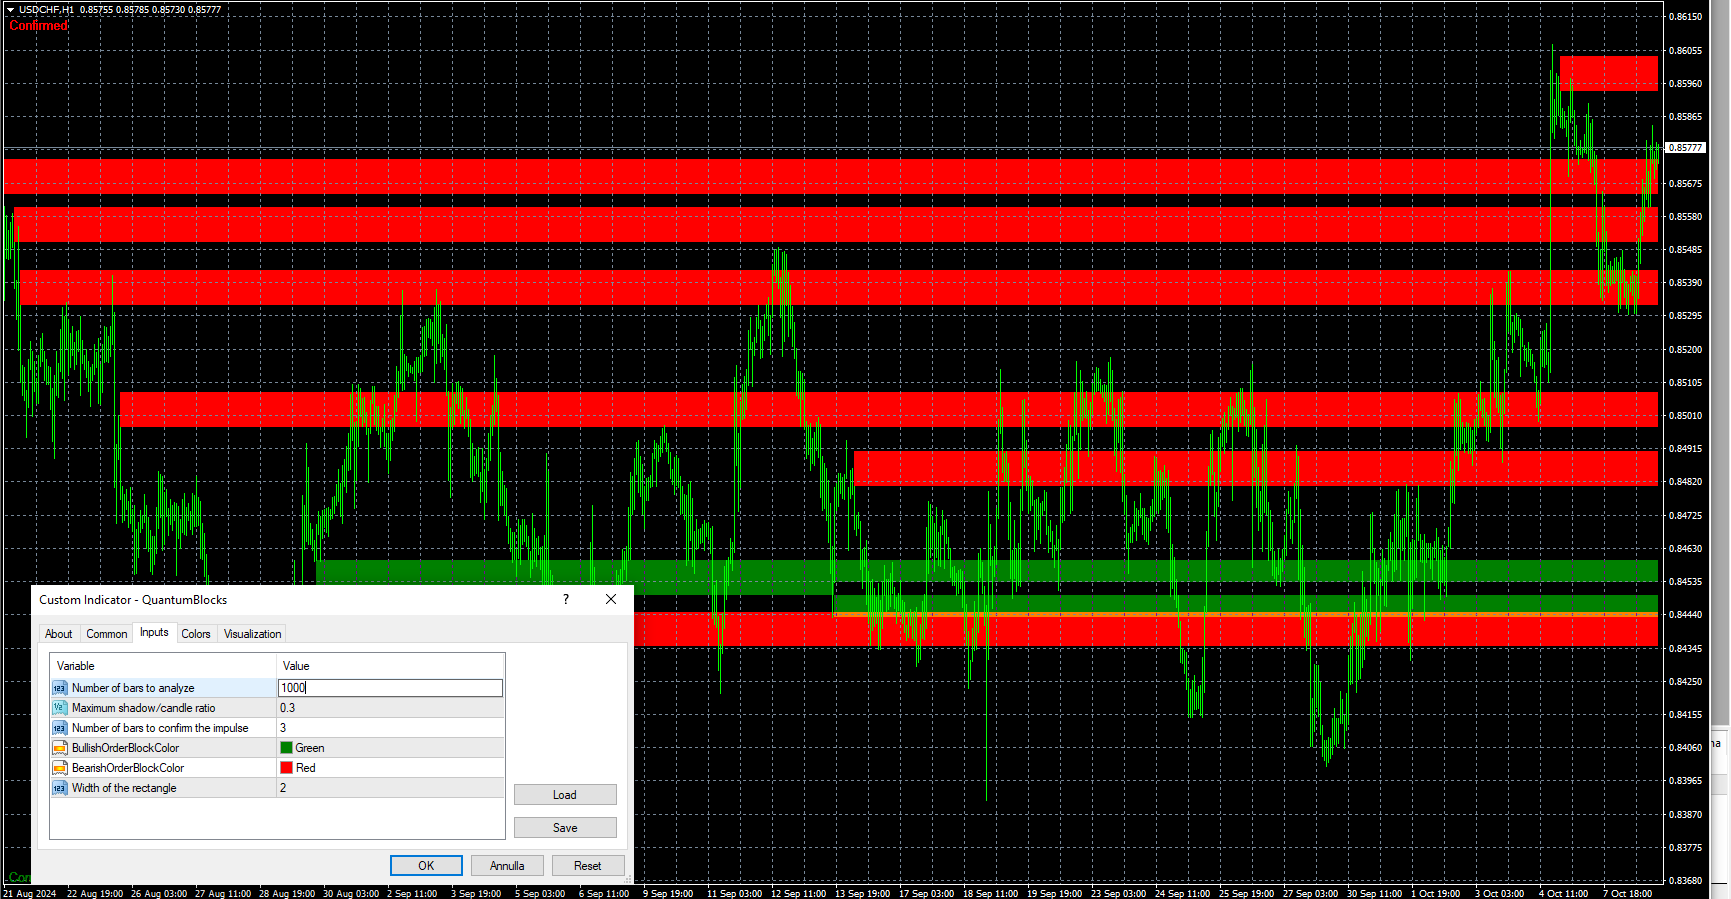
  • Visualizzazione intuitiva: I blocchi di ordini bullish e bearish vengono rappresentati graficamente tramite rettangoli colorati (verde per i blocchi bullish, rosso per i blocchi bearish), fornendo una chiara visualizzazione direttamente sul grafico. Ogni blocco viene accompagnato da un'etichetta "Confirmed" per indicare che il pattern è stato validato con successo.

  • Allerte integrate: Ogni volta che un nuovo blocco di ordini viene identificato, l'indicatore emette un allarme, sia visivo che sonoro, notificando immediatamente il trader della formazione di una nuova opportunità. Questo permette di intervenire tempestivamente nei momenti critici del mercato.

  • Multi-timeframe: L'indicatore può essere utilizzato su diversi timeframe, permettendo ai trader di analizzare i blocchi di ordini su periodi temporali multipli, aumentando la versatilità e fornendo una visione d'insieme più completa.

  • Configurabilità avanzata: Con diversi parametri personalizzabili, come il numero di barre da analizzare, il rapporto ombra/candela e la larghezza del rettangolo, l'indicatore è adattabile a diverse strategie di trading, rendendolo uno strumento potente sia per i trader intraday che per quelli a lungo termine.

Come funziona:

L'indicatore scansiona un certo numero di barre precedenti (configurabile dall'utente) per individuare i blocchi di ordini basati su una combinazione di trend e impulso. Se le condizioni di trend e ombra sono soddisfatte, viene disegnato un rettangolo che rappresenta il blocco di ordini sul grafico. Il rettangolo mostra l'area di prezzo in cui il mercato ha accumulato o distribuito liquidità, offrendo al trader una chiara zona di supporto o resistenza potenziale.

Ideale per:

  • Trader tecnici che utilizzano l’analisi della struttura del mercato.
  • Trader che cercano livelli chiave di supporto e resistenza nascosti al di fuori degli indicatori convenzionali.
  • Strategie di price action avanzate basate sull’analisi istituzionale.

L'indicatore Order Block è uno strumento essenziale per i trader che vogliono sfruttare al massimo le dinamiche di mercato, garantendo decisioni informate basate su aree di prezzo di alta probabilità.


Produits recommandés
ADX Pointer
Dominik Mandok
ADX Pointer is an indicator which is based on "Average Directional Index" and draws three numbers in chart window depending on the value of ADX. In ADX Pointer you can set "ADX_Period" which is of course period of Average Directional Index and you can also set 3 levels. When ADX value exceed first level ("ADX_Level1") in chart window appears number "1", when ADX exceed second level ("ADX_Level2") appears "2" and when ADX exceed third level ("ADX_Level3") appears "3". Simple. ADX Pointer works on
PABT Pattern Indicator - it's classical system one of the signal patterns. Indicator logic - the Hi & Lo of the bar is fully within the range of the preceding bar, look to trade them as pullback in trend. In the way if indicator found PABT pattern it's drawing two lines and arrow what showing trend way.  - First line - it's entry point and drawing at: 1. On the high of signal bar or on middle of the signal bar (depending from indicator mode) for buy; 2. On the low of signal bar or on middle of t
Crypto_Forex Indicator HTF Ichimoku pour MT4. - L'indicateur Ichimoku est l'un des indicateurs de tendance les plus puissants. HTF signifie - Higher Time Frame. - Cet indicateur est excellent pour les traders de tendance ainsi que pour la combinaison avec les entrées Price Action. - L'indicateur HTF Ichimoku vous permet d'attacher Ichimoku d'une période plus élevée à votre graphique actuel. - Tendance à la hausse - ligne rouge au-dessus de la bleue (et les deux lignes sont au-dessus du nuage)
Trend Flasher Trend is your friend is the age old saying quote in trading arena, there are though many ways to gauge the trend and its direction, more scientific measure and logically meaningful will be an ATR break outs to identify and spot the trend and its acceleration, so we created this easy to use trend identification panel and optimized super trend based multi time frame panel entry system to aid and help the traders to make their trading decision. Unique Features of Trend Flasher 1. H
"Auto FIBO Pro" Crypto_Forex indicator - est un excellent outil auxiliaire dans le trading ! - L'indicateur calcule et place automatiquement sur le graphique les niveaux de Fibo et les lignes de tendance locales (couleur rouge). - Les niveaux de Fibonacci indiquent les zones clés où le prix peut s'inverser. - Les niveaux les plus importants sont 23,6 %, 38,2 %, 50 % et 61,8 %. - Vous pouvez l'utiliser pour le scalping inversé ou pour le trading en grille de zones. - Il existe également de nombr
GMMA Trade X is an EA based on GMMA. GMMA parameters such as MovingAveragePeriod1-24, MovingAverageMAShift1-24, MovingAverageShift1-24 and CandlestickShift1-24 can be adjusted. GMMA Trade X applies BTN TECHNOLOGY's state-of-the-art intelligent technology to help you create optimal results for your trades. May your dreams come true through GMMA Trade X. Good luck. = == == Inquiries = == == E-Mail:support@btntechfx.com
Alpha Trend sign est notre outil de Trading très populaire depuis longtemps, il valide notre système de Trading et invite clairement les signaux de Trading sans dérive. Fonctions principales: • En fonction de la zone active du marché, selon les indicateurs, il est intuitif de déterminer si le cours actuel appartient à la tendance ou à la tendance. Et coupez le marché selon les flèches d'indication de l'indicateur, les flèches vertes suggèrent d'acheter et les flèches rouges suggèrent de vend
Indicador Taurus All4
Fabio Oliveira Magalhaes
Taurus All4 Taurus All4 is a high-performance indicator, it will tell you the strength of the trend, and you will be able to observe the strength of the candle. Our indicator has more than 4 trend confirmations. It is very simple and easy to use. Confirmation Modes Candle Trend Confirmations: When the candle switches to light green the trend is high. When the candle switches to light red the trend is reverting down. When the candle changes to dark red the trend is low. Trendline Trend Confirm
This indicator softens the value of the RSI (Relative Strength Index) and reduces its volatility. You can use this indicator in your expert advisors, indicators and strategies. With this indicator, you don't need to have two indicators on the chart at the same time. For example, an RSI indicator and a Moving Average indicator If you have any questions or concerns, contact me.
FREE
DMAX pro
Danny Teoh Kok Keong
DMAX SIGNAL IS VERY POWERFUL TOOL TO HELP YOU ENTRY,ITS CAN DETECT OVERSOLD AND OVERBOUGHT IN FOREX MARKET. ITS CAN TRADE 24 FOREX PAIR IN MARKET, 80% ACCURATE RESULT. MANY TRADER FAIL BECAUSE OF ENTRY POINT AND EXIT POINT , SIGNAL OF DMAX WILL GIVE VERY GOOD SIGNAL TO LET YOU KNOW WHERE TO ENTRY AND EXIT.  RISK MANAGEMENT IS VERY IMPORTANT IN TRADING FOREX, PLEASE DONT RISK OVER 5% PER TRADE IS FORE MARKET
Titan Action HUD - The Ultimate SMC Matrix Transform your MT5 into a professional trading station. Titan Action HUD is not just a dashboard; it's a multi-timeframe analytical brain that scans the markets for you 24/7. No more flipping between 5 different charts to find a setup. NEW: Dynamic Corner Anchoring In version 6.10, we introduced Dynamic Anchoring . Whether you have a wide-screen or a laptop, you can now pin the HUD to any corner (Top-Right, Bottom-Left, etc.). The HUD will automatica
Smoothed Heiken Ashi with AC/AO Zones – Professional Trading Clarity Transform your Heiken Ashi analysis with intelligent smoothing that eliminates noise while preserving actionable signals. What Makes This Different? This isn't just another Heiken Ashi indicator. We've engineered a sophisticated smoothing engine that works with the Accelerator (AC) and Awesome Oscillator (AO) zone logic to give you cleaner entries and exits without sacrificing responsiveness. Four Smoothing Methods at Your Comm
FutureTrade
Andrey Spiridonov
3 (2)
FutureTrade is one of the few indicators that predicts the price right on the price chart. The indicator calculation algorithm is based on the fast Fourier transform. Given the oscillatory behavior of the price, the Fourier function predicts its future behavior. The indicator should be attached in the usual way to a chart with the trading instrument specified symbol and with the M15 timeframe. This timeframe is the most optimal for working with any symbols. Once started, the indicator calculates
The Range Directional Force Indicator is designed to help traders analyze market trends, reversals, and directional strength. It focuses on price movements within defined ranges, identifying key moments when the market is gaining momentum or preparing for a shift. By dividing the chart into dynamic price ranges, the indicator detects critical support and resistance levels. It calculates the directional force of price movements, highlighting potential entry and exit points based on market sentim
Wave Wolf MT4
Andrei Salanevich
L'indicateur Forex Wave Wold MT4 est conçu pour rechercher les vagues de Woolf et les afficher dans la fenêtre actuelle du terminal de trading. Un excellent indicateur pour les traders utilisant les vagues de Wolf dans le commerce. Son application dans les stratégies de trading augmentera considérablement leur efficacité et leur rentabilité. INFORMATIONS SUR L'INDICATEUR Contrairement à d'autres indicateurs de vague Wold, l'indicateur Forex Wave Wold MT4 a un certain nombre de caractéristiques
Stepping Trend
Mpendulo Chiliza
The Stepping Trend Indicator     The Steppi ng Trend indicator uses the  average true range  (ATR indicator) in its calculation. This gives you control to set your own average true range period, I set the Default as 10.   Indicator Details. Green Arrow Up: This means you are at the starting point of a new bullish trend, it’s time to buy.   Red  Arrow  Down : This means you are at the starting point of a new  bearish  trend, it’ s time to sell .   What if you miss the Arrow Signal?   No prob
MACD Divergence
Sergey Deev
2.5 (2)
The indicator detects divergence signals - the divergences between the price peaks and the MACD oscillator values. The signals are displayed as arrows in the additional window and are maintained by the messages in a pop-up window, e-mails and push-notifications. The conditions which formed the signal are displayed by lines on the chart and in the indicator window. Indicator Parameters MacdFast - fast MACD line period MacdSlow - slow MACD line period MacdSignal - MACD signal line period MacdPric
Complete SMC/ICT Indicator MT5 — Outil Smart Money Concepts   Le Complete SMC/ICT Indicator est un outil d’analyse Smart Money Concepts autonome qui fonctionne directement dans la fenêtre du graphique. Il offre une détection de niveau institutionnel des structures de marché, des déséquilibres et des zones de liquidité, avec une personnalisation complète et des alertes.   Fonctionnalités   L’indicateur détecte dix éléments clés du SMC : sommets et creux de swing, fair value gaps, order blocks, c
[ZhiBiCCI] indicators are suitable for all cycle use, and are also suitable for all market varieties. [ZhiBiCCI] Green solid line is a reversal of bullish divergence. The green dotted line is a classic bullish divergence. [ZhiBiCCI] The solid line to the red is a reverse bearish divergence. The red dotted line is a classical bearish divergence. [ZhiBiCCI] can be set in the parameters (Alert, Send mail, Send notification), set to (true) to send instant signals to the alarm window, email, insta
VR Cub
Vladimir Pastushak
VR Cub est un indicateur permettant d'obtenir des points d'entrée de haute qualité. L'indicateur a été développé pour faciliter les calculs mathématiques et simplifier la recherche de points d'entrée dans un poste. La stratégie de trading pour laquelle l'indicateur a été rédigé prouve son efficacité depuis de nombreuses années. La simplicité de la stratégie de trading est son grand avantage, qui permet même aux traders débutants de négocier avec succès avec elle. VR Cub calcule les points d'ouve
Surfez sur la tendance – Un signal clair pour suivre la vague Sur les marchés financiers, les opportunités les plus stables de gains se trouvent généralement lors de phases de tendance bien établies. Pourtant, même pour les traders expérimentés, il n’est pas toujours facile de capter ces mouvements. Ride the Trend Signal est un indicateur de signal conçu pour repérer les « pullbacks » dans les tendances haussières ou baissières. Plutôt que d’entrer dès le début de la tendance, il attend une conf
FREE
Indicator for determining the trend. The arrows and lines on the chart show the price reversal and the probable current trend or correction. You should always trade in the direction of the arrow. It is best to use the indicator on several time frames at once and enter the market when all time frames have the same arrow. For example, we open a sell trade if there is a red arrow on the M5, M30 and H4 timeframes. Or we open a buy deal if the indicator shows a blue arrow on all timeframes. Advanta
ReboltP
David Theodore Caro-greene
Rebalance Overlay Technology (Rebolt) enables the trader to visualize the flow of money from one chart to another chart. Rebolt Probability indicates the probability that money has flowed from one chart to another chart for a specified length of time over a number of intervals specified by the user. When Rebolt reads Cyan or Blue these are buying signs good for the length of time specified by the user or until a conflicting signal arises. When Rebolt reads Violet or Red there are selling signs g
This indicator is another variant of the famous powerful indicator Fibonacci-SS https://www.mql5.com/en/market/product/10136 but has different behaviour in placing Pending Order and TP Line. Automatically places Fibonacci retracement lines from the last highest and lowest visible bars on the chart with: An auto Pending Order (Buy/Sell). Taking Profit 1, Taking Profit 2 is pivot point and Taking Profit 3 for extended reward opportunity. The best risk and reward ratio. Simple and powerful indicat
Simple to read and powerful, no fancy lines and drawings to clutter your chart or distract you. The trend probability oscillator estimates how likely a trend will continue in a certain period. The cummulator period controls how many bars in the past to use and is a proxy for the timescale the trend probability should hold. The use of a Max Line improves this further by indicating when a trend is likely to reverse. In most cases a trend must lose momentum before reversing. Hence, a trend probabil
SPECIAL PRICE  Great offers on all products. Great opportunities. Three overlapping Bollinger. This indicator is ready for use with three overlapping bollinger bands. Ideal for traders who love bollinger bands who in this way can see directly from a graph how the bollinger bands move in a higher Timeframe without having to change the graph and timeframe. This indicator identifies the real squeezes that start on three different timeframes. The signal thus becomes more valid and certain.
KDJ Index 4   交易实用必备工具指标 波浪自动计算指标,通道趋势交易 完美的趋势-波浪自动计算通道计算 , MT4版本 完美的趋势-波浪自动计算通道计算 , MT5版本 本地跟单复制交易 Easy And Fast Copy , MT4版本 Easy And Fast Copy , MT5版本 本地跟单复制交易 模拟试用 Easy And Fast Copy , MT4 模拟账号运行 Easy And Fast Copy , MT5 模拟账号运行 "Cooperative QQ:556024  "  "Cooperation wechat:556024"  "Cooperative email:556024@qq.com" 强烈推荐趋势指标, 波浪的标准自动计算   和   波浪的标准自动计算MT5版本     KDJ指标又叫 随机指标 ,是一种相当新颖、实用的技术分析指标,它起先用于期货市场的分析,后被广泛用于股市的中短期趋势分析,是期货和股票市场上最常用的技术分析工具。 随机指标KDJ一般是用于股票分析的统计体系,根据统计学原理,通过一个特定的周期(常为9日、9周等)
Indicateur Crypto_Forex « CCI avec zones dynamiques de survente/surachat » pour MT4, sans refonte. - L'indice CCI (Commodity Channel Index) est excellent pour le trading Momentum dans le sens de la tendance. - Il est idéal pour prendre des positions de vente depuis une zone dynamique de surachat et des positions d'achat depuis une zone dynamique de survente dans le sens de la tendance principale. - Cet indicateur est également idéal pour combiner des positions de prix. - Zone dynamique de sura
Infinity Trend Pro
Yaroslav Varankin
1 (1)
This is a trend indicator without redrawing Developed instead of the binary options strategy (by the color of the Martingale candlestick) Also works well in forex trading When to open trades (binary options) A signal will appear in the place with a candle signaling the current candle It is recommended to open a deal for one candle of the current timeframe M1 and M5 When a blue dot appears, open a deal up When a red dot appears, open a trade down. How to open trades on Forex. When a signal is rec
Dear traders this is Our new Indicator called Hull Pro MTF Indicator — Precision Multi-Timeframe Trend Visualizer Overview The Hull Pro MTF Indicator is a next-generation Heiken-Ashi-based multi-timeframe visual tool designed for top-down market analysis . It blends the power of Hull Moving Average (HMA) logic and multi-level Heiken-Ashi smoothing to reveal directional bias, volatility ranges, and price symmetry across hourly, daily, weekly, monthly, and yearly structures — all in a single c
Les acheteurs de ce produit ont également acheté
Neuro Poseidon MT4
Daria Rezueva
4.96 (24)
Neuro Poseidon is a new indicator by Daria Rezueva. It combines precise trading signals with adaptive TP/SL levels - creating best possible trades as a result! Message me and get  Neuro Poseidon Assistant  as a gift to automize your trading process! What makes it stand out? 1. Proven profitability on all assets and timeframes 2. Only confirmed BUY and SELL signals present on the chart 3. Adaptive TP & SL levels generated by the software for each trade 4. Easy to understand - suitable for all
M1 Sniper
Oleg Rodin
5 (23)
M1 SNIPER est un système d'indicateurs de trading facile à utiliser. Il s'agit d'un indicateur à flèche conçu pour l'unité de temps M1. Cet indicateur peut être utilisé seul pour le scalping sur l'unité de temps M1 ou intégré à votre système de trading existant. Bien que conçu spécifiquement pour le trading sur l'unité de temps M1, ce système peut également être utilisé avec d'autres unités de temps. Initialement, j'avais conçu cette méthode pour le trading du XAUUSD et du BTCUSD. Cependant, je
Gann Made Easy
Oleg Rodin
4.84 (164)
Gann Made Easy est un système de trading Forex professionnel et facile à utiliser qui est basé sur les meilleurs principes de trading en utilisant la théorie de mr. WD Gann. L'indicateur fournit des signaux d'ACHAT et de VENTE précis, y compris les niveaux Stop Loss et Take Profit. Vous pouvez échanger même en déplacement en utilisant les notifications PUSH. VEUILLEZ ME CONTACTER APRÈS L'ACHAT POUR RECEVOIR GRATUITEMENT DES INSTRUCTIONS DE TRADING ET D'EXCELLENTS INDICATEURS SUPPLÉMENTAIRES! Vou
Scalper Inside PRO
Alexey Minkov
4.74 (68)
Scalper Inside PRO Scalper Inside PRO is an intraday trend and scalping indicator for MetaTrader 4 that uses an exclusive algorithm to quickly detect market direction and key target levels. It automatically calculates entry, exit and multiple profit targets, and shows detailed performance statistics so you can see how different instruments and strategies performed. This helps you choose the most suitable trading instruments for the current market conditions. Additionally, you can easily integrat
Le système PRO Renko est un système de trading très précis spécialement conçu pour le trading de graphiques RENKO. Il s'agit d'un système universel qui peut être appliqué à divers instruments de négociation. Le système neutralise efficacement ce qu'on appelle le bruit du marché en vous donnant accès à des signaux d'inversion précis. L'indicateur est très facile à utiliser et n'a qu'un seul paramètre responsable de la génération du signal. Vous pouvez facilement adapter l'outil à n'importe que
Dynamic Forex28 Navigator
Bernhard Schweigert
4.43 (7)
Dynamic Forex28 Navigator - L'outil de trading Forex de nouvelle génération. ACTUELLEMENT 49 % DE RÉDUCTION. Dynamic Forex28 Navigator est l'évolution de nos indicateurs populaires de longue date, combinant la puissance de trois en un : Advanced Currency Strength28 Indicator (695 avis) + Advanced Currency IMPULSE avec ALERT (520 avis) + CS28 Combo Signals (Bonus). Détails sur l'indicateur https://www.mql5.com/en/blogs/post/758844 Qu'offre l'indicateur de force de nouvelle génération ? Tout
Trend Catcher ind
Ramil Minniakhmetov
INDICATEUR DE DÉTECTEUR DE TENDANCE L'indicateur de détecteur de tendance analyse les mouvements de prix du marché grâce à une combinaison d'indicateurs d'analyse de tendance adaptatifs, propriétaires et personnalisés. Il identifie la véritable direction du marché en filtrant les fluctuations à court terme et en se concentrant sur la force de la dynamique sous-jacente, l'expansion de la volatilité et la structure des prix. Il utilise également une combinaison d'indicateurs personnalisés de lis
Trend Lines PRO
Roman Podpora
5 (1)
TREND LINES PRO     Cet indicateur permet de comprendre les véritables changements de direction du marché. Il révèle les renversements de tendance et les points de retour des principaux acteurs. Tu vois     Lignes BOS     Détection des changements de tendance et des niveaux clés sur des unités de temps supérieures, sans paramètres complexes ni interférences inutiles. Les signaux restent affichés sur le graphique même après la fermeture de la bougie. VERSION MT 5    -     Révèle son potentiel max
Enigmera
Ivan Stefanov
5 (8)
ENIGMERA : Le cœur du marché Important : La démo de MQL5.com fonctionne dans le Strategy Tester et peut ne pas refléter pleinement les fonctionnalités d'Enigmera. Consultez la description, les captures d'écran et la vidéo pour plus de détails. N'hésitez pas à m'envoyer un message si vous avez des questions ! Le code de l'indicateur a été entièrement réécrit. La version 3.0 ajoute de nouvelles fonctionnalités et corrige les bugs accumulés depuis le lancement de l'indicateur. Introduction Cet in
KT Alpha Hunter Arrows MT4
KEENBASE SOFTWARE SOLUTIONS
La plupart des indicateurs à flèches vous donnent un signal, puis vous laissent gérer tout le reste seul. KT Alpha Hunter Arrows vous fournit un plan de trading complet. Chaque flèche de signal s’affiche avec un plan déjà tracé : ligne d’entrée, stop loss, quatre niveaux de take profit et un verdict d’edge en temps réel indiquant si ce symbole et cette unité de temps méritent d’être tradés maintenant. Le package inclut un Trade Manager EA qui prend en charge l’exécution après votre entrée, afin
Cet indicateur est un indicateur d'analyse automatique des vagues, parfait pour le trading pratique ! Cas... Remarque :   je n'ai pas l'habitude d'utiliser des noms occidentaux pour l'évaluation des vagues. En raison de l'influence de la convention de dénomination de Tang Lun (Tang Zhong Shuo Zen), j'ai nommé la vague de base comme   un stylo   et la bande d'onde secondaire comme   un segment   . en même temps, le segment a la direction de la tendance.Le   segment de tendance principal   est no
Genesis Matrix Pro is a professional multi-timeframe trend detection indicator designed to help traders identify high-quality market alignment with clarity and structure. It combines 12 different technical indicators into one visual alignment matrix, allowing traders to quickly see when market conditions are bullish, bearish, or neutral. A signal is generated only when the selected strategies are aligned, helping reduce noise and improve decision-making. PLEASE CONTACT ME AFTER PURCHASE TO GET
Ce produit a été mis à jour pour le marché 2026 et optimisé pour les dernières versions de MT5. AVIS DE MISE À JOUR DU PRIX : Smart Trend Trading System est actuellement disponible à $99 . Le prix passera à $199 après les 30 prochains achats . OFFRE SPÉCIALE : Après avoir acheté Smart Trend Trading System, envoyez-moi un message privé pour recevoir Smart Universal EA GRATUITEMENT et transformer vos signaux Smart Trend en trades automatisés. Smart Trend Trading System est un système de trading c
MTF Supply Demand Zones
Georgios Kalomoiropoulos
4.82 (22)
Nouvelle génération de zones d'approvisionnement et de demande automatisées. Algorithme nouveau et innovant qui fonctionne sur n'importe quel graphique. Toutes les zones sont créées dynamiquement en fonction de l'action des prix du marché. DEUX TYPES D'ALERTES --> 1) QUAND LE PRIX ATTEINT UNE ZONE 2) QUAND UNE NOUVELLE ZONE SE FORME Vous n'obtenez pas un indicateur inutile de plus. Vous obtenez une stratégie de trading complète avec des résultats prouvés.     Nouvelles fonctionnalités:   
PZ Trend Trading
PZ TRADING SLU
4.8 (5)
Capture every opportunity: your go-to indicator for profitable trend trading Trend Trading is an indicator designed to profit as much as possible from trends taking place in the market, by timing pullbacks and breakouts. It finds trading opportunities by analyzing what the price is doing during established trends. [ Installation Guide | Update Guide | Troubleshooting | FAQ | All Products ] Trade financial markets with confidence and efficiency Profit from established trends without getting whips
Step into the world of Forex trading with confidence, clarity, and precision using   Gold Indicator   a next-generation tool engineered to take your trading performance to the next level. Whether you’re a seasoned professional or just beginning your journey in the currency markets, Gold Indicator equips you with powerful insights and help you trade smarter, not harder. Built on the proven synergy of three advanced indicators, Gold Indicator focuses exclusively on medium and long-term trends eli
MetaBands M4
Vahidreza Heidar Gholami
3.5 (6)
MetaBands uses powerful and unique algorithms to draw channels and detect trends so that it can provide traders with potential points for entering and exiting trades. It’s a channel indicator plus a powerful trend indicator. It includes different types of channels which can be merged to create new channels simply by using the input parameters. MetaBands uses all types of alerts to notify users about market events. Features Supports most of the channel algorithms Powerful trend detection algorith
Current event:  https://c.mql5.com/1/326/A2SR2025_NoMusic.gif A. Qu'est-ce que l'A2SR ?   * C'est un indicateur technique avancé (pas de peinture, pas de retard). -- Conseils : -- sur https://www.mql5.com/en/blogs/post/734748/page4#comment_16532516 -- et https://www.mql5.com/en/users/yohana/blog A2SR a une technique spéciale pour déterminer les niveaux de Support (demande) et de Résistance (offre). Contrairement à la manière ordinaire que nous avons vue sur le net, A2SR a un concept original
Version Swing M30/H1/H4 disponible Attraper les grands mouvements ? Gold Signal Swing Pro (M30/H1/H4). Objectif : $20-$80+ par trade. https://www.mql5.com/en/market/product/177643 KURAMA GOLD SIGNAL PRO (MT4) — Système de Trading XAUUSD Complet avec Filtre à 7 Couches, TP/SL Automatique et Notation de Qualité PAS DE REPAINT. PAS DE REDESSIN. PAS DE RETARD. Chaque signal est permanent. Ce que vous voyez est ce que vous obtenez. BONUS : Achetez la lice
BTMM State Engine Pro is a MetaTrader 4 indicator for traders who use the Beat The Market Maker approach: Asian session context, kill zone timing, level progression, peak formation detection, and a multi-pair scanner from a single chart. It combines cycle state logic with a built-in scanner dashboard so you do not need the same tool on many charts at once. What it does Draws the Asian session range; session times can follow broker server offset or be set in inputs. Tracks level progression (L
Advanced Supply Demand
Bernhard Schweigert
4.91 (300)
Offre spéciale : 40 % de réduction La solution idéale pour les traders débutants comme experts ! Cet indicateur est un outil de trading unique, performant et abordable grâce à l’intégration de nombreuses fonctionnalités exclusives et d’une nouvelle formule. Cette mise à jour vous permet d’afficher des zones sur deux unités de temps. Vous pourrez ainsi visualiser non seulement une unité de temps supérieure, mais aussi l’unité de temps du graphique, ainsi que l’unité de temps supérieure : des z
Price & Time Market Structure Indicator A professional market structure tool that analyzes waves through both price and time — not price alone. Main Description NeoWave PRO is a professional market structure indicator for MetaTrader 4 designed for traders who want to move beyond traditional one-dimensional wave tools such as ZigZag, swing indicators, and basic high/low systems. Most wave indicators analyze only one thing: Price. But a real market wave is not only a price movement. A true wave de
RFI levels PRO
Roman Podpora
5 (1)
L'indicateur montre avec précision les points de retournement et les zones de retour des prix où le       Acteurs majeurs   . Vous repérez les nouvelles tendances et prenez des décisions avec une précision maximale, en gardant le contrôle de chaque transaction. VERSION MT5     -     Révèle son potentiel maximal lorsqu'il est combiné à l'indicateur   TREND LINES PRO Ce que l'indicateur montre : Structures et niveaux d'inversion avec activation au début d'une nouvelle tendance. Affichage des nive
Quant Direction
Georgios Kalomoiropoulos
Quant Direction est un outil d'analyse de marché 3D. Il fournit une analyse de marché parfaitement objective, basée sur un algorithme, en calculant des écarts précis en pourcentage sur différents paramètres. Développé à l'aide d'outils de modélisation avancés basés sur l'IA et soumis à des tests rigoureux, cet algorithme analyse le marché avec une précision inégalée. Vous pouvez analyser n'importe quelle paire de devises ou instrument financier sur la plateforme. Que vous pratiquiez le trading à
MonsterDash Harmonic Indicator is a harmonic pattern dashboard. It recognizes all major patterns. MonsterDash is a dashboard that displays all detected patterns for all symbols and (almost) all timeframes in sortable and scrollable format. Users can add their own user defined patterns . MonsterDash can open and update charts with the pattern found. Settings MonsterDash's default settings are good enough most of the time. Feel free to fine tune them to your needs. The color settings are for thos
Apollo SR Master est un indicateur de support/résistance doté de fonctionnalités spéciales qui simplifient et fiabilisent le trading basé sur les zones de support/résistance. Cet indicateur calcule ces zones en temps réel, sans aucun décalage, en détectant les sommets et les creux locaux des prix. Pour confirmer la nouvelle zone de support/résistance, il affiche un signal spécifique indiquant que cette zone peut être prise en compte et utilisée comme un véritable signal d'achat ou de vente. Dans
ACTUELLEMENT 40% DE RÉDUCTION La meilleure solution pour tout débutant ou trader expert ! Cet indicateur est un outil de trading unique, de haute qualité et abordable car nous avons incorporé un certain nombre de caractéristiques exclusives et une nouvelle formule. Avec seulement UN graphique, vous pouvez lire la force de la devise pour 28 paires Forex ! Imaginez comment votre trading va s'améliorer parce que vous êtes capable de repérer le point de déclenchement exact d'une nouvelle tendance
Auto Optimized Parabolic RSI : Moteur de Momentum 3D Avancé La plupart des indicateurs pour les particuliers échouent car ils s'appuient sur des paramètres statiques qui se brisent dès que la volatilité du marché change. L'Auto Optimized Parabolic RSI résout le problème de l'« obsolescence des indicateurs » en recalculant continuellement son propre avantage mathématique, apportant une adaptation quantitative de niveau institutionnel directement sur votre terminal MT5. L'Avantage Principal : Opti
PZ 123 Pattern
PZ TRADING SLU
1 (1)
Unlock powerful breakout opportunities The 123 Pattern is one of the most popular, powerful and flexible chart patterns. The pattern is made up of three price points: a bottom, a peak or valley, and a Fibonacci retracement between 38.2% and 71.8%. A pattern is considered valid when the price breaks beyond the last peak or valley, moment at which the indicator plots an arrow, rises an alert, and the trade can be placed. [ Installation Guide | Update Guide | Troubleshooting | FAQ | All Products  ]
Market Makers
Mohamed Hassan
5 (4)
After purchase, contact me privately to receive 1 month of free testing with EA Forex Proton! This advanced MT4 trading robot automatically executes signals from any MT4 indicator, including Market Makers. The latest version also includes AI integration, allowing each trade signal to be analyzed using Artificial Intelligence. Live Signal with EA Forex Proton: Click here Market Makers is a powerful price action trading system designed to identify high-probability Buy and Sell opportunities based
Plus de l'auteur
Statistical Trend Indicator is an advanced custom indicator designed to analyze market movements and provide traders with calculated probabilities of upward or downward trends. By analyzing historical price data over a specified lookback period, this indicator computes the likelihood of the market continuing in either direction, offering traders a statistical edge in decision-making. Key Features: Probability Display: It calculates and displays the percentage probabilities of an upward or down
Scopri l'Indicatore Avanzato di Zone di Offerta e Domanda Sei pronto a portare il tuo trading al livello successivo? L'indicatore "Advanced Supply and Demand Zone" è lo strumento definitivo per identificare con precisione le zone chiave di supporto e resistenza sul mercato, permettendoti di prendere decisioni informate e tempestive. Come Funziona Questo indicatore innovativo analizza il mercato utilizzando frattali veloci e lenti per individuare i punti di inversione del prezzo. Si basa sui prin
Filtrer:
Aucun avis
Répondre à l'avis