Rejoignez notre page de fans
- Vues:
- 6033
- Note:
- Publié:
-
Besoin d'un robot ou d'un indicateur basé sur ce code ? Commandez-le sur Freelance Aller sur Freelance
Real author: Perky_z
An indicator of financial asset volatility using the OSMA oscillator.
Indicator formula:
, where:
- Abs(OSMA) - absolute value of the OSMA indicator;
- Point - point value in the price chart units;
- Level - the price changed level specified in the inputs, which should be considered as flat (all OSMA values below this level make the indicator negative).
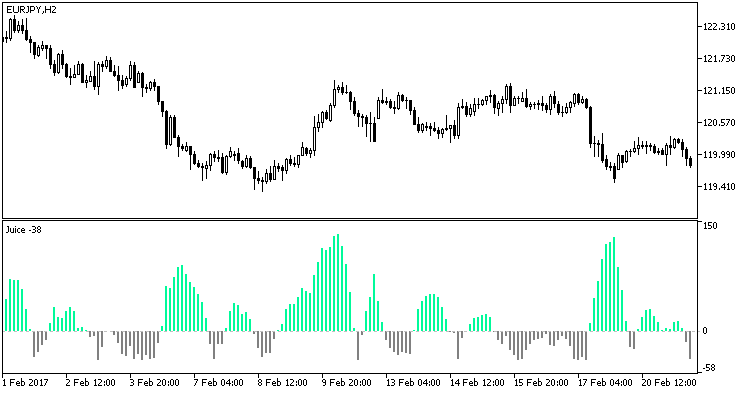
The trend is believed to be strong, if the indicator above zero is colored in light green. In this situation, if other indicators provide a trade signal, a position can be opened.

Fig1. The JuiceZ indicator
Traduit du russe par MetaQuotes Ltd.
Code original : https://www.mql5.com/ru/code/17686
 Exp_XOSignal_ReOpen
The Exp_XOSignal_ReOpen trading system based on the signals of the XOSignal indicator with trend following scaling
 ICHI_OSC_HTF
The ICHI_OSC indicator with the timeframe selection option available in input parameters
 ColorSTD_Histogram_HTF
The ColorSTD_Histogram indicator with the timeframe selection option available in the input parameters.
 Exp_IBS_RSI_CCI_v4_X2
The Exp_IBS_RSI_CCI_v4_X2 trend-following trading system is based on the signals of two IBS_RSI_CCI_v4 indicators.