Rejoignez notre page de fans
- Publié par:
- Sergey Golubev
- Vues:
- 23099
- Note:
- Publié:
- Mise à jour:
-
Besoin d'un robot ou d'un indicateur basé sur ce code ? Commandez-le sur Freelance Aller sur Freelance
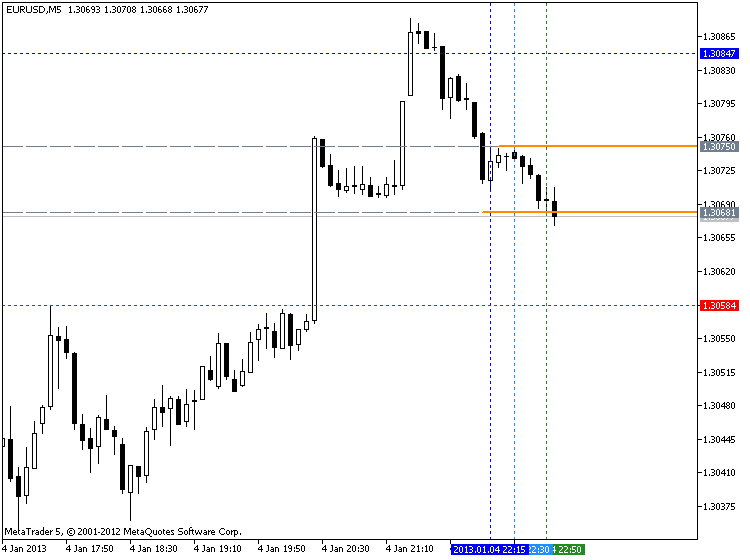
The indicator draws support/resistance lines and the trend lines in the chart.
At first it was used as a part of Paramon scalping on М5 and М15 timeframes. Later it was used as an independent indicator to trade on М1 and H4/D1.
Support/resistance lines and trend lines are drawn on the number of bars that can be changed in the indicator settings.

Recommendations:
- Use the indicator to trade on the lower timeframes, and for the technical analyses on higher timeframes.
- The most interesting are support/resistance lines drawn by a dotted red/blue color and that indicates possible buy stop and sell stop pending orders.
- The multi-timeframe indicator. Thus to use two or more indicators in one chart use the UniqueID parameter that must be any but unique for each indicator.
Traduit du russe par MetaQuotes Ltd.
Code original : https://www.mql5.com/ru/code/1434
 Exp_StepSto_v1
The Expert Advisor drawn on the basis of the signals of the StepSto_v1 stochastic oscillator
 Exp_CandleStop_Trailing
The Expert Advisor moves Stop Loss of the open position along the border of the channel built using CandleStop indicator
 Exp_TrendEnvelopes
The Expert Advisor drawn on the basis of the TrendEnvelopes semaphore, signal indicator
 ColorSchaffTrendCycle
The SchaffTrendCycle oscillator performed as a color histogram.